当前位置:网站首页>BEAUTIFUL GGPLOT VENN DIAGRAM WITH R
BEAUTIFUL GGPLOT VENN DIAGRAM WITH R
2022-07-02 11:49:00 【Xiaoyu 2022】
if (!require(devtools)) install.packages("devtools")
devtools::install_github("gaospecial/ggVennDiagram")
library("ggVennDiagram")
library("ggVennDiagram")
set.seed(20190708)
genes <- paste("gene",1:1000,sep="")
x <- list(
A = sample(genes,300),
B = sample(genes,525),
C = sample(genes,440),
D = sample(genes,350)
)
# Default plot
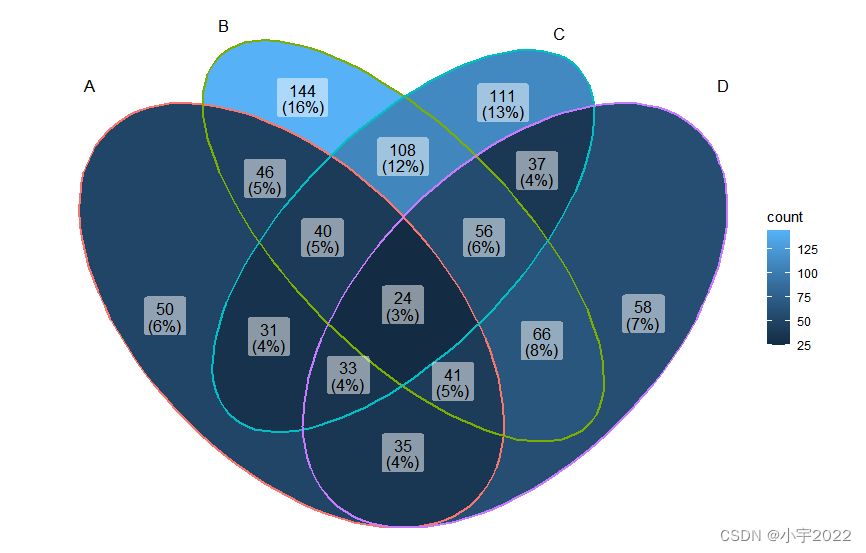
ggVennDiagram(x)
if (!require(devtools)) install.packages("devtools")
devtools::install_github("gaospecial/ggVennDiagram")
library("ggVennDiagram")
library("ggVennDiagram")
set.seed(20190708)
genes <- paste("gene",1:1000,sep="")
x <- list(
A = sample(genes,300),
B = sample(genes,525),
C = sample(genes,440),
D = sample(genes,350)
)
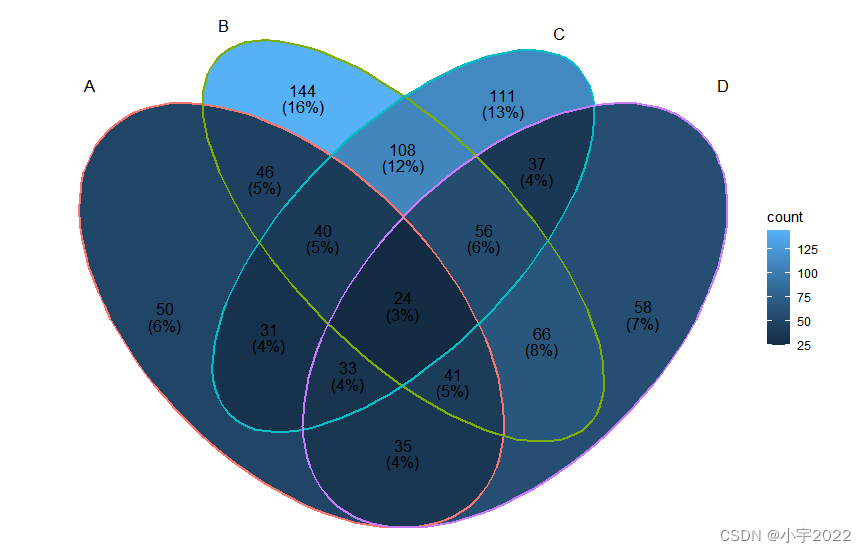
ggVennDiagram(x, label_alpha = 0)
if (!require(devtools)) install.packages("devtools")
devtools::install_github("gaospecial/ggVennDiagram")
library("ggVennDiagram")
library("ggVennDiagram")
set.seed(20190708)
genes <- paste("gene",1:1000,sep="")
x <- list(
A = sample(genes,300),
B = sample(genes,525),
C = sample(genes,440),
D = sample(genes,350)
)
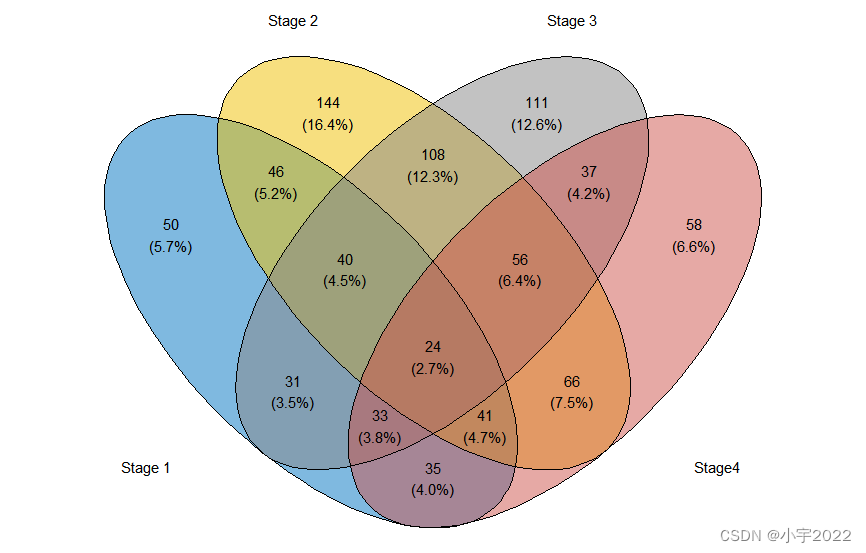
# Change category names
# Change the gradient fill color
ggVennDiagram(
x, label_alpha = 0,
category.names = c("Stage 1","Stage 2","Stage 3", "Stage4")
) +
ggplot2::scale_fill_gradient(low="blue",high = "yellow")

if (!require(devtools)) install.packages("devtools")
devtools::install_github("gaospecial/ggVennDiagram")
library("ggVennDiagram")
library("ggVennDiagram")
set.seed(20190708)
genes <- paste("gene",1:1000,sep="")
x <- list(
  A = sample(genes,300),
  B = sample(genes,525),
  C = sample(genes,440),
  D = sample(genes,350)
)
ggVennDiagram(x[1:3], label_alpha = 0)

if (!require(devtools)) install.packages("devtools")
devtools::install_github("gaospecial/ggVennDiagram")
library("ggVennDiagram")
library("ggVennDiagram")
set.seed(20190708)
genes <- paste("gene",1:1000,sep="")
x <- list(
A = sample(genes,300),
B = sample(genes,525),
C = sample(genes,440),
D = sample(genes,350)
)
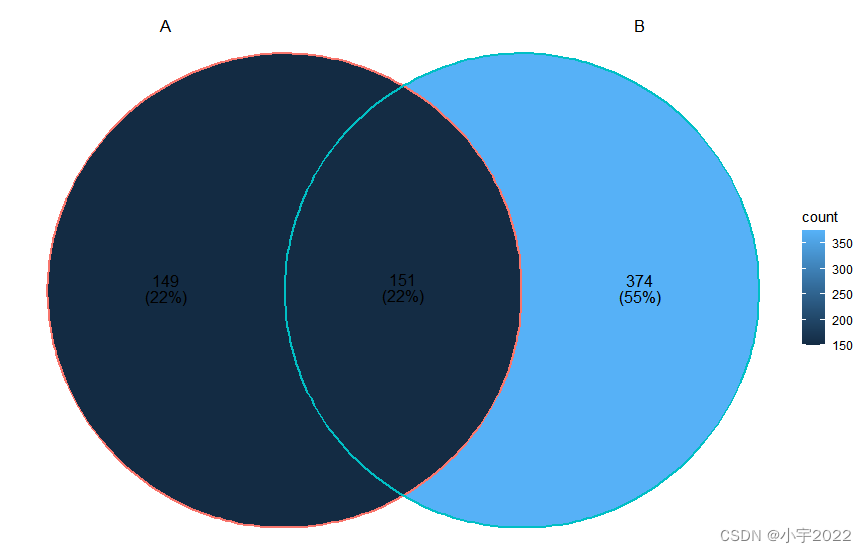
ggVennDiagram(x[1:2], label_alpha = 0)
if (!require(devtools)) install.packages("devtools")
devtools::install_github("yanlinlin82/ggvenn")
library("ggvenn")
library("ggvenn")
set.seed(20190708)
genes <- paste("gene",1:1000,sep="")
x <- list(
  A = sample(genes,300),
  B = sample(genes,525),
  C = sample(genes,440),
  D = sample(genes,350)
)
# Default plot
ggvenn(x)
if (!require(devtools)) install.packages("devtools")
devtools::install_github("yanlinlin82/ggvenn")
library("ggvenn")
library("ggvenn")
set.seed(20190708)
genes <- paste("gene",1:1000,sep="")
x <- list(
A = sample(genes,300),
B = sample(genes,525),
C = sample(genes,440),
D = sample(genes,350)
)
# Change category names
# Change the fill color
names(x) <- c("Stage 1","Stage 2","Stage 3", "Stage4")
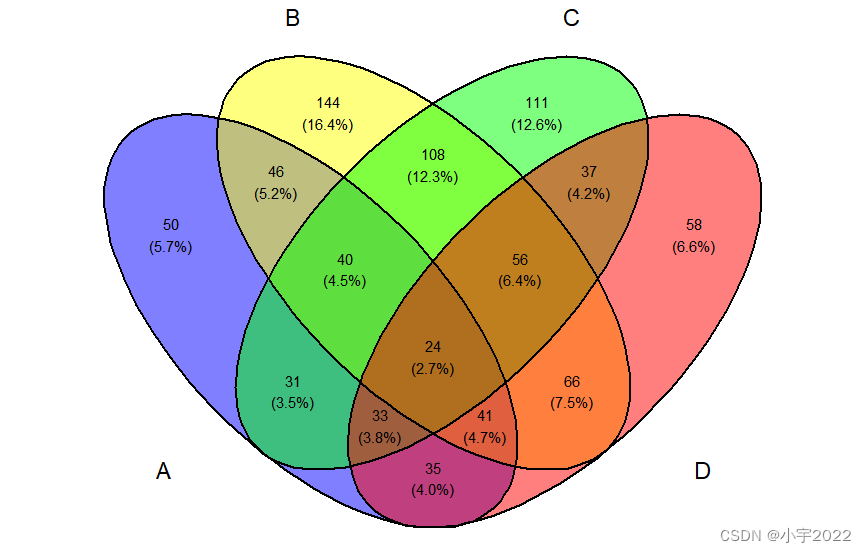
ggvenn(
x,
fill_color = c("#0073C2FF", "#EFC000FF", "#868686FF", "#CD534CFF"),
stroke_size = 0.5, set_name_size = 4
)
if (!require(devtools)) install.packages("devtools")
devtools::install_github("yanlinlin82/ggvenn")
library("ggvenn")
library("ggvenn")
set.seed(20190708)
genes <- paste("gene",1:1000,sep="")
x <- list(
  A = sample(genes,300),
  B = sample(genes,525),
  C = sample(genes,440),
  D = sample(genes,350)
)
ggvenn(
  x, columns = c("Stage 1", "Stage 2", "Stage 3"),
  stroke_size = 0.5
)

if (!require(devtools)) install.packages("devtools")
devtools::install_github("yanlinlin82/ggvenn")
library("ggvenn")
library("ggvenn")
set.seed(20190708)
genes <- paste("gene",1:1000,sep="")
x <- list(
A = sample(genes,300),
B = sample(genes,525),
C = sample(genes,440),
D = sample(genes,350)
)
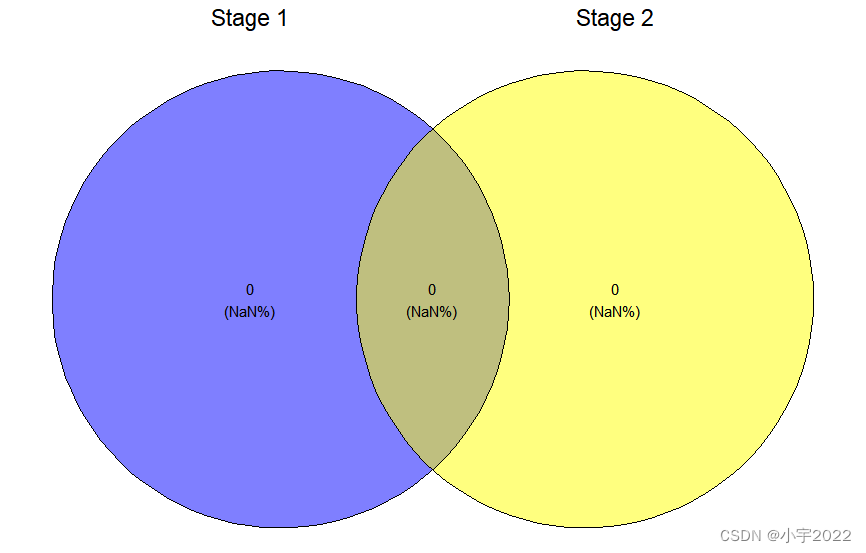
ggvenn(
x, columns = c("Stage 1", "Stage 2"),
stroke_size = 0.5
)
边栏推荐
- A white hole formed by antineutrons produced by particle accelerators
- 在连接mysql数据库的时候一直报错
- Amazon cloud technology community builder application window opens
- C#基于当前时间,获取唯一识别号(ID)的方法
- Redis exceeds the maximum memory error oom command not allowed when used memory & gt; ' maxmemory'
- RPA进阶(二)Uipath应用实践
- Liftover for genome coordinate conversion
- 程序员成长第六篇:如何选择公司?
- 揭露数据不一致的利器 —— 实时核对系统
- 可昇級合約的原理-DelegateCall
猜你喜欢
PLC-Recorder快速监控多个PLC位的技巧

6. Introduce you to LED soft film screen. LED soft film screen size | price | installation | application
预言机链上链下调研

RPA进阶(二)Uipath应用实践
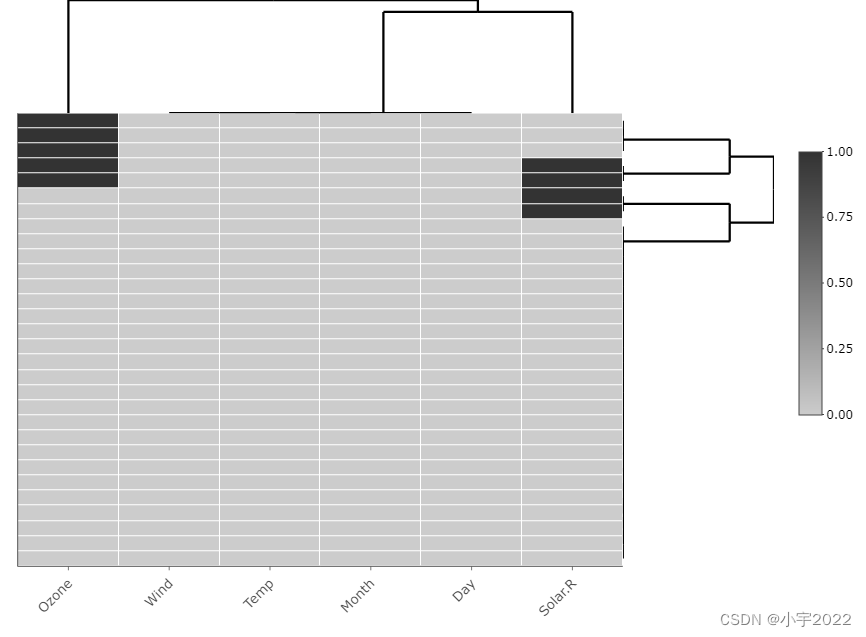
How to Visualize Missing Data in R using a Heatmap
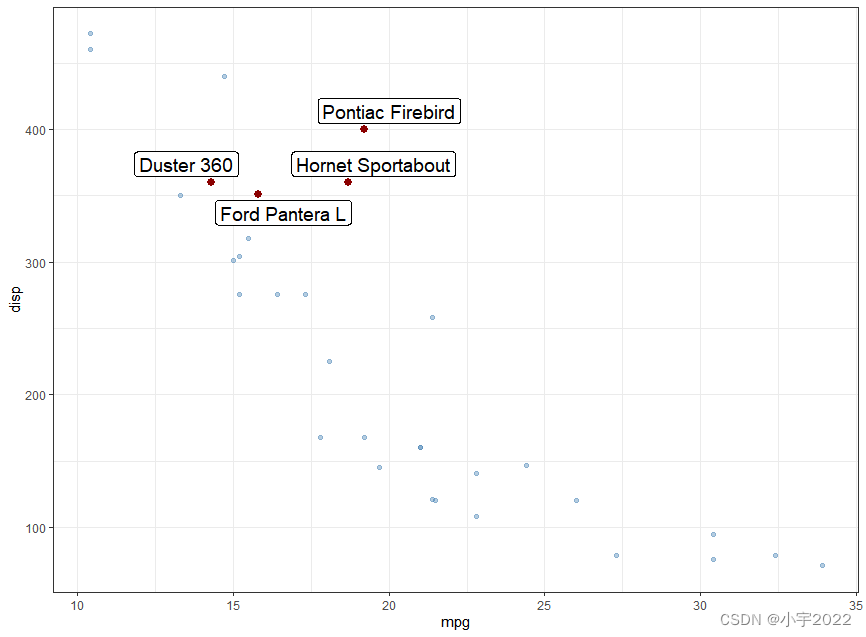
GGHIGHLIGHT: EASY WAY TO HIGHLIGHT A GGPLOT IN R

R HISTOGRAM EXAMPLE QUICK REFERENCE
6方面带你认识LED软膜屏 LED软膜屏尺寸|价格|安装|应用
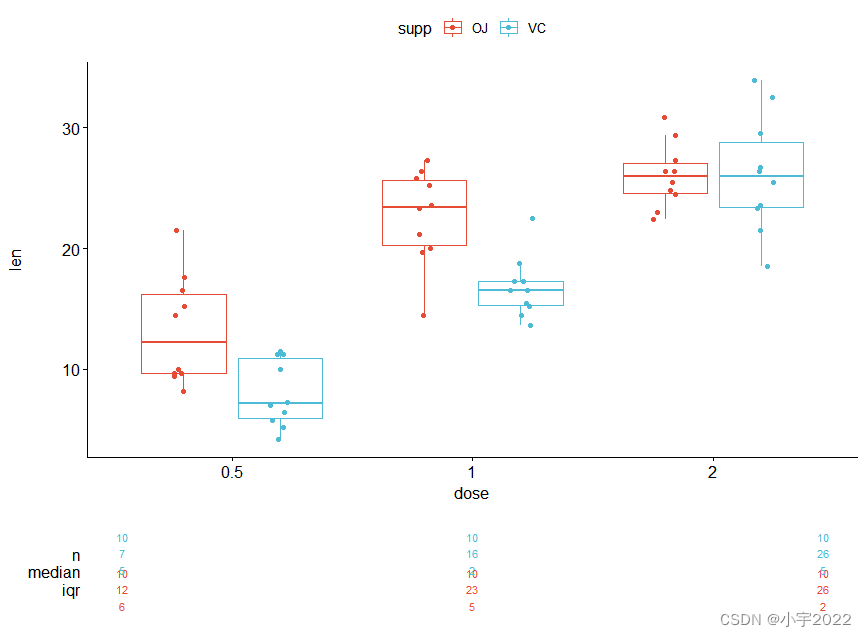
How to Create a Nice Box and Whisker Plot in R

pgsql 字符串转数组关联其他表,匹配 拼接后原顺序展示
随机推荐
How to Visualize Missing Data in R using a Heatmap
to_ Bytes and from_ Bytes simple example
deepTools对ChIP-seq数据可视化
Native method merge word
SSRF
ROS lacks xacro package
Precautions for scalable contract solution based on openzeppelin
How to Easily Create Barplots with Error Bars in R
[visual studio 2019] create MFC desktop program (install MFC development components | create MFC application | edit MFC application window | add click event for button | Modify button text | open appl
pgsql 字符串转数组关联其他表,匹配 拼接后原顺序展示
GGPlot Examples Best Reference
Attribute acquisition method and operation notes of C # multidimensional array
Resources reads 2D texture and converts it to PNG format
程序员成长第六篇:如何选择公司?
Fabric.js 3个api设置画布宽高
CMake交叉编译
PHP query distance according to longitude and latitude
Data analysis - Matplotlib sample code
2022年4月17日五心红娘团队收获双份喜报
可昇級合約的原理-DelegateCall