当前位置:网站首页>【Machine Learning】1 Univariate Linear Regression
【Machine Learning】1 Univariate Linear Regression
2022-08-05 06:08:00 【cabbage itself】
ex1data1数据集如下
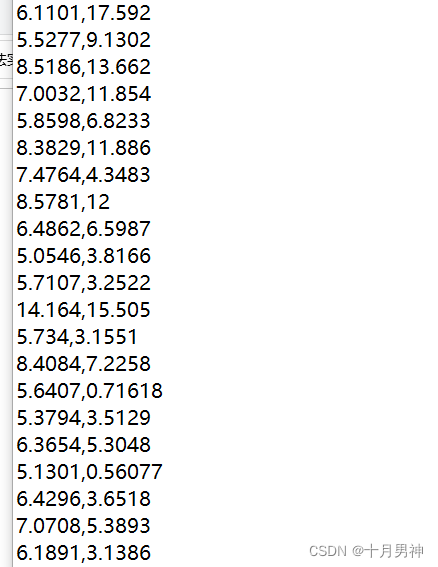
The previous column represents the population,The latter column represents profit so the variable is only population,A linear fit is now performed on this dataset,and display it graphically
具体python代码展示如下:
1,The first is the reference of the library function and the drawing of the original data

用到了numpy库,pandas库,matplotlib库中的pyplot模块(写在程序开头)
path指明文件名,The filename is written as a string(It should be noted that if it is written like this, it should bepyThe file should and the datasettxt文件在同一目录下)
pandas读取CSV文件方法:pd.read_csv(path,header=None,names=['population','profit'])
参数path上文已说明,参数header表示names=['population','profit']所插入的位置(Defaults to row insertion),header=NoneIndicates inserting the first row,And name the first column of data aspopulation,第二列为profit,Read in data and assign it to a variabledata,可知data是dataframe类型
data.head()The first five rows of data are observed by default,Numbers can be specified in parentheses(需加print进行打印)
data.plot(kind='scatter',x='population',y='profit',figsize=(8,5))#dataframeType data to draw,scatter表示绘制散点图,figsize表示画布大小
2,定义代价函数
def computecost(X,Y,theta):
    inner=np.power(((X*theta.T)-Y),2)
return np.sum(inner)/(2*len(X))np.power()对数组的power of each elementnp.sum()对数组所有元素求和//len(X)表示XThe number of rows of data is the number of samples
注意X与theta相乘的顺序
3,数据初始化
data.insert(0,'ones',1)  #插入常数项1,and name a column as ones
colums=data.shape[1]     #The number of columns for statistics
X=data.iloc[:,-1]         #Assign to the data index respectivelyX,y
y=data.iloc[:,colums-1:colums]
X=np.matrix(X.values)     #Because of the subsequent matrix multiplication,故对X,ydigital matrix
y=np.matrix(y.values)
theta=np.matrix(np.array([0,0]))  #Set the parameter one constant term and one variable term
dataframe类型的插入:df.insert(0,'ones',1) Insert columns by default,在位置0Insert a column before1and the column name is ones
dataframe类型索引:df.iloc[,]Lines are indicated before commas,逗号后表示列
注意变量y的赋值:data.iloc[:,colums-1:colums]If you don't write it like thisyThe dimension will be from (97,1)变为(1,97),不利于数据处理
4,定义梯度下降函数
def gradientdescent(X,Y,theta,alpha,iters):
    temp=np.matrix(np.zeros(theta.shape))
    parameters=int(theta.ravel().shape[1]) #参数

    cost=np.zeros(iters)
    for i in range(iters):
        error=(X*theta.T)-Y
        for j in range(parameters):
            term=np.multiply(error, X[:,j])#Refers to the multiplication of elements
            temp[0,j] = theta[0,j] - ((alpha / len(X)) * np.sum(term))
        theta=temp
        cost[i]=computecost(X, Y, theta)
    return theta,cost
itersIndicates the number of gradient iterations,alpha是学习率,parameters统计参数的个数,costThe array records the cost function value for each iteration,Observe whether the algorithm is working properly
注意X与theta相乘的顺序
np.zeros() Generate one-dimensional elements as 0的数组
np.ravel() It is used to reduce the array to one-dimensional, that is, one-dimensional arrangement
np.multiply(a,b) a,bMultiply the elements corresponding to the positions of the arrays
temp[0,j]表示temp矩阵中第0行第j列的位置
5,Function calls and predictions
alpha=0.01  #设置学习率
iters=1500  #设置迭代次数
g,cost=gradientdescent(X, Y, theta, alpha, iters)
#Below are the predicted numbers35000,70000的利润
predict1 = [1,3.5]*g.T
print("predict1:",predict1)
predict2 = [1,7]*g.T
print("predict2:",predict2)
6,Drawing of the fitted curve
#The first method to draw a fitted curve
m=np.linspace(data.Population.min(),data.Population.max(),100) #添加数据
n=g[0,0]+g[0,1]*m     #numpyThe broadcast mechanism of an array multiplies all elements by the same number,都加一个数
#The old way of drawing in the video works too
#绘制预测图
fig, ax = plt.subplots(figsize=(12,8)) #Together define a coordinate for drawing on the same graph
ax.plot(m,n , 'r', label='Prediction')
ax.scatter(data.Population, data.Profit, label='Traning Data')
ax.legend(loc=2)    #添加图例
ax.set_xlabel('Population')  #x轴标签
ax.set_ylabel('Profit')      #y轴标签
ax.set_title('Predicted Profit vs. Population Size')  #表格标题
plt.show()
#The second method of drawing graphics,Set the image size first and then draw step by step
fig=plt.figure(figsize=(12,8),dpi=80)
plt.plot(x,f,"r",label='prediction')
plt.scatter(data.Population,data.Profit,label='traing data')
plt.legend()#添加图例
plt.xlabel("population")
plt.ylabel('profit')
plt.show()g[0,0] 与g[0,1]Represents constant term parameters and variable parameters
n=g[0,0] +g[0,1]*m运用numpy数组的广播机制,Multiplication and addition are done for each element
np.linspace(start,stop,num)从start到stop中选取numnumbers form an array
总结:
1,主要是对numpy数组和dataframeTypes are poorly understood,无法灵活运用
2,I don't know about the methods in the library functions,makes programming difficult
3,cost,gradientWrite the definition of the function
4,Note in the formulaX与theta相乘的顺序
边栏推荐
猜你喜欢


随机推荐
栈的应用——力扣 20.有效的括号
每日一题-正则表达式匹配-0715
spark源码-任务提交流程之-7-流程梳理总结
每日一题-电话号码的字母组合-0717
入门文档09 独立的watch
如何使用Houdini进行程序化优化?
spark算子-textFile算子
D39_向量
每日一题-有效的括号-0719
电子产品量产工具(3)- 文字系统实现
海外服务器的优势
入门文档01 series按顺序执行
【UiPath2022+C#】UiPath Switch
ROS视频教程
每日一题-括号生成-0721
unity实现第一人称漫游(保姆级教程)
每日一题-删除链表的倒数第 N 个结点-0718
游戏引擎除了开发游戏还能做什么?
入门文档08 条件插件
2020年手机上最好的25种免费游戏