当前位置:网站首页>Interview disassembly: how to check the soaring usage of CPU after the system goes online?
Interview disassembly: how to check the soaring usage of CPU after the system goes online?
2022-07-04 13:54:00 【Misty jam】
Hello everyone , I am ethereal .
Last time the interviewer asked a question : After the application goes online Cpu How to check the soaring usage ?
In fact, this is a very common problem , It's very simple , In that case, why should I write ? Because last time I answered, I forgot to thread PID convert to 16 Hexadecimal command .
So I decided to review this question again , Of course, I also prepared the test code for you , You can actually operate it , So I won't forget next time .
Simulate a high CPU scene
public class HighCpuTest {
    public static void main(String[] args) {
        List<HignCpu> cpus = new ArrayList<>();

        Thread highCpuThread = new Thread(()->{
            int i = 0;
            while (true){
                HignCpu cpu = new HignCpu("Java Rizhilu ",i);

                cpus.add(cpu);
                System.out.println("high cpu size:" + cpus.size());
                i ++;
            }
        });
        highCpuThread.setName("HignCpu");
        highCpuThread.start();
    }
}
stay main Method opens a thread , Infinite build HighCpu object .
@Data
@AllArgsConstructor
public class HignCpu {
    private String name;
    private int age;
}
Prepare the above code , function HighCpuTest, Then you can start some column operations to find the cause of the problem .
Troubleshooting steps
First step , Use top Find occupancy CPU The highest Java process
1.  monitor cpu Running state , Displays a list of process running information
top -c

2.  Press CPU Usage sort , Type in uppercase P
P
The second step , use top -Hp Command view occupancy CPU The highest thread
The last step is to use top The order found that Java process . There are so many threads in that process , It is impossible that all threads are occupied all the time CPU Don't put , This step is to find out the culprit , Of course, there may be more than one .
perform top -Hp pid command ,pid It's the one in front Java process , In my case 16738 , The complete order is :
top -Hp 16738, Then type. P ( Capitalization p), According to the thread CPU Usage sort
The effect after execution is as follows
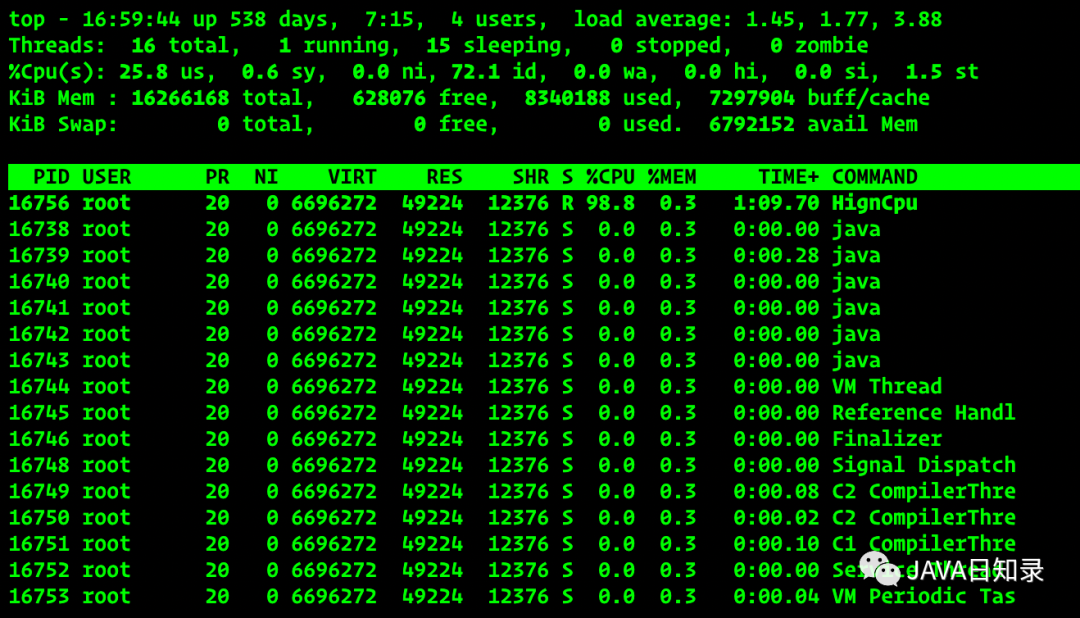
It's found that CPU The highest thread PID by 16756
The third step , View stack information , Locate the corresponding code
adopt printf The command converts it into 16 Base number , The reason why it needs to be transformed into 16 Base number , Because in the stack , Threads id Yes, it is 16 In base notation .( I just forgot this order ~)
[[email protected] ~]# printf "%x\n" 16756
4174
obtain 16 Base thread ID by 4174.
adopt jstack Command to view stack information
jstack 16738 | grep '0x4174' -C10 --color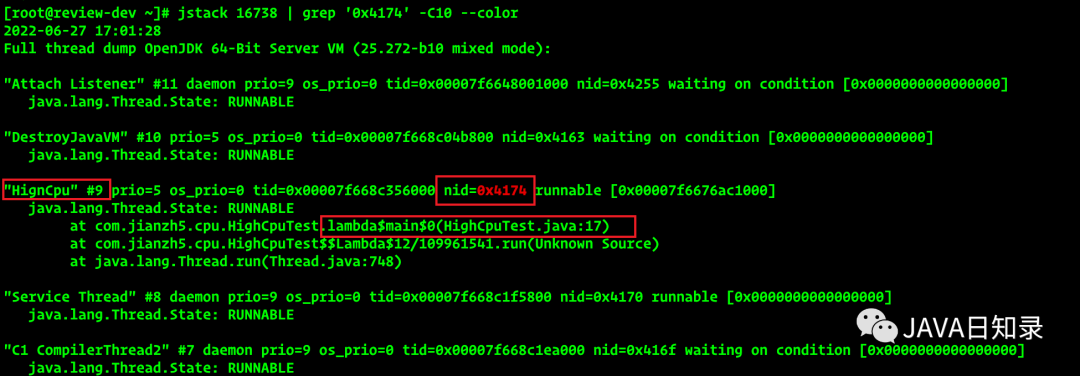
Pictured above , Find the consumption CPU The thread name corresponding to the high thread “HighCpu”, And see the stack where the thread is executing the code .
Last , According to the information in the stack , Locate the corresponding dead loop code , Get it done .
Summary
cpu How to check after the usage rate soars This question is not only often asked in interviews , And it is also very useful in practical work , You'd better practice according to the above steps , Only in this way can we remember well .
This article from the Knowledge planet interview disassembly series , Welcome to play together ~

边栏推荐
- Iptables foundation and Samba configuration examples
- WPF double slider control and forced capture of mouse event focus
- Don't turn down, three sentences to clarify the origin of cross domain resource request errors
- C语言职工管理系统
- 程序员转方向
- 光环效应——谁说头上有光的就算英雄
- Database lock table? Don't panic, this article teaches you how to solve it
- Alibaba cloud award winning experience: build a highly available system with polardb-x
- Go 语言入门很简单:Go 实现凯撒密码
- DGraph: 大规模动态图数据集
猜你喜欢
SCM polling program framework based on linked list management
HAProxy高可用解决方案
基于STM32+华为云IOT设计的酒驾监控系统
7 月数据库排行榜:MongoDB 和 Oracle 分数下降最多
Three schemes to improve the efficiency of MySQL deep paging query

Source code compilation and installation of MySQL

面试官:Redis中哈希数据类型的内部实现方式是什么?
Redis - how to install redis and configuration (how to quickly install redis on ubuntu18.04 and centos7.6 Linux systems)

数据库公共字段自动填充

CA: efficient coordinate attention mechanism for mobile terminals | CVPR 2021
随机推荐
C语言程序设计选题参考
OPPO Find N2产品形态首曝:补齐各项短板
Getting started with the go language is simple: go implements the Caesar password
XML入门一
如何在 2022 年为 Web 应用程序选择技术堆栈
Solution: how to delete the information of Jack in two tables with delete in one statement in Oracle
2022G3锅炉水处理考试题模拟考试题库及模拟考试
Reading cognitive Awakening
舔狗舔到最后一无所有(状态机)
CA: efficient coordinate attention mechanism for mobile terminals | CVPR 2021
CTF competition problem solution STM32 reverse introduction
[cloud native | kubernetes] in depth understanding of ingress (12)
JVM series - stack and heap, method area day1-2
源码编译安装MySQL
CANN算子:利用迭代器高效实现Tensor数据切割分块处理
Database lock table? Don't panic, this article teaches you how to solve it
ASP.NET Core入门一
"Pre training weekly" issue 52: shielding visual pre training and goal-oriented dialogue
安装trinity、解决报错
C语言程序设计
