当前位置:网站首页>Example explanation: move graph explorer to jupyterlab
Example explanation: move graph explorer to jupyterlab
2022-07-02 00:07:00 【Huawei cloud developer Alliance】
Abstract : be based on Graph Explorer stay Jupyter Explore the map on , It can greatly reduce the coding cost , Enrich JupyterLab Data expressiveness .
This article is shared from Huawei cloud community 《 take Graph Explorer Move on JupyterLab: Use GES4Jupyter Connect GES And explore the map 》, author : Mayfly and sea .
GES4Jupyter It can be used in JupyterLab Connect to access GES And visual tools . Part of the tool is encapsulated GES Business interface , And provide visualization of the returned data . Based on the tool in Jupyter Explore the map on , It can greatly reduce the coding cost , Enrich JupyterLab Data expressiveness .

One 、 Prepare before use
1. Huawei cloud account
You need to register a Huawei cloud account before using Huawei cloud services . Through this account , Just pay for the services you use , You can use all Huawei cloud services .
To register a Huawei cloud account, click :《 Introduction to Huawei cloud registration 》
After successful registration, you can automatically log in to Huawei cloud , You need to complete “ Real name authentication ” The service can be used normally .
2. OBS Object storage service
OBS Object storage service (Object Storage Service),GES take OBS Import data as a data source .
If you want to import data into the graph engine service GES, You need to upload to OBS. Details refer to : Huawei cloud engine service GES actual combat —— Map creation
3. GES Figure Engine Services
Use GES4Jupyter front , Need to be in Figure engine service console Create a GES Figure example , And import data . The data source used in this example is New crown patient trajectory traceability dataset v2, It can be downloaded from AI Gallery Download . Details refer to : Huawei graphics engine documentation - Quick start and Huawei cloud engine service GES actual combat —— Map creation
4. Get call GES Business API Required parameters
call GES API Need to enter token Authentication information , The authentication capability relies on the Huawei cloud unified identity authentication service IAM. obtain Token User name and password required 、 Information such as the area where the map is located . View details : Huawei graphics engine documentation - Business API Authentication and call GES Service business API Acquisition of relevant parameters
Two 、 Use GES4Jupyter Connect GES service
Enter from the Huawei cloud homepage ModelArts Console , Click on CodeLab Create a new one Jupyter Notebook, And wait for resource initialization .

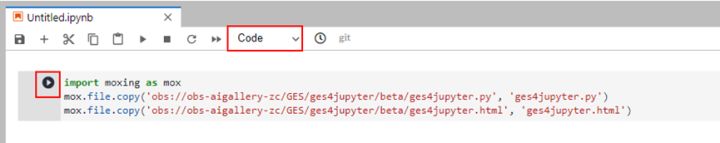
Create a new one Notebook, Use the following code to get GES4Jupyter Program and resource files .
import moxing as moxmox.file.copy('obs://obs-aigallery-zc/GES/ges4jupyter/beta/ges4jupyter.py', 'ges4jupyter.py')mox.file.copy('obs://obs-aigallery-zc/GES/ges4jupyter/beta/ges4jupyter.html', 'ges4jupyter.html')stay Notebook After entering the code in , Configure this text as code , Then click the run button on the left , And wait for the run to complete .
Click on the top left “+” No. new code snippet , Enter the following code snippet and run , complete GES4Jupyter The initialization .
from ges4jupyter import GESConfig, GES4Jupyter, read_csv_configeip = ''project_id = ''graph_name = ''iam_url = ''user_name = ''password = ''domain_name = ''project_name = ''port = 80eip, project_id, graph_name, iam_url, user_name, password, domain_name, project_name, port = read_csv_config('cn_north_4_graph.csv')config = GESConfig(eip, project_id, graph_name, iam_url = iam_url, user_name = user_name, password = password, domain_name = domain_name, project_name = project_name, port = port)ges_util = GES4Jupyter(config, True);The meanings of the fields involved in the above code are basically divided into two categories , A brief introduction :
- Is used to construct API Parameters of :eip,projectId,graph_name, port These four parameters are involved in the construction of the business face request url.eip And graph_name The two parameters are easy to obtain in drawing creation ,port The parameter defaults to 80, When safe mode is turned on, it is 443, About projectId, Refer to the official website of the graph engine - Get the project id, Get items from the graph console according to the region to which the graph belongs id.
- Used when requesting API Pre acquisition token Parameters of :iam_url, user_name, password, domain_name,project_name,GES4Jupyter These four parameters will be used to get token, And then in use api To authenticate , For relevant parameters, please refer to : Huawei graphics engine documentation - Business API Authentication and call GES Service business API Acquisition of relevant parameters
In addition to manually entering these parameters , You can also construct a parameter as csv Upload the file to CodeLab platform , Then execute the diagram read_csv_config Method , One click access to all parameters .

As shown in the figure, it is an example file of a figure with Beijing IV area , The key information ( Such as ip、projectId、 Title 、 Account name 、 password 、iam Sub account name ) Hidden by mosaics .
For the newly created graph , Use the following code snippet to create a point edge index , Easy to use cypher:
print(' Start creating point index :')job_id = ges_util.build_vertex_index()job_result = ges_util.get_job(job_id)if 'errorCode' not in job_result: for i in range(100): if job_result['status'] == 'success': break else: time.sleep(1) job_result = ges_util.get_job(job_id)print(' Point index creation completed ')print(' Start creating edge index :')job_id = ges_util.build_edge_index()job_result = ges_util.get_job(job_id)if 'errorCode' not in job_result: for i in range(100): if job_result['status'] == 'success': break else: time.sleep(1) job_result = ges_util.get_job(job_id)print(' Edge index creation completed ')If it's bigger , And not based on label The demands of filtering , You can also turn off cypher Index switch of .
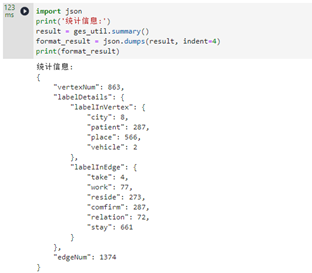
ges_util.cypher_query("call dbms.parameter('needNodeIndex', false)");ges_util.cypher_query("call dbms.parameter('needEdgeIndex', false)");perform summary Method to see the point edge distribution :
3、 ... and 、 Use GES4Jupyter Call the business interface and visualize it
GES4Jupyter Support calling cypher sentence , And visualize cypher Result . After initialization is complete GES4Jupyter after , Use the following code to execute and visualize cypher Inquire about :
cypher_result = ges_util.cypher_query("match (n)-[r]->(m) return n,r,m limit 10",formats=['row','graph']);ges_util.format_cypher_result(cypher_result)stay Notebook Enter this code in , Click on the run , You can see Notebook Medium effect :

meanwhile , The tool also provides additional tabs , Not only can you see the visualization Graph structure , You can also see the table data 、 And the original json data .

GES4Jupyter It also provides the ability to gremlin The point and edge data returned by the language are visualized .
gremlin_result = ges_util.gremlin_query("g.V().outE().bothV().path().limit(2)");ges_util.format_gremlin_result(gremlin_result)
meanwhile , about ges Of path-query Interface , When the returned data is tree When the format ,GES4Jupyter Can also provide better support .
result = ges_util.path_query({ "repeat": [ { "operator": "bothV", "vertex_filter": { "property_filter": { "leftvalue": { "id": "" }, "predicate": "NOTIN", "rightvalue": { "value": [" Beijing "] } } } } ], "until": [ { "vertex_filter": { "property_filter": { "leftvalue": { "id": "" }, "predicate": "=", "rightvalue": { "value": [" mesozoic-cenozoic "] } } } } ], "times": 5, "queryType": "Tree", "vertices": [" Beijing case 2"] })ges_util.format_path_query(result)
Four 、 There are more cases available on the official website of the graph engine GES4Jupyter Hands on experience
The data set of this article is taken from the official website of Huawei cloud image engine “ Trace of new crown patients ” Data sets ,notebook The code is taken from “ Trace of new crown patients ” Case study , stay Figure engine official website On , There are other hands-on practices , Matching ModelArts Of CodeLab, Can achieve “ Open the box ”, Provide a wealth of scenes to get to know the map with you 、 Understanding diagram 、 Use the figure .

Reference items :https://github.com/merqurio/neo4jupyter
Click to follow , The first time to learn about Huawei's new cloud technology ~
边栏推荐
- 启牛学院开户安全的吗?开户怎么开?
- SQL Server Installation Guide
- Digital transformation has a long way to go, so how to take the key first step
- How to realize parallel replication in MySQL replication
- 2021 robocom world robot developer competition - preliminary competition of undergraduate group
- USB-IF协会与各种接口的由来
- Various global files related to [.Net core] program
- It's nothing to be utilitarian!
- 在证券账户上买基金安全吗?哪里可以买基金
- 13 MySQL constraint
猜你喜欢

关联性——组内相关系数
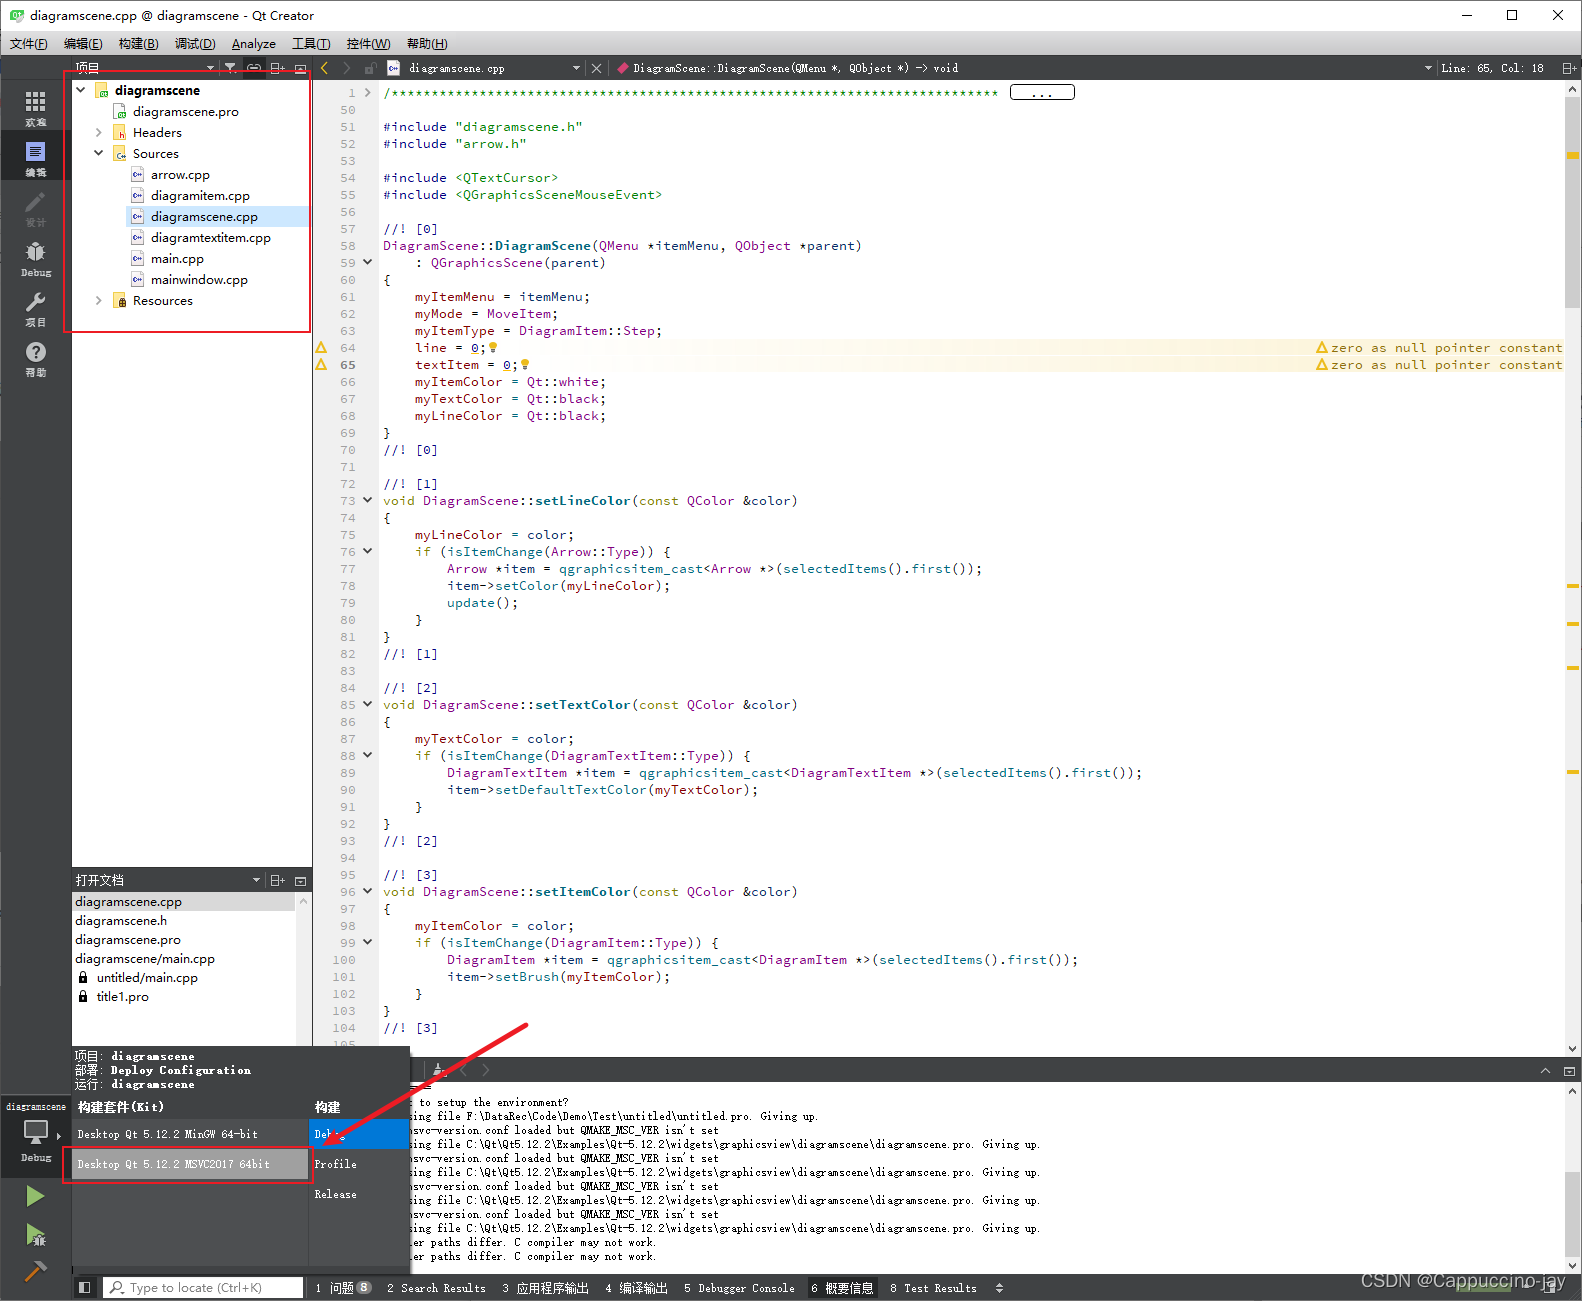
【QT】對於Qt MSVC 2017無法編譯的問題解决
Correlation - intra group correlation coefficient
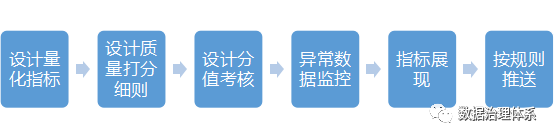
如何提升数据质量

Selectively inhibiting learning bias for active sampling
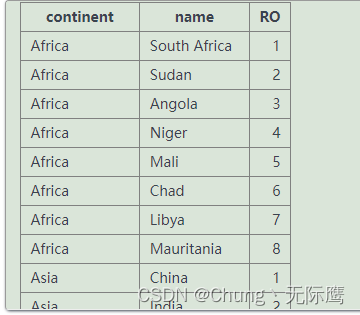
SQL数据分析之窗口排序函数rank、dense_rank、raw_number与lag、lead窗口偏移函数【用法整理】

kubernetes资源对象介绍及常用命令(三)
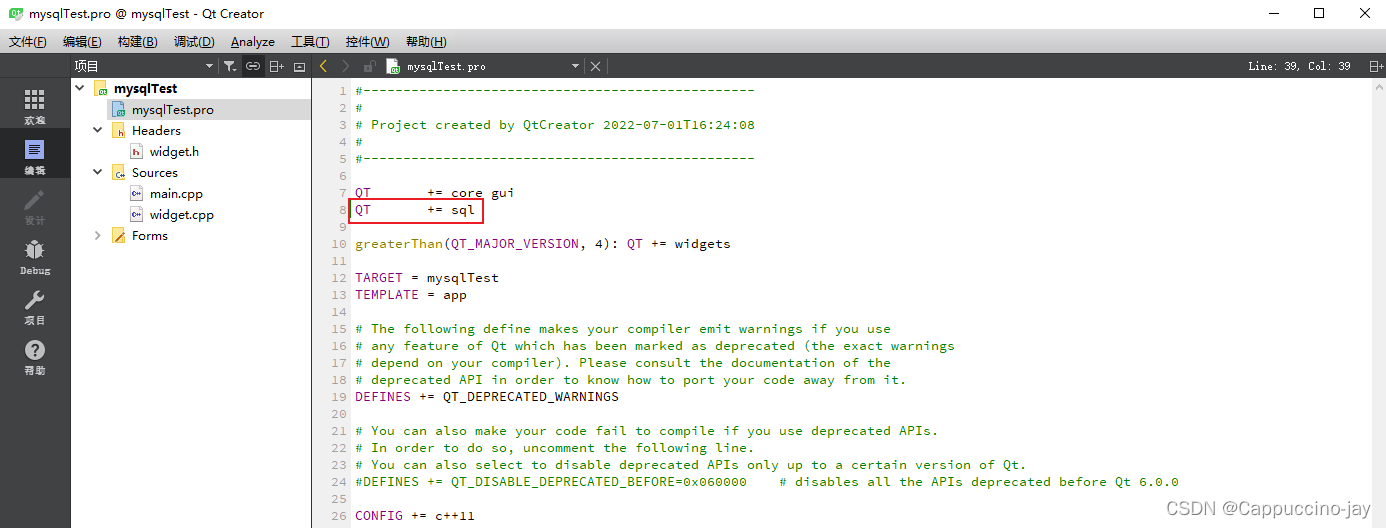
【QT】测试Qt是否能连接上数据库

Relatively easy to understand PID understanding
LeetCode中等题题分享(5)
随机推荐
13 MySQL constraint
Why does blocprovider feel similar to provider?
RPA tutorial 01: Excel automation from introduction to practice
Key points of security agreement
Selectively inhibiting learning bias for active sampling
启牛学院开户安全的吗?开户怎么开?
LDR6035智能蓝牙音响可充可放(5.9.12.15.20V)快充快放设备充电
How to realize parallel replication in MySQL replication
How excel opens CSV files with more than one million lines
Difficult to get up syndrome (bit by bit greed)
Jielizhi, production line assembly link [chapter]
MySQL: the difference between insert ignore, insert and replace
求逆序数的三个方法
Linux centos7 installation Oracle11g super perfect novice tutorial
TS initial use, TS type
SQL数据分析之子查询的综合用法和案例题【耐心整理】
Vue force cleaning browser cache
Asp . Text of automatic reply to NETCORE wechat subscription number
Shell custom function
Overview of edge calculation