当前位置:网站首页>【学习笔记】阶段测试1
【学习笔记】阶段测试1
2022-07-05 14:10:00 【仰望星空的蚂蚁】
Menci 的序列
二进制 + 构造 + 贪心
第一眼是 dp 。想了 1.5h ,想不出来状态。
我会乱搞 !乱搞 80pts 。
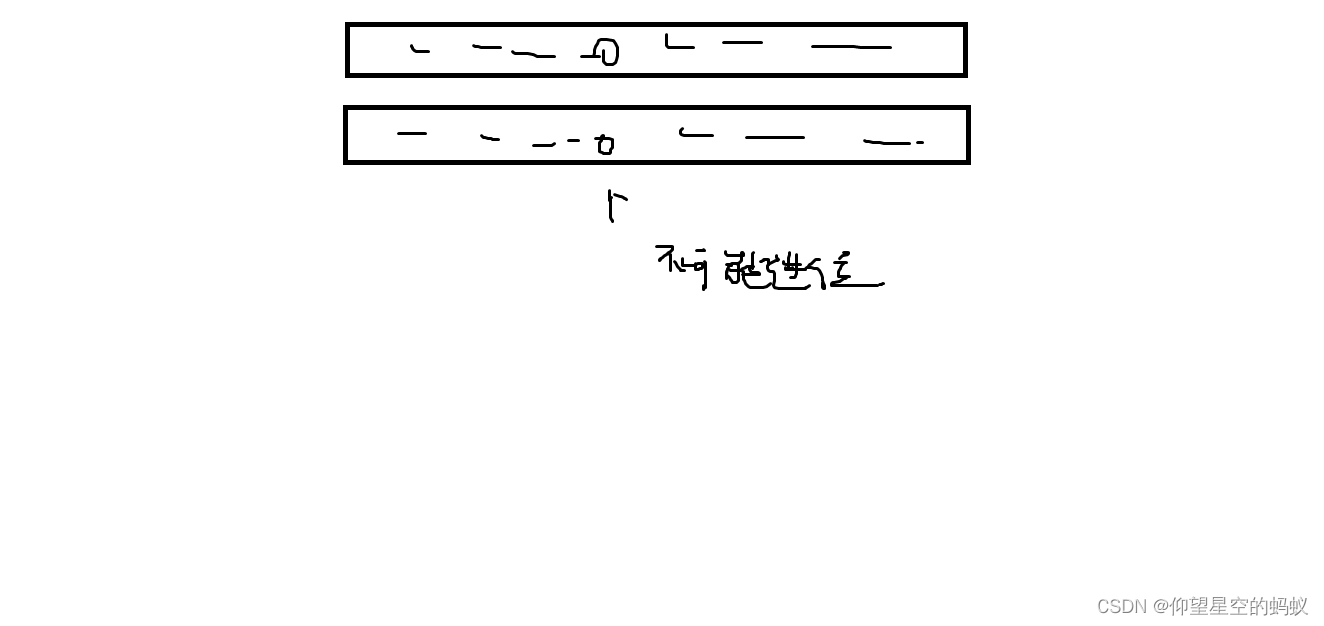
首先把原序列改造一下。注意到 1000=010
这样构造后连续的 + 不超过 2 个
然后我们从高往低位贪心 。
显然是要用最少的 + 来构造。
因此最高位尽量不进位 。
不难想到贪心方案:从左往右遍历连续的 + 段,对于每一段连续的 + 只取一个,每一段连续的 * 也只取一个,这样前缀一定是 1111…
如果遇到后缀 * 不足的情况,那么这一段 * 的个数一定 >=2 ,足以隔断后面的选择对前面的影响(换句话说不可能进位了),那么我们只需让后面的 + 对答案贡献尽可能大 。
可以用两个二进制数相加来理解 。
你要问这个贪心怎么想到的,我也不知道 ,可能是感觉吧。
排序
膜拜 idsy …
这题第一感暴搜。
当然这题如果只能暴搜就太没意思了。
比如 Limak and Shooting Points 堪称搜索神题 。
其实正解挺显然啊 。
考虑 <=i 的操作都用了,那么对于长度为 2 i − 1 2^{i-1} 2i−1 的块内部顺序已定,毋宁看作一个整体 。
如果每一段都合法,则不执行操作;如果有一段不合法,则交换前后;如果有两段不合法,则分类讨论,最多有 2 2 2 种交换方法 。
这样可能的情况 2 n 2^n 2n 种,总复杂度 O ( 4 n ) O(4^n) O(4n) 。
注意别忘了乘阶乘 。
边栏推荐
- LeetCode_69(x 的平方根 )
- Leetcode array question brushing notes
- LeetCode_ 3 (longest substring without repeated characters)
- POI set the data format of the column (valid)
- R language ggplot2 visual density map: Visual density map by group and custom configuration geom_ The alpha parameter in the density function sets the image transparency (to prevent multiple density c
- The simplest way to open more functions without certificates
- Zhizhen new energy rushes to the scientific innovation board: the annual revenue is 220million, and SAIC venture capital is the shareholder
- 总量分析 核算方法和势方法 - 分摊分析
- The speed monitoring chip based on Bernoulli principle can be used for natural gas pipeline leakage detection
- Login interface code
猜你喜欢
-Web direction attack and defense world
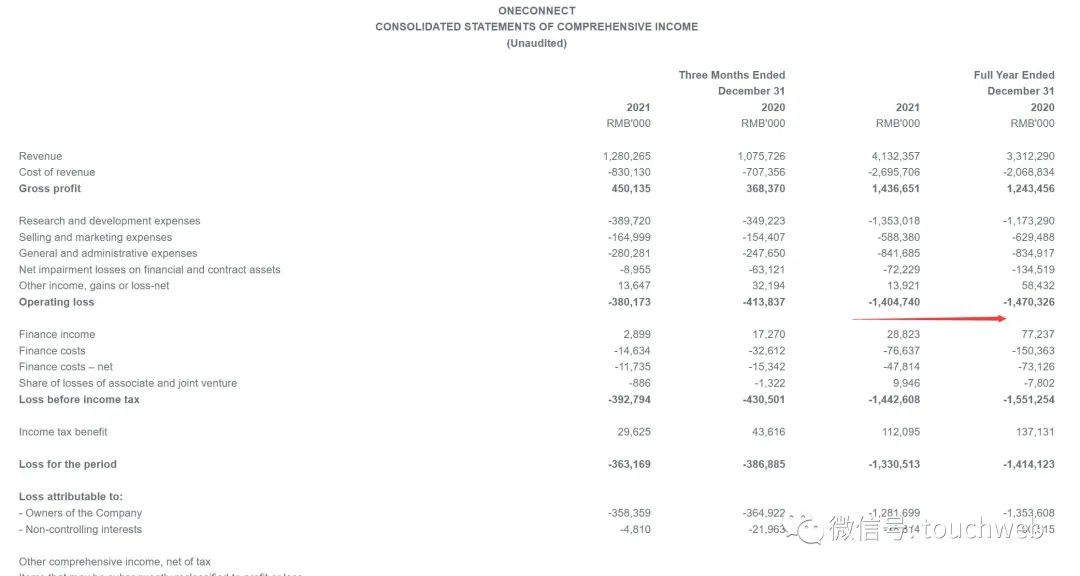
金融壹账通香港上市:市值63亿港元 叶望春称守正笃实,久久为功

What is the future development trend of neural network Internet of things

What are the advantages and characteristics of SAS interface

Qingda KeYue rushes to the science and Innovation Board: the annual revenue is 200million, and it is proposed to raise 750million

Shen Ziyu, nouveau Président de Meizu: M. Huang Zhang, fondateur de Meizu, agira comme conseiller stratégique pour les produits scientifiques et technologiques de Meizu
神经网络物联网未来发展趋势怎么样
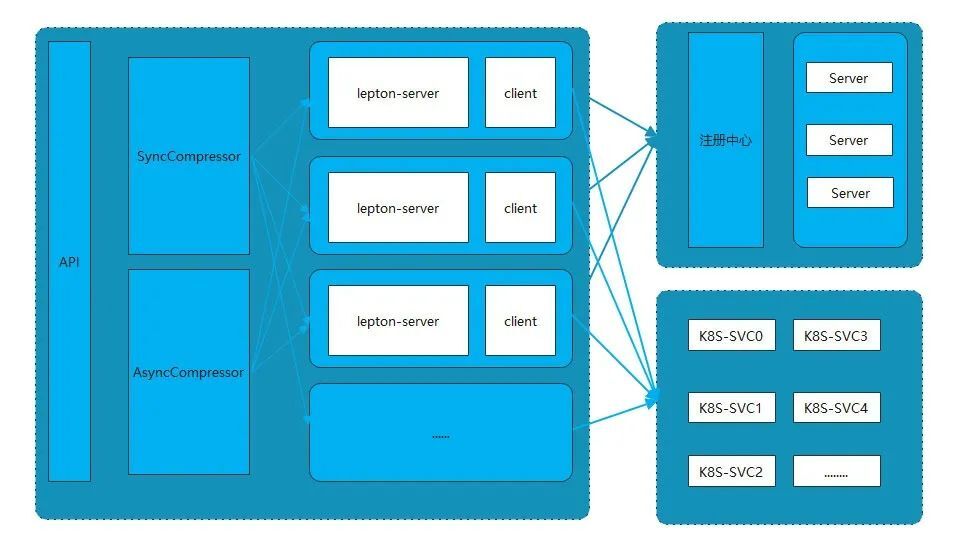
Lepton 无损压缩原理及性能分析
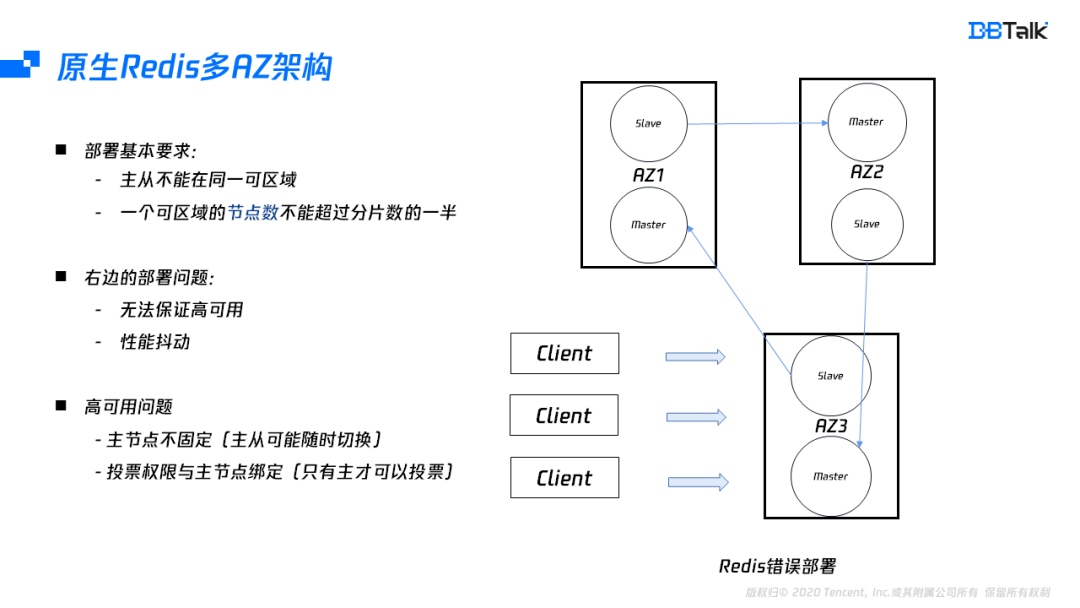
Redis如何实现多可用区?
Tiflash compiler oriented automatic vectorization acceleration
随机推荐
Show strength. In this way, the mobile phone will not be difficult to move forward
R语言ggplot2可视化:gganimate包基于transition_time函数创建动态散点图动画(gif)、使用shadow_mark函数为动画添加静态散点图作为动画背景
动态规划
What is the ranking of GF futures? Is it safe and reliable to open an account for GF futures online?
R Language ggplot2 Visualization: visualize linegraph, using Legend in Theme function. Paramètre de position emplacement de la légende personnalisée
软件测试人在深圳有哪些值得去的互联网公司【软件测试人员专供版】
如何将 DevSecOps 引入企业?
魅族新任董事长沈子瑜:创始人黄章先生将作为魅族科技产品战略顾问
01 、Solr7.3.1 在Win10平台下使用jetty的部署及配置
R language ggplot2 visualization: use ggplot2 to visualize the scatter diagram, and use the labs parameter to customize the X axis label text (customize X axis labels)
Detailed explanation of IP address and preparation of DOS basic commands and batch processing
总量分析 核算方法和势方法 - 分摊分析
Introduction, installation, introduction and detailed introduction to postman!
LeetCode_2(两数相加)
Which Internet companies are worth going to in Shenzhen for software testers [Special Edition for software testers]
The IPO of Ruineng industry was terminated: the annual revenue was 447million and it was planned to raise 376million
Implementation process of WSDL and soap calls under PHP5
How to call the function mode of one hand and one machine
Sorter evolution of ticdc 6.0 principle
分享 12 个最常用的正则表达式,能解决你大部分问题