当前位置:网站首页>Openocd-jtag debugging
Openocd-jtag debugging
2020-11-09 16:56:00 【whoisliang】
Catalog
title: OpenOCD-JTAG debugging
tags: ARM
date: 2018-10-13 23:36:28
---
Todo
- [ ] JTAG debugging linux kernel
- [ ] linux Next use OpenOCD debugging
- [x] win Next use OpenOCD debugging
summary
-
Learning documents Weidong mountain Eclipse,OpenOCD,OpenJTAGv3.1 Embedded development tutorial version 5.pdf
-
Hardware connection : PC>JTAG The debugger >CPU
-
Software control :IDE(KEIL/ADS/)> GDB( Instructions )> OpenOCD( The actual order )> JTAG The debugger > Veneer
- JTAG control CPU function :
- When CPU The address signal of ADDR=xxx, stop it CPU- hardware breakpoint
- When CPU The data signal of DATA=xxx, stop it CPU-- Software breakpoint
- Rerun CPU
- Read R0,.. register
- Control peripherals , Memory
-
What's more
OpenJTAG.exeThis GUI It's actually encapsulatedopenocd.exeCommand line- Set up Workdir To the program code directory
- Click on
telnet, Or directly cmd Inputtelnet 127.0.0.1 4444 - Use help Check out help or check out `Eclipse,OpenOCD,OpenJTAGv3.1 Embedded development tutorial version 5.pdf
The breakpoint
-
hardware breakpoint : A program can only make two breakpoints (ARM7), Can debug ROM,NOR
Set up CPU Inside JTAG The comparator , Make hardware breakpoints Addr=A, When CPU issue A Stop at address
CPU How it works ?CPU You need to take instructions , That is, you need to signal the address to get the instruction ,JTAG This address was detected
-
Software breakpoint , There can be countless software breakpoints . If the address of the breakpoint is writable , So you can't debug NOR, perhaps ROM Procedure on , See the following for details led.c An example of
- Set up CPU Inside JTAG Relatively strong , Make it worth = A special value
- Replace the desired breakpoint location (A) Value = This special value , Make a backup
- When CPU Read this special value , Program breakpoints
- When running again , Restore this (A) Position command
Quick to use
Common commands
-
halt stop it cpu -
reg Check register -
mdw 0 //memory display word Look at the memory -
mww 0 0x12345678 //memory write word -
load_image leds.bin 0 // Download the program to 0 Address , And then you can use mdw Read 0, See if it's programmed bin -
resume 0 // Specify the address to run , If you don't specify an address , It will resume operation -
reset Reset the target board -
reset halt -
-
step 0 // Carry out the first sentence , and halt -
step // Step by step -
-
bp To set breakpoints -
bp 0x6c 4 hw stay 0x6c Set the breakpoint at the address of , hardware breakpoint -
rpb 0x6c Cancel breakpoint
test led The breakpoint of
-
//led.c -
void wait(volatile unsigned long dly) -
{ -
for(; dly > 0; dly--); -
} -
-
int main(void) -
{ -
unsigned long i = 0; -
-
GPFCON = GPF4_out|GPF5_out|GPF6_out; -
-
while(1){ -
wait(30000);------------------- Try breaking points here , You can watch the light change -
GPFDAT = (~(i<<4)); -
if(++i == 8) -
i = 0; -
} -
-
return 0; -
} -
-
-
// Disassembly abstract -
00000044 <main>: -
44: e52de004 str lr, [sp, #-4]! -
48: e24dd004 sub sp, sp, #4 ; 0x4 -
4c: e3a03000 mov r3, #0 ; 0x0 -
50: e58d3000 str r3, [sp] -
54: e3a03456 mov r3, #1442840576 ; 0x56000000 -
58: e2833050 add r3, r3, #80 ; 0x50 -
5c: e3a02c15 mov r2, #5376 ; 0x1500 -
60: e5832000 str r2, [r3] -
64: e3a00c75 mov r0, #29952 ; 0x7500 -
68: e2800030 add r0, r0, #48 ; 0x30 -
6c: ebffffe9 bl 18 <wait>--------------------------- Try breaking points here -
70: e3a02456 mov r2, #1442840576 ; 0x56000000 -
74: e2822054 add r2, r2, #84 ; 0x54 -
78: e59d3000 ldr r3, [sp] -
7c: e1a03203 mov r3, r3, lsl #4 -
80: e1e03003 mvn r3, r3 -
84: e5823000 str r3, [r2] -
88: e59d3000 ldr r3, [sp] -
8c: e2833001 add r3, r3, #1 ; 0x1 -
90: e58d3000 str r3, [sp] -
94: e3530008 cmp r3, #8 ; 0x8 -
98: 1afffff1 bne 64 <main+0x20> -
9c: e3a03000 mov r3, #0 ; 0x0 -
a0: e58d3000 str r3, [sp] -
a4: eaffffee b 64 <main+0x20> -
Disassembly of section .debug_line:
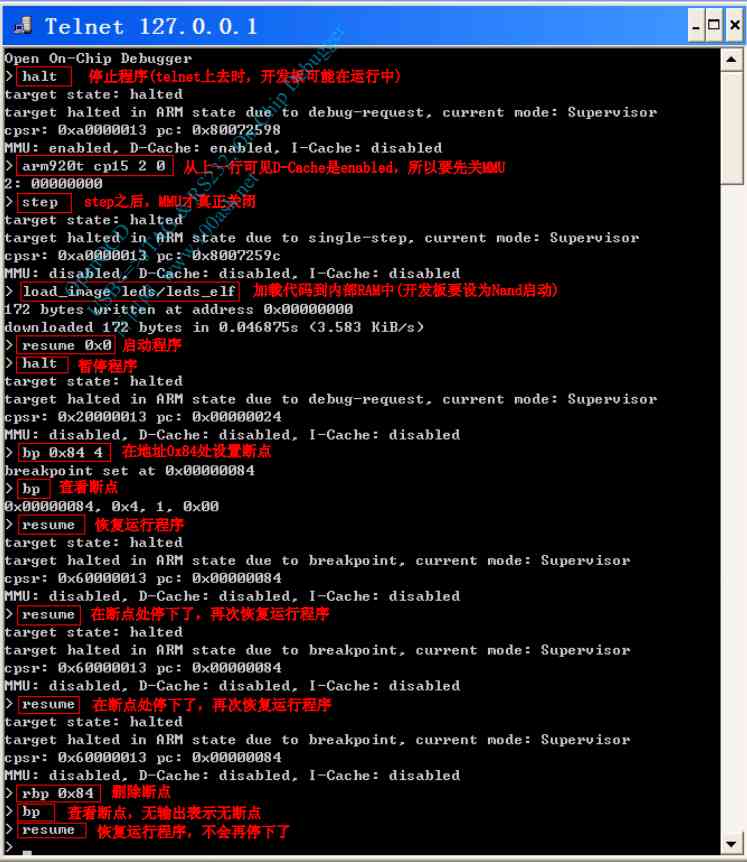
Use openocd Command to debug breakpoints
-
halt -
load_image leds.bin 0 // Download program -
resume 0 // Specify the address to run , If you don't specify an address , It will resume operation -
halt -
bp 0x6c 4 hw // stay 0x6c Set the breakpoint at the address of , hardware breakpoint -
-
resume // Repeat this breakpoint , You can watch the light change
Test whether the software breakpoint changes ram value
-
// Read the original value -
> mdw 0x6c -
0x0000006c: ebffffe9 -
// Set software breakpoints -
> bp 0x6c 4 -
breakpoint set at 0x0000006c -
// Read back to this ram value , The discovery changed -
> mdw 0x6c -
0x0000006c: deeedeee -
// Delete this breakpoint -
> rbp 0x6c -
// Read it back -
> mdw 0x6c -
0x0000006c: ebffffe9
NAND debugging ( Advanced )
Program Overview :
- Link address in
0x30000,0000, It should be running at0x3000,0000 - Burn the program directly into memory , That is, the program runs in 0 Address . Not loading address
- Program function :main Light up the light , But burn directly to the inside ram, Run away
- programmatic bug lie in , All code should be location independent or code handling is required
-
.text -
.global _start -
_start: -
@ function disable_watch_dog, memsetup, init_nand, nand_read_ll stay init.c In the definition of -
ldr sp, =4096 @ Set the stack -
bl disable_watch_dog @ Turn off WATCH DOG -
bl memsetup @ initialization SDRAM -
bl nand_init @ initialization NAND Flash -
-
@ take NAND Flash Middle address 4096 At the beginning 1024 Byte code (main.c Compile to get ) Copied to the SDRAM in -
@nand_read_ll The function needs 3 Parameters : -
ldr r0, =0x30000000 @1. Destination address =0x30000000, This is a SDRAM From -
mov r1, #0 @2. source address = 0 -
mov r2, #4096 @3. Copy length = 2048(bytes), -
bl nand_read @ call C function nand_read -
-
ldr sp, =0x34000000 @ Set the stack -
ldr lr, =halt_loop @ Set return address -
ldr pc, =main @b Instructions and bl Instructions can only jump back and forth 32M The scope of the -
@, So here we use to pc The method of assignment is used to jump -
halt_loop: -
b halt_loop
bug reason :mem_cfg_val It's on the stack , It's location independent , But his initial value is from the link address , That is to say 0x3000000 Back
-
void memsetup() -
{ -
unsigned long const mem_cfg_val[]={ 0x22011110, //BWSCON -
0x00000700, //BANKCON0 -
0x00000700, //BANKCON1 -
0x00000700, //BANKCON2 -
0x00000700, //BANKCON3 -
0x00000700, //BANKCON4 -
0x00000700, //BANKCON5 -
0x00018005, //BANKCON6 -
0x00018005, //BANKCON7 -
0x008C07A3, //REFRESH -
0x000000B1, //BANKSIZE -
0x00000030, //MRSRB6 -
0x00000030, //MRSRB7 -
}; -
-
}
Debugging begins
-
>reset halt -
> load_image nand.bin 0 -
1520 bytes written at address 0x00000000 -
downloaded 1520 bytes in 0.063003s (23.560 KiB/s)
perform First sentence step 0 Which is execution mov sp, #4096 ; 0x1000, have access to reg notice sp=0x1000
step Perform jump , You can find pc=0x38, Corresponding assembly
-
30000000 <_start>: -
30000000: e3a0da01 mov sp, #4096 ; 0x1000 -
30000004: eb00000b bl 30000038 <disable_watch_dog>
And then step by step step, And use poll View the current pc It's worth waiting for , Use mdw View the memory of this setting
Jump to memsetup,pc=0x08, Disassembly is put on the stack first , You can find sp=4096-5*4=4076=0xFEC
have access to step 0, Then set the bp 0x50 4 hw The breakpoint Jump right to where you want to be And then in assembly code , We found a problem
-
// ip=300005bc -
30000050: e1a0400c mov r4, ip -
30000054: e8b4000f ldmia r4!, {r0, r1, r2, r3} -
// from r4 The memory pointed to in the r0~r3 -
-
// That is to say, from 300005bc Read some data , But at this point 300005bc(sdram) It's not initialized and code handling , So there must be something wrong with the data here -
-
// What's here is actually the value of that local array mem_cfg_val -
300005bc <.rodata>: -
300005bc: 22011110 andcs r1, r1, #4 ; 0x4 -
300005c0: 00000700 andeq r0, r0, r0, lsl #14 -
300005c4: 00000700 andeq r0, r0, r0, lsl #14 -
300005c8: 00000700 andeq r0, r0, r0, lsl #14 -
300005cc: 00000700 andeq r0, r0, r0, lsl #14 -
300005d0: 00000700 andeq r0, r0, r0, lsl #14 -
300005d4: 00000700 andeq r0, r0, r0, lsl #14 -
300005d8: 00018005 andeq r8, r1, r5 -
300005dc: 00018005 andeq r8, r1, r5 -
300005e0: 008c07a3 addeq r0, ip, r3, lsr #15 -
300005e4: 000000b1 streqh r0, [r0], -r1 -
300005e8: 00000030 andeq r0, r0, r0, lsr r0 -
300005ec: 00000030 andeq r0, r0, r0, lsr r0 -
Disassembly of section .comment:
OpenOCD
The full name is (Open On-Chip Debugger)
It needs to be opened before use OpenOCD, Connect to the development board , Then open the telent, Or use the command telnet 127.0.0.1 4444
start-up OpenOCD
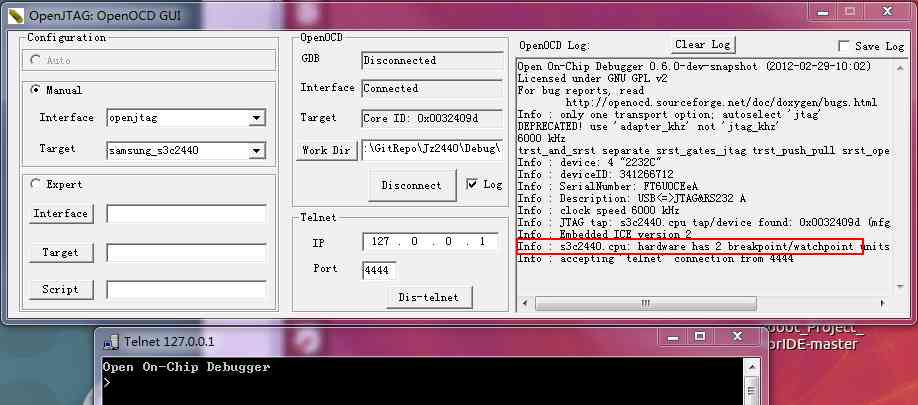
Expert model : Corresponding to more free and advanced configuration , We usually use normal mode directly
- Interface
CorrespondingOpenOCD\0.4.0\interface` Options in TargetCorrespondingOpenOCD\0.4.0\ targetandOpenOCD\0.4.0\board
Enable telnet
Win7 This function is not turned on by default , Need to be in Procedures and functions > Turn on or off windows function > TelentClient open
OpenOCD command
These orders are all in telnet Run in , The official order index is in here ,PDF file OpenOCD User's Guide.pdf
-
The command to remember
-
reset halt -
resume -
step -
load_image
-
-
Target board status processing command (Target state handling)
-
poll Query the current status of the target board -
halt Interrupt the operation of the target board -
resume [address] Restore the target board , If you specify address, From address Start running at -
step [address] Step by step , If you specify address, From address Start executing an instruction at -
reset Reset the target board
-
-
Breakpoint command
-
bp <addr> <length> [hw] At the address addr Set breakpoint , The instruction length is length, hw Indicates a hardware breakpoint -
rbp <addr> Delete address addr The breakpoint at Memory access instructions (Memory access commands)
-
-
Memory access instructions (Memory access commands)
-
mdw ['phys'] <addr> [count] Show from ( Physics ) Address addr At the beginning count( The default is 1) A word (4 byte ) -
mdh ['phys'] <addr> [count] Show from ( Physics ) Address addr At the beginning count( The default is 1) A half word (2 byte ) -
mdb ['phys'] <addr> [count] Show from ( Physics ) Address addr At the beginning count( The default is 1) Bytes -
mww ['phys'] <addr> <value> towards ( Physics ) Address addr Write a word , The value is value -
mwh ['phys'] <addr> <value> towards ( Physics ) Address addr Write a word and a half , The value is value -
mwb ['phys'] <addr> <value> towards ( Physics ) Address addr Write a byte , The value is value
-
-
Memory load command , Be careful : Use... Before downloading the program “ halt” Order to suspend the board , To download the code ; If you use “ poll” Order to find the board of MMU or D-cache Has enabled , You need to use “ arm920t cp15 2 0” 、“ step” Two orders forbid MMU and D-cache.
-
load_image <file> <address> [‘bin’|‘ihex’|‘elf’] -
====== Will file <file> The loading address is address Of memory , The format is ‘bin’、 ‘ihex’、 ‘elf’ -
dump_image <file> <address> <size> -
====== Put memory from address address At the beginning size Byte data read , Save to file <file> in -
verify_image <file> <address> [‘bin’|‘ihex’|‘elf’] -
====== Will file <file> With memory address Compare the starting data , The format is ‘bin’、 ‘ihex’、 ‘elf’
-
-
CPU Architecture related commands (Architecture Specific Commands)
-
reg Print the value of the register -
arm7_9 fast_memory_access ['enable'|'disable'] -
======= To enable or prohibit “ Fast memory access ” -
arm mcr cpnum op1 CRn op2 CRm value Modifying coprocessor registers -
======= such as : arm mcr 15 0 1 0 0 0 close MMU -
arm mrc cpnum op1 CRn op2 CRm Read the coprocessor's registers -
======= such as : arm mcr 15 0 1 0 0 read out cp15 Coprocessor registers 1 -
arm920t cp15 regnum [value] Modify or read cp15 Coprocessor registers -
======= such as arm920t cp15 2 0 close MMU
-
-
Other commands
script <file> perform file Commands in files
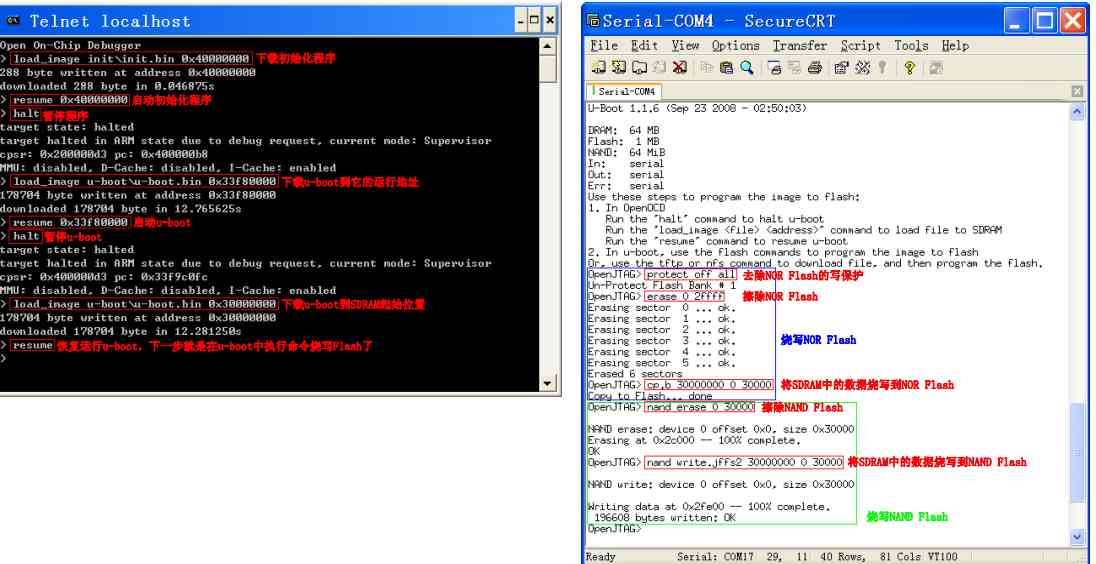
OpenOCD Burn program
-
load_image <file> <address> [‘bin’|‘ihex’|‘elf’] -
====== Will file <file> The loading address is address Of memory , The format is ‘bin’、 ‘ihex’、 ‘elf’ -
====load_image led.bin 0
SDRAM initialization
OpenOCD Can read and write quickly SDRAM, The premise is that the program needs to be initialized first SDRAM, So you can burn it later u-boot To sdram, And then through u-boot Burn other big programs . Here we need an initialization sdram Location independent code init.bin
-
// from Nand Flash start-up -
load_image init/init.bin 0x0 -
resume 0x0 -
//NOR start-up -
load_image init/init.bin 0x40000000 -
resume 0x40000000
burn u-boot, Then open the serial port , You can see it running
-
halt -
load_image u-boot/u-boot.bin 0x33f80000 -
resume 0x33f80000
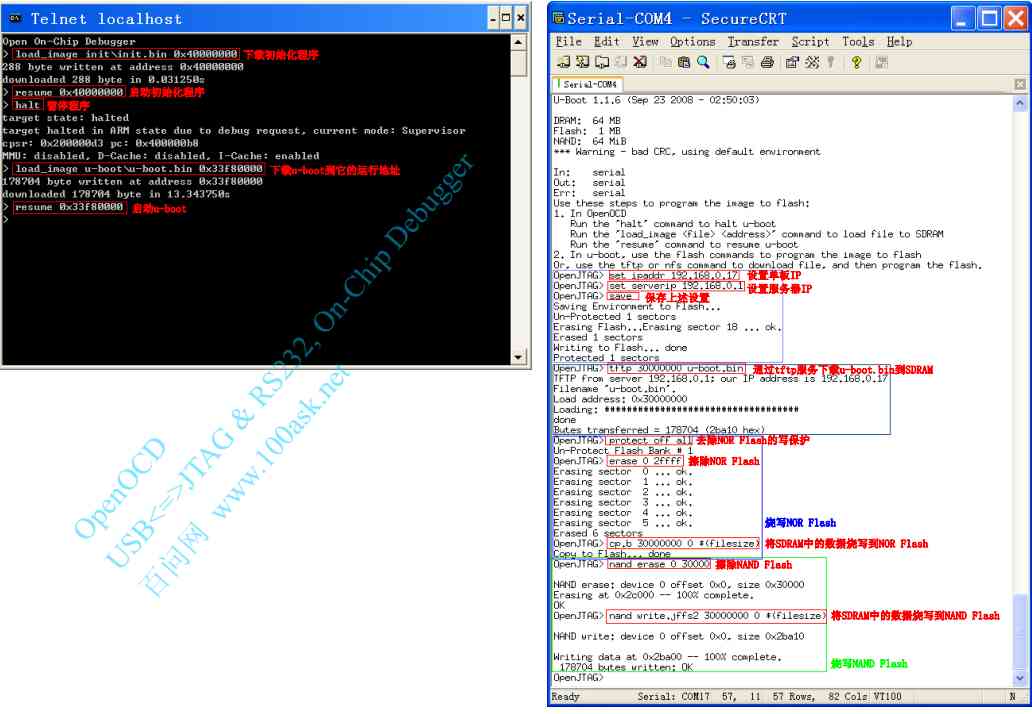
uboot Burn other programs (led/uboot)
- u-boot The command to treat all numbers as 16 Base number , So whether you prefix the number or not “ 0x”, The number of
The words are 16 It's binary . - erase Flash The length of 、 The length of the data burned , These values are based on the burning
The length of the file is determined . u-boot.bin Is the length of the 178704 byte , namely 0x2BA10 byte , It's long used
Degrees are 0x30000, One is for the sake of dealing with Flash The erasable length of (16K Integer multiple ), Second, convenience .
GDB
- linux Next arm-linux-gdb,win Next arm-elf-gdb
-
arm-elf-gdb nand_elf -
target remote 127.0.0.1:3333 -
load
GDB command
| start-up / sign out | |
|---|---|
| gdb [FILE] arm-elf-gdb [FILE] arm-linux-gdb [FILE] | start-up gdb, debugging FILE( You can also leave the file blank ) |
| quit | sign out gdb |
| target remote ip:port | Remote connection |
| File operations | |
| file | load file FILE, Be careful : It won't download to the board |
| load [FILE] | Download the file to the board , If you don't specify FILE, Specify before downloading Yes ( such as file The order designates , or gdb The file specified at runtime ) |
| View source program | |
| list | List a function |
| list | Display a section of source program in the middle of a behavior of the current source file |
| list | And then the previous display continues |
| break * | Set a breakpoint at an address , such as break *0x84 |
| list - | Show the previous source program |
| list list | A program that displays the specified file |
| info source | View the current source program |
| info stack | View stack information |
| info args | View the current parameters |
| Breakpoint operation | |
| break | Set a breakpoint at the function entry |
| break | Set a breakpoint on a line in the current source file |
| break | Set a breakpoint on a line in the specified source file |
| info br | View breakpoints |
| delete | Delete breakpoints |
| diable | No breakpoints |
| enable | Enable breakpoint |
| Watch point (watch) operation | |
| watch | When the specified variable is written , The program is stopped |
| rwatch | When the specified variable is read , The program is stopped |
| Data manipulation | |
| print < EXPRESSION > | View the data |
| set varible=value | Set a variable |
| x /NFU ADDR | Check the memory value ① N Represents the number of repetitions ② F Represents the output format x : 16 Decimal integer format d : Signed decimal integer format u : Unsigned decimal integer format f : Floating point format ③ U Represents the output format : b : byte (byte) h : Double byte value w : Four byte values g : Octet value such as “ x /4ub 0x0” Will be displayed 0 The address starts at 4 Bytes |
| Execution procedure | |
| step next nexti | It's all in one step : step Will trace into a function , next Instruction does not enter the function nexti Execute an assembly instruction |
| continue | Continue with the procedure , After loading a program, it can also be used to start a program |
| help | |
| help [command] | List help information , Or a help letter listing an order |
| Other commands | |
| monitor <command …> | call gdb Server software commands , such as :“ monitor mdw 0x0” It's called openocd Its own orders “ mdw 0x0” |
Conditions of use
-
The code has been repositioned , At its link address . Why? ?【 Set breakpoints in the source file , It's actually setting breakpoints at the link address , Is to modify the memory according to the link address ( Soft breakpoints )】
-
The link script must be in a fixed format
text,data,bssSeparate -
The program being debugged contains debug Information , That is, compiling elf From time to tome
-gOptions-
%.o:%.c -
arm-linux-gcc -Wall -c -g -O2 -o $@ $< -
-
%.o:%.S -
arm-linux-gcc -Wall -c -g -O2 -o $@ $<
-
-
FAQ: Unable to debug relocated code , So code handling and sdram What to do with initialization ? Use opencod To execute , That is to make another program initialization sdram, Use openocd burn
Use steps
-
open openocd, open telent
-
If you need to use sdram The program , First of all OpenOCD Download initialization first sdram The program
-
> load_image init/init.bin 0 -
> resume 0 -
> halt -
target state: halted -
target halted in ARM state due to debug-request, current mode: Supervisor -
cpsr: 0x200000d3 pc: 0x000000b8 -
MMU: disabled, D-Cache: disabled, I-Cache: enabled -
-
// Test it sdram You can use -
> mdw 0x30000000 -
0x30000000: ea000017 -
> mww 0x30000000 0x12345678 -
> mdw 0x30000000 -
0x30000000: 12345678
-
-
open cmd, Input
arn-elf-gdb leds_elfstart-up gdb, Specify procedures -
Connect to OpenOCD
target remote 127.0.0.1:3333 -
Download program
load
Use command scripts directly gdb.init : arm-elf-gdb -x gdb.init leds_elf
-
target remote localhost:3333 -
monitor halt -
monitor arm920t cp15 2 0 -
monitor step -
load -
break main -
continue
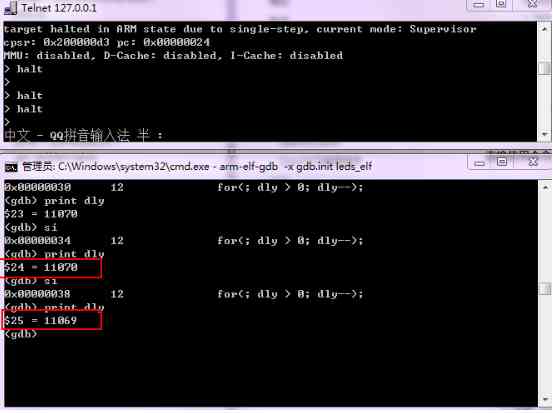
Be careful gdb After running, there is no breakpoint and then it can't stop , Need to be in telnet Use halt, then GDB The interface can continue to input
Common commands
-
si Execute an order -
braek main.c:21 // stay main.c Of 21 Line break point -
c perhaps continue Continue operation -
-
print i // View variable values
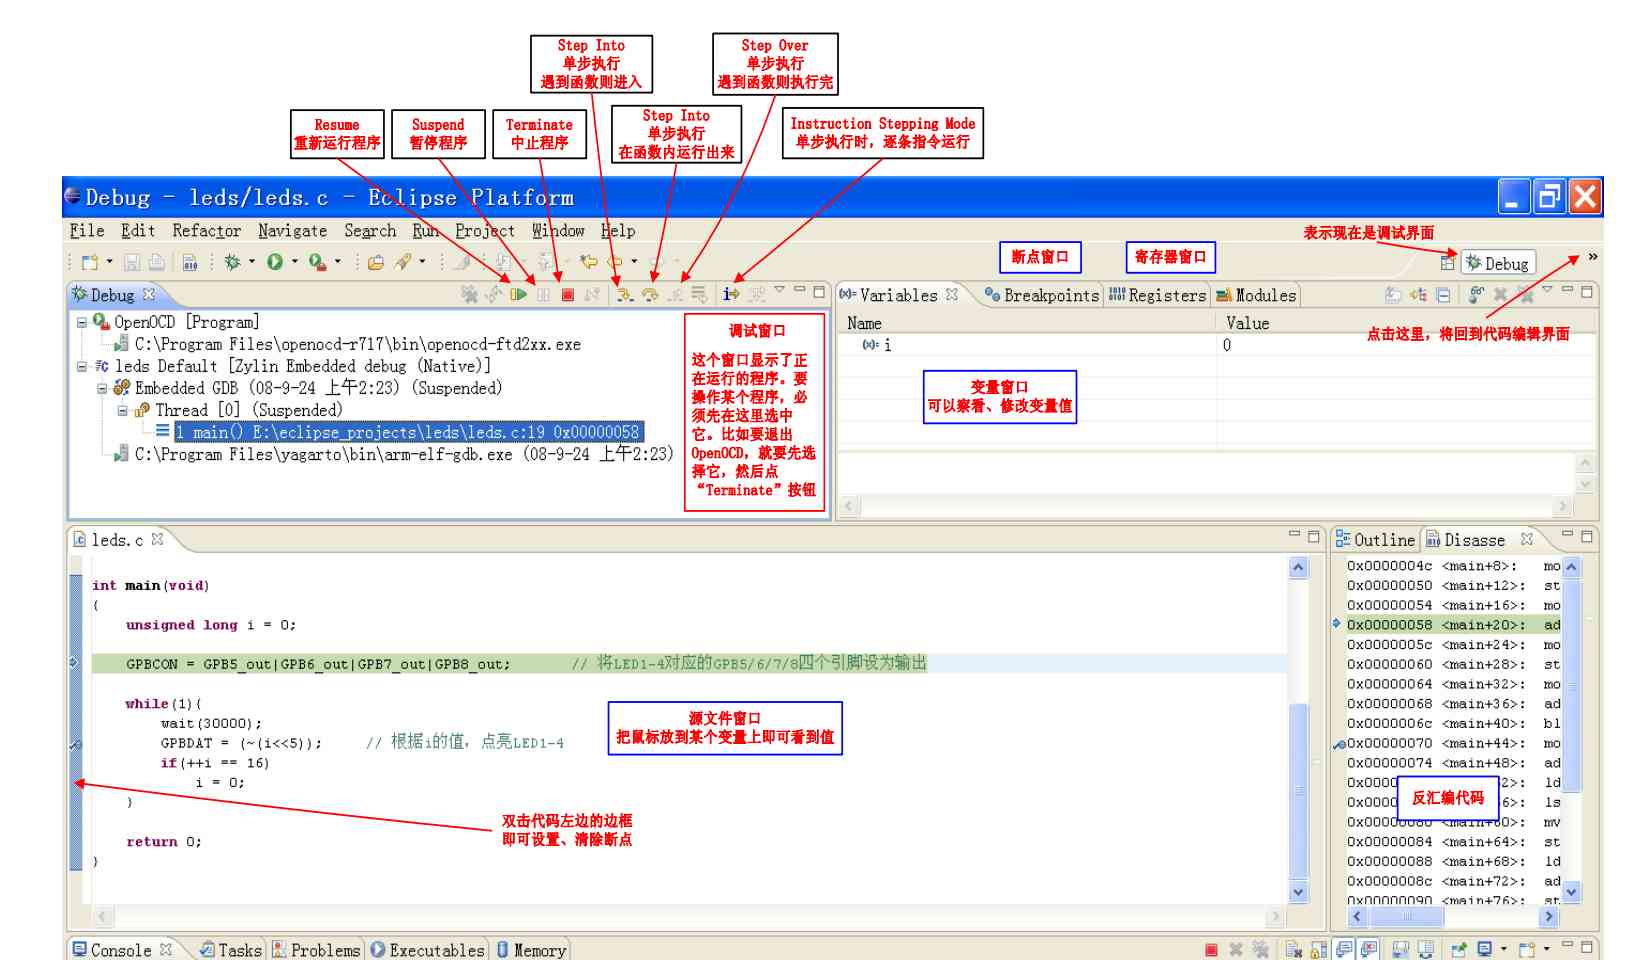
Eclipes
Eclipse yes gdb( Include arm-elf-gdb, arm-linux-gdb) The graphic front desk of , Use Eclipse The essence of debugging is
It's using gdb debug .
Use gdb When debugging , gdb Will use the program's link address . For example main Function break point , gdb Huigen
According to the main The link address of the function finds the corresponding instruction in memory , Change this instruction to a special instruction . When the program executes
When it comes to this particular instruction , It will stop .[ It's software breakpoints ]
Conditions of use
- The program should be on its link address
- If used SDRAM, Initialize first SDRAM, Then download the program to the link address
Simple engineering
-
Click on the icon
Workbench
-
Create a new one C engineering
File -> New -> C Project, choice“ Makefile project->Empty Projects”、“ Other Toolchain” -
The import file is in
File -> ImportMediumGeneral>File System -
Engineering setup
-
stay “ Project” In the menu , Click to remove “ Build Automatically” The front sign
remember , Does not automatically compile the project -
stay “ Project” In the menu , Click on
clean, RemoveStart a build immediately
-
-
compile , In fact, it's directly under the directory
makeIt's OK, too , The post tool chain has been installed- Use
ProjectMediumbuild allandbuild projectAll right - Use
cleanIt's OK - Be careful ,make It's different , One is arm-linux, The other is arm-elf
- Use
-
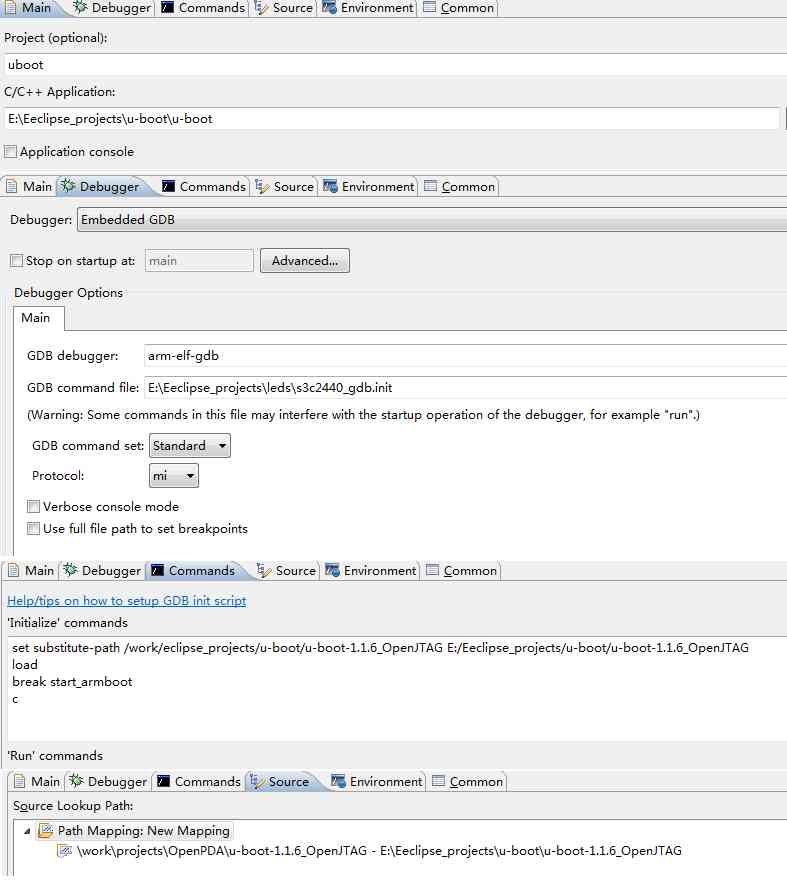
Debug configuration
-
Refer to the following uboot With the graph of , Not uboot No configuration required source Options , The command line does not need the first path configuration
-
Remove debug Medium
stop on startup at main -
project> debug configchoiceZylin Native,new Or double click , Configuration appears -
Main> C/C++ ApplicationSelect debug elfleds.elf -
Debugger> DebuggerchoiceEmbeddedGDB, Below main choicearm-elf-gdbOr is itC:\Program Files\yagarto\bin\arm-elf-gdb.exe -
GDB command file You can choose , You may not choose, It's actually a command that runs ahead of time-
target remote localhost:3333 -
monitor halt -
monitor arm mcr 15 0 1 0 0 0 -
monitor step 0 -
load -
break main -
continue
But although the breakpoint is set here , There seems to be a problem , Still need to be in
commandInput-
load -
break main -
continue
-
-
Be careful
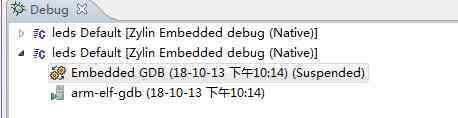
If sometimes you don't see debug window , Click in the upper right corner debug View , then F5 try
Sometimes use clean, We need to see if there is debug There is a , Need to turn off
u-boot engineering
Debug the download from the Internet u-boot when , Need to define CONFIG_SKIP_LOWLEVEL_INIT, It said
“ Skip the initial initialization of the underlying layer ”, Just don't initialize the storage controller , Don't copy again u-boot From itself to SDRAM
in . For Weidong mountain's u-boot, Automatic identification code has been added , There is no need to define this macro .
-
import Related documents
-
The setup command is as follows , This is to establish path correspondence
-
set substitute-path /work/eclipse_projects/u-boot/u-boot-1.1.6_OpenJTAG E:/Eeclipse_projects/u-boot/u-boot-1.1.6_OpenJTAG -
load -
break start_armboot -
c
And then again source Delete the original default, Add the following ( This is actually the order above in effect )
-
\work\projects\OpenPDA\u-boot-1.1.6_OpenJTAG -
E:\Eeclipse_projects\u-boot\u-boot-1.1.6_OpenJTAG\
-
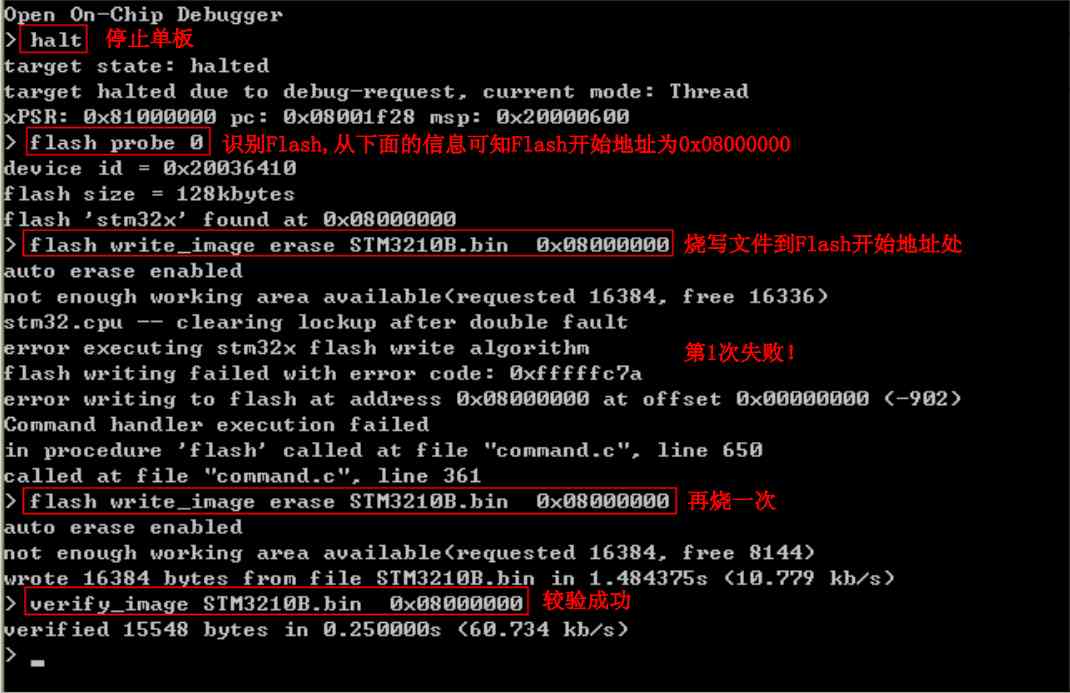
STM32 Burn the program
-
halt -
flash probe 0 -
flash write_image erase STM3210B.bin 0x08000000 -
verify_image STM3210B.bin 0x08000000
Reproduced in :https://www.cnblogs.com/zongzi10010/p/9784797.html
版权声明
本文为[whoisliang]所创,转载请带上原文链接,感谢
边栏推荐
- Flink的安装和测试
- 小程序调用原生onShareAppMessage分享,imageUrl参数是mp4格式怎么办
- js对象数组去重
- Source code analysis of serilog -- implementation of sink
- SEO解决方案制定,如何脱离杯弓蛇影?
- 磁阻式随机存储器MRAM基本原理
- echart 设置柱子之间的间距
- Full stack technology experience tells you: how much does it cost to develop a mall small program?
- 高质量的缺陷分析:让自己少写 bug
- How to use Camtasia to make dynamic animation scene?
猜你喜欢
函数计算进阶-IP查询工具开发

深入分析商淘多用户商城系统如何从搜索着手打造盈利点
Solve the problem that the page does not refresh after the wechat applet uses switchtab to jump
Chrome浏览器 js 关闭窗口失效解决方法
Function calculation advanced IP query tool development
Explore cache configuration of Android gradle plug-in
从一次需求改良漫谈php文件分片上传

明年起旧版本安卓设备将无法浏览大约30%的网页
自定义室内地图在线工具
超简单集成华为系统完整性检测,搞定设备安全防护
随机推荐
Rookie gospel, 28 books step by step to make you a big bull! (a copy of learning syllabus attached)
微服务框架 Go-Micro 集成 Nacos 实战之服务注册与发现
高质量的缺陷分析:让自己少写 bug
标梵IPFS矿机app软件开发软件 IPFSApp开发方法详解
Ubuntu18.04 NAT模式下配置静态IP地址 -2020.11.09
浅谈API网关(API Gateway)如何承载API经济生态链
[invite you to vote] who is the key driver behind these big open source events in 2020?
Ultra simple integration of Huawei system integrity testing, complete equipment security protection
JS object array de duplication
数据库执行truncate table CM_CHECK_ITEM_HIS怎么恢复
Analysis of h264nalu head
Explain git in detail
The worst hacker in history: stealing $1 billion of bitcoin without spending it for seven years, and finally being seized by the Department of justice
自己实现printf函数
轻松构建高颜值应用界面,这些内置图标多重要!
Kubernetes-17: kubernets package management tool -- Introduction and use of Helm
Installation and testing of Flink
5 minutes get I use GitHub's five-year summary of these complaints!
脑机接口先驱炮轰马斯克:“他走的是一条死胡同,说的话我一个字都不同意”
Revealing the logic of moving path selection in Summoner Canyon?