当前位置:网站首页>Shopping malls, storerooms, flat display, user-defined maps can also be played like this!
Shopping malls, storerooms, flat display, user-defined maps can also be played like this!
2022-07-04 06:35:00 【qq5d0e0c6d79517】
as everyone knows , Map is a common way of data visualization . Display data through maps , It can intuitively observe the geographical distribution characteristics of the data . More advanced charts like composite maps , It can be used to show more comprehensive data .
However , The method of determining the boundary and scope of the map , Often based on comparative standard geographic longitude and latitude or coordinate information . For irregular regional data display, the demand will appear a little stretched . for example , In the map, we will divide the whole country into North China 、 The northwest 、 south China 、 The northeast 、 East China 、 Central China , When we want to display regional data according to the division standard of non-standard rules , There will be difficulties . There are also shopping malls 、 workshop 、 Indoor and other types of regional scenes , When we need to show different internal subdivisions through data visualization , It's going to be the same problem .
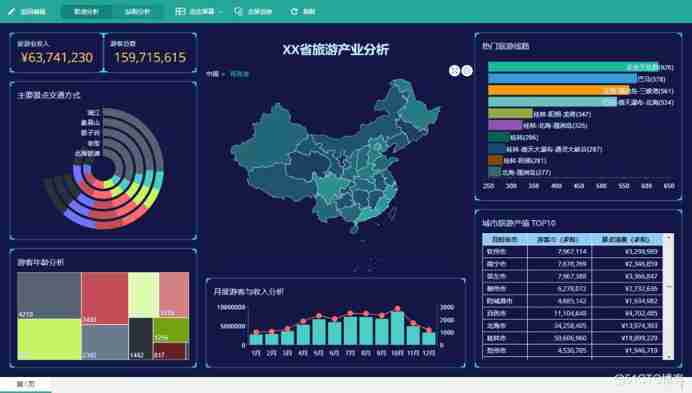
here , We need to get through Custom map To achieve similar requirements . Custom map is a very flexible way to build maps , It imports pictures as the background , Use the marking tool to quickly outline the regional boundary , And name each area , The outlined area is similar to that based on GEOJSON The painted area . On this basis , Data binding can be done , Use the area name to associate with the dimension in the business data , Then realize data binding and visual display .
This article takes the plan of the shopping mall 、 Warehouse design plan 、 Map 、 Apartment layout diagram 、 Take 3D architecture and other scenes as examples , Demonstrate the ability to customize maps :
One 、 Plan of shopping mall
Display the area of each store and the corresponding sales volume of the store in the original plan of the shopping mall , Analyze the floor efficiency of different stores . The conditional color display can be carried out according to different conditions and sales volume . The darker the color, the greater the sales , The shallower it is, the lower the sales . Help operators understand the operation of the mall through visualization , Or provide data support for store location .
Original plan :
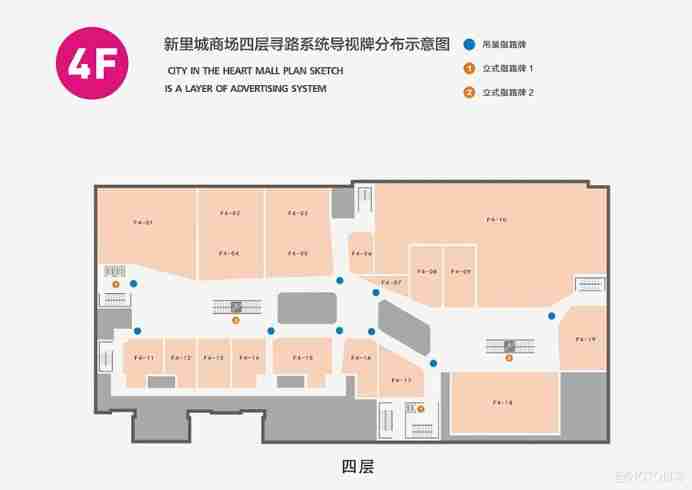
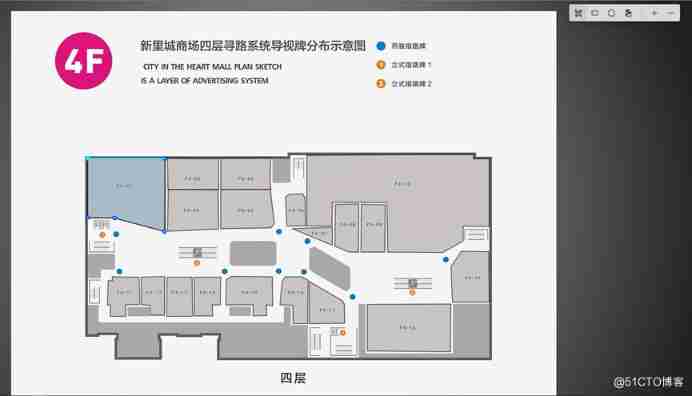
utilize Wyn Enterprise Custom map building tools , Build map areas online and bind data .
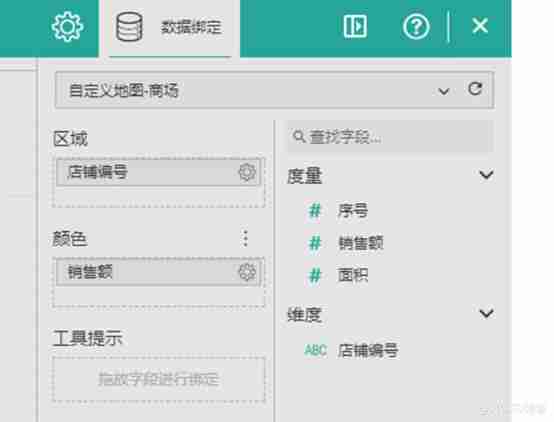
Data binding
Visualization after data binding : It is easy to locate stores with good sales .
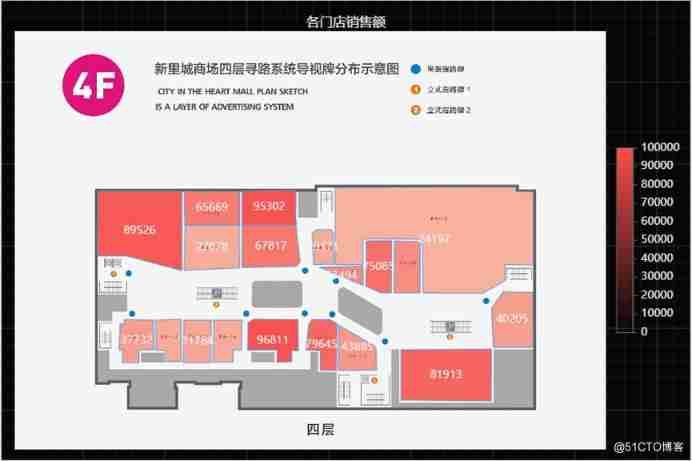
You can find F4-01、F4-15、F4-16 The color of the store area is the darkest , For the store with the largest sales .
One 、 Warehouse plan
Use the warehouse plan to show the raw materials in different areas of the warehouse 、 Partially Prepared Products 、 Quantity of finished products , Then make a reasonable plan for the utilization of the warehouse .
Original plan :
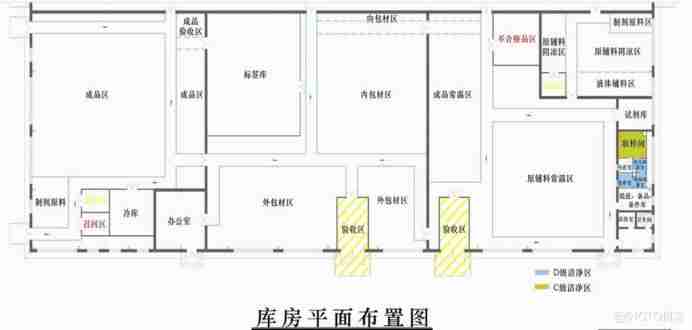
utilize Wyn Enterprise Build a custom map , And bind the data for visual display .
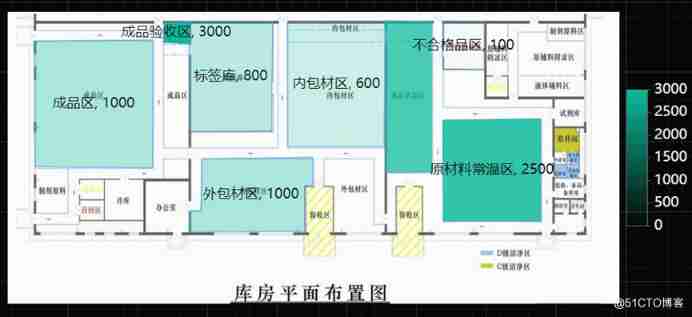
You can find , The color of the normal temperature area of raw materials and the acceptance area of finished products is the darkest , Stacked raw materials 、 Semi finished products at most , It should be handled in time .
One 、 Apartment layout diagram
Yes, the house 、 Indoor platform drawing drawn by architecture , Display the area size of each indoor area through customized map 、 Information such as the quantity of building materials , It can more intuitively display the relevant data information corresponding to the region .
Original picture :
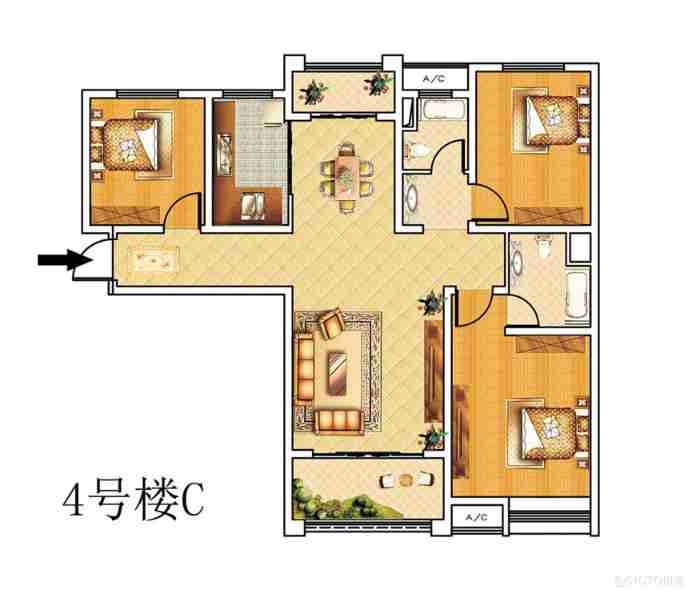
adopt Wyn Enterprise Custom map building tools draw layers and bind business data .
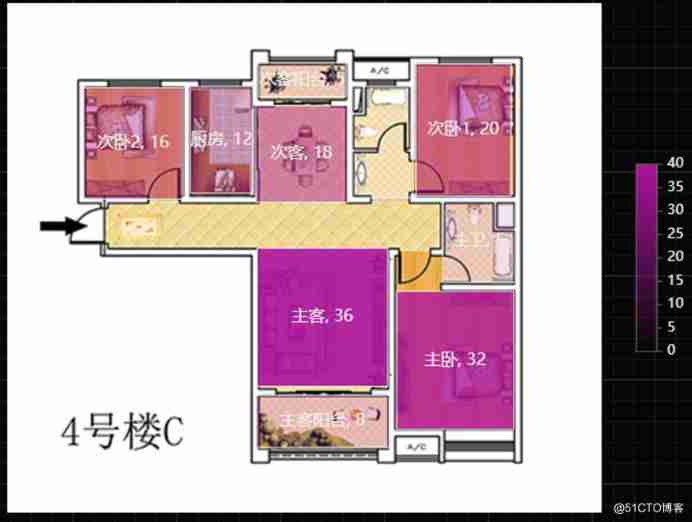
The area data of each area can be observed intuitively from the rendering .
One 、 3D architectural drawing
Through the user-defined map, the layer with the 3D building as the base map is outlined , produce GAOJSON Area , And perform actual data binding , It can display information related to architecture , Such as area 、 Number of households, etc .
Original picture :
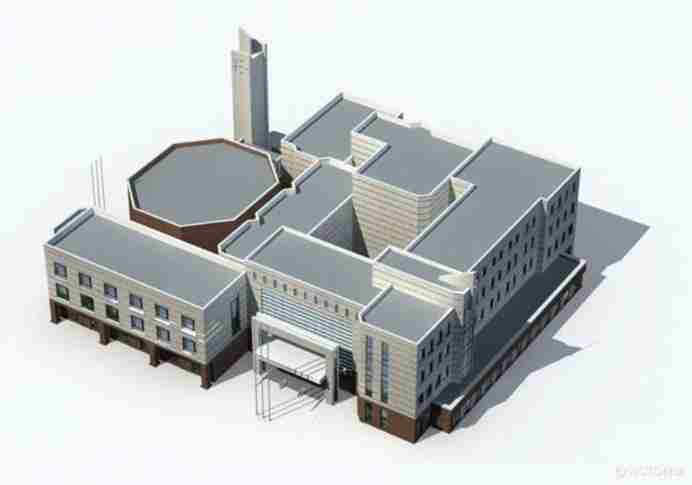
utilize Wyn Enterprise Build custom maps and bind data .
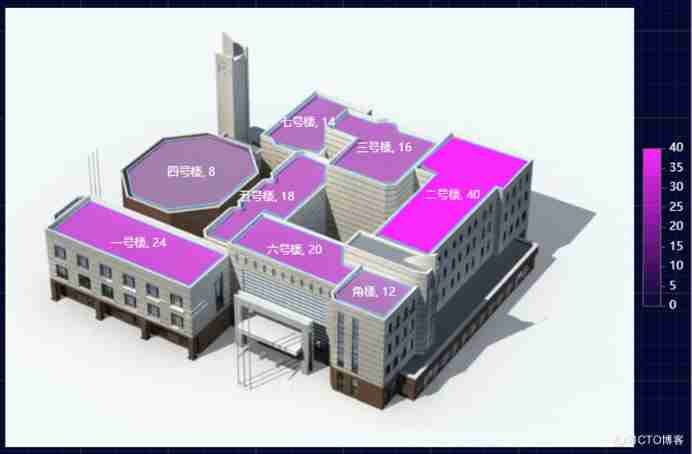
You can intuitively find , The logo area of Building 2 is the darkest , The largest number of households , by 40 Household .
The above customized maps all use Wyn Enterprise Embedded business intelligence software Design , It provides a powerful online custom map building tool , Import base map from 、 Draw boundaries 、 Data binding , Visual display of various customized maps can be realized in one minute . meanwhile , It can realize the data linkage analysis of user-defined areas and other charts .
Custom map effect on such a tall , Are you very excited , Search quickly Wyn Enterprise Experience it .
边栏推荐
- 微信小程序使用rich-text中图片宽度超出问题
- Sort list tool class, which can sort strings
- GoogleChromePortable 谷歌chrome浏览器便携版官网下载方式
- QT get random color value and set label background color code
- Tsinghua University product: penalty gradient norm improves generalization of deep learning model
- Notes and notes
- Realize IIC data / instruction interaction with micro batg135
- STC8H开发(十二): I2C驱动AT24C08,AT24C32系列EEPROM存储
- InputStream/OutputStream(文件的输入输出)
- JSON Web Token----JWT和傳統session登錄認證對比
猜你喜欢

Overview of convolutional neural network structure optimization
QT 获取随机颜色值设置label背景色 代码

2022 where to find enterprise e-mail and which is the security of enterprise e-mail system?
P26-P34 third_ template

Learn about the Internet of things protocol WiFi ZigBee Bluetooth, etc. --- WiFi and WiFi protocols start from WiFi. What do we need to know about WiFi protocol itself?
2022 Xinjiang's latest eight members (Safety Officer) simulated examination questions and answers
Appium foundation - appium installation (II)
![[backpack DP] backpack problem](/img/7e/1ead6fd0ab61806ce971e1612b4ed6.jpg)
[backpack DP] backpack problem
How to avoid JVM memory leakage?

QT get random color value and set label background color code
随机推荐
Tsinghua University product: penalty gradient norm improves generalization of deep learning model
Inputstream/outputstream (input and output of file)
QT QTableWidget 表格列置顶需求的思路和代码
Considerations for testing a website
JSON Web Token----JWT和傳統session登錄認證對比
P26-P34 third_ template
Data analysis notes 09
Learning multi-level structural information for small organ segmentation
7. Agency mode
MySQL learning notes 3 - JDBC
Redis面试题集
Fundamentals of SQL database operation
C language exercises (recursion)
The solution of win11 taskbar right click without Task Manager - add win11 taskbar right click function
tars源码分析之8
[untitled]
The sorting in C language realizes the number sorting method from small to large
Option (024) - do all objects have prototypes?
Invalid bound statement (not found): com. example. mapper. TblUserRecordMapper. login
uniapp 自定義環境變量