当前位置:网站首页>实例讲解将Graph Explorer搬上JupyterLab
实例讲解将Graph Explorer搬上JupyterLab
2022-07-01 18:38:00 【InfoQ】

一、使用前准备
1. 华为云账号
2. OBS 对象存储服务
3. GES 图引擎服务
4. 获取调用 GES 业务面 API 必备的参数
二、使用 GES4Jupyter 连接 GES 服务

import moxing as mox
mox.file.copy('obs://obs-aigallery-zc/GES/ges4jupyter/beta/ges4jupyter.py', 'ges4jupyter.py')
mox.file.copy('obs://obs-aigallery-zc/GES/ges4jupyter/beta/ges4jupyter.html', 'ges4jupyter.html')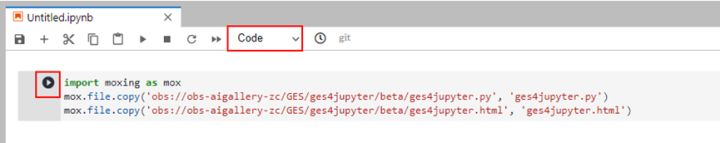
from ges4jupyter import GESConfig, GES4Jupyter, read_csv_config
eip = ''
project_id = ''
graph_name = ''
iam_url = ''
user_name = ''
password = ''
domain_name = ''
project_name = ''
port = 80
eip, project_id, graph_name, iam_url, user_name, password, domain_name, project_name, port = read_csv_config('cn_north_4_graph.csv')
config = GESConfig(eip, project_id, graph_name,
 iam_url = iam_url,
 user_name = user_name,
 password = password,
 domain_name = domain_name,
 project_name = project_name,
 port = port)
ges_util = GES4Jupyter(config, True);- 用于构造 API 的参数:eip,projectId,graph_name, port 这四个参数都参与构造了业务面请求的 url。eip 与 graph_name 两个参数在创图时容易获得,port 参数默认为 80,开启安全模式时为 443,关于 projectId,可参考图引擎官网文档 - 获取项目 id,从图控制台根据图所属的区域来获取项目 id。
- 用于在请求 API 前获取 token 的参数:iam_url, user_name, password, domain_name,project_name,GES4Jupyter 会使用这四个参数获取 token,进而在使用 api 时进行鉴权,相关参数获取请参考:华为图引擎文档 - 业务面 API 认证鉴权和调用 GES 服务业务面 API 相关参数的获取

print('开始创建点索引:')
job_id = ges_util.build_vertex_index()
job_result = ges_util.get_job(job_id)
if 'errorCode' not in job_result:
 for i in range(100):
 if job_result['status'] == 'success':
 break
 else:
 time.sleep(1)
 job_result = ges_util.get_job(job_id)
print('点索引创建完成')
print('开始创建边索引:')
job_id = ges_util.build_edge_index()
job_result = ges_util.get_job(job_id)
if 'errorCode' not in job_result:
 for i in range(100):
 if job_result['status'] == 'success':
 break
 else:
 time.sleep(1)
 job_result = ges_util.get_job(job_id)
print('边索引创建完成')ges_util.cypher_query("call dbms.parameter('needNodeIndex', false)");
ges_util.cypher_query("call dbms.parameter('needEdgeIndex', false)");
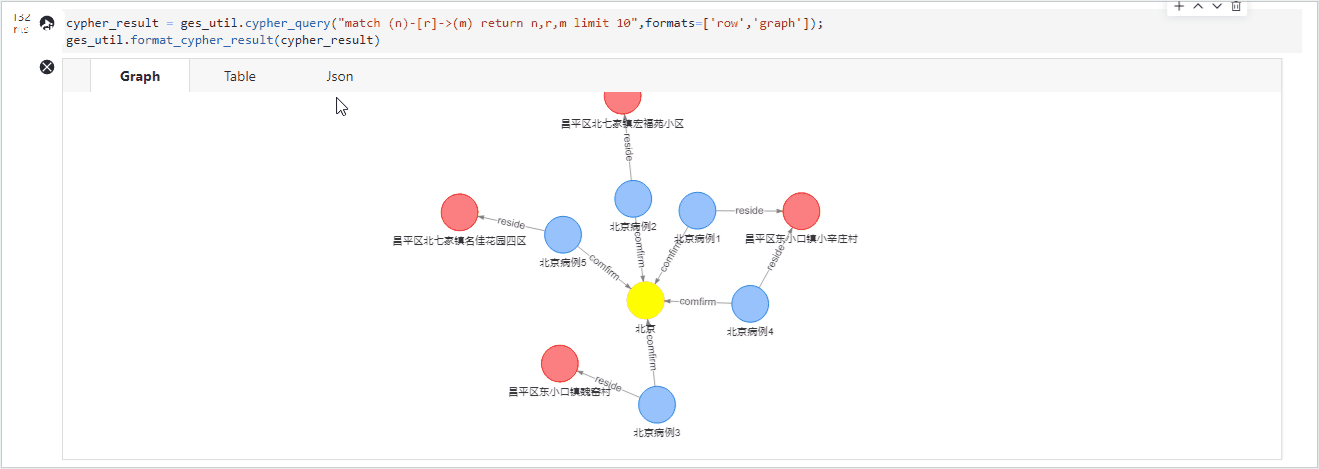
三、使用 GES4Jupyter 调用业务面接口并进行可视化
cypher_result = ges_util.cypher_query("match (n)-[r]->(m) return n,r,m limit 10",formats=['row','graph']);
ges_util.format_cypher_result(cypher_result)
gremlin_result = ges_util.gremlin_query("g.V().outE().bothV().path().limit(2)");
ges_util.format_gremlin_result(gremlin_result)
result = ges_util.path_query({
 "repeat": [
 {
 "operator": "bothV",
 "vertex_filter": {
 "property_filter": {
 "leftvalue": {
 "id": ""
 },
 "predicate": "NOTIN",
 "rightvalue": {
 "value": ["北京"]
 }
 }
 }
 }
 ],
 "until": [
 {
 "vertex_filter": {
 "property_filter": {
 "leftvalue": {
 "id": ""
 },
 "predicate": "=",
 "rightvalue": {
 "value": ["额济纳旗"]
 }
 }
 }
 }
 ],
 "times": 5,
 "queryType": "Tree",
 "vertices": ["北京病例2"]
 })
ges_util.format_path_query(result)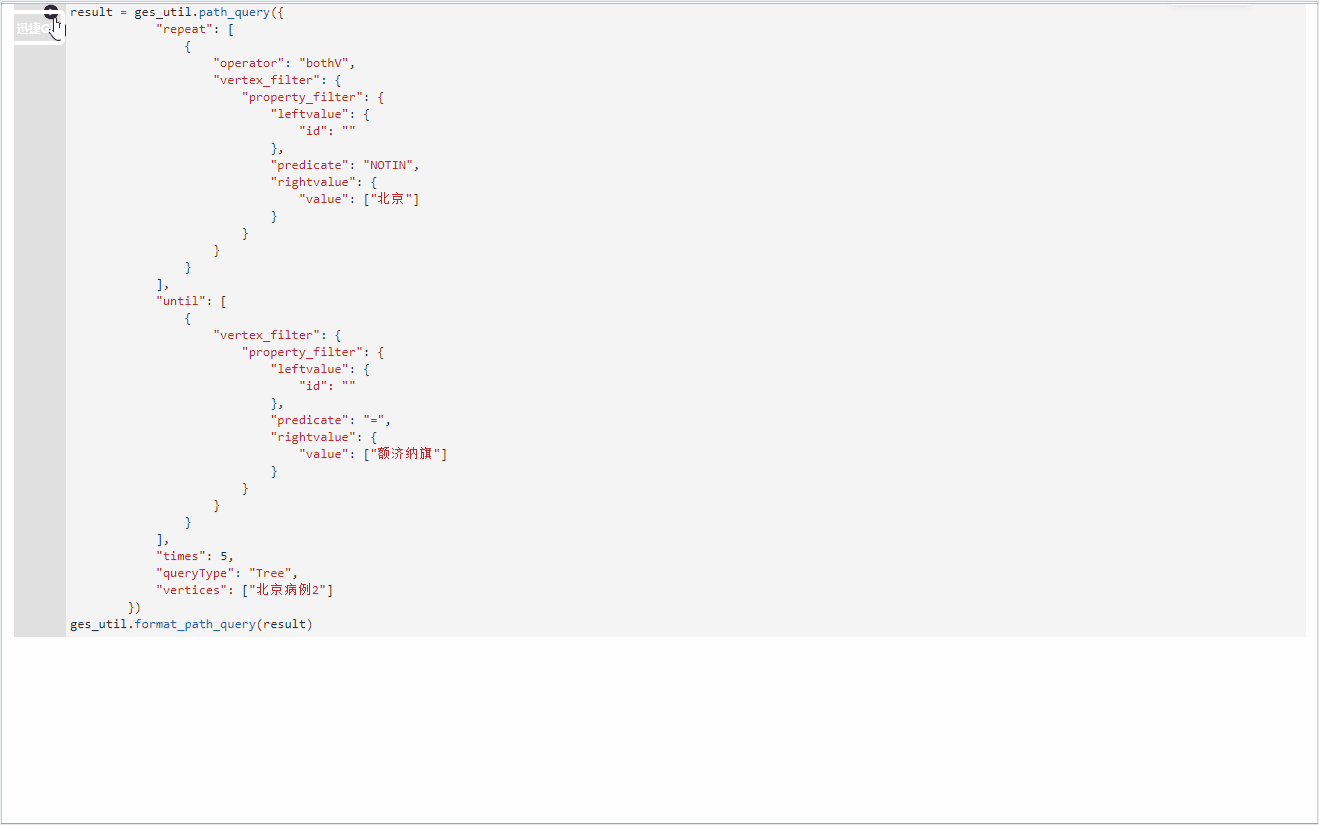
四、图引擎官网有更多案例可以使用 GES4Jupyter 上手体验

边栏推荐
- Livedata postvalue will "lose" data
- 1380. Lucky number in matrix / 1672 Total assets of the richest customers
- 斯坦福、Salesforce|MaskViT:蒙面视觉预训练用于视频预测
- NSI packaging script add file details
- R语言ggplot2可视化:可视化折线图、使用labs函数为折线图添加自定义的Y轴标签信息(customize y axis label)
- R language uses the transmute function of dplyr package to calculate the moving window mean value of the specified data column in dataframe data, and uses ggplot2 package to visualize the line graph b
- 如何在自有APP内实现小程序实现连麦直播
- Leetcode-83 delete duplicate elements in the sorting linked list
- Computer network interview assault
- Three.js学习-相机Camera的基本操作(了解向)
猜你喜欢

Force buckle day33

How to manage 1000 anchors by one person?

Computer network interview assault

6款红黄黑榜摄像头评测:谁最安全?谁画质好?从此让你不再踩雷
Three.js学习-相机Camera的基本操作(了解向)

Lumiprobe Lumizol RNA 提取试剂解决方案
Sum of three numbers

After studying 11 kinds of real-time chat software, I found that they all have these functions

Privacy sandbox is finally coming

Leetcode-83 delete duplicate elements in the sorting linked list
随机推荐
Weekly recommended short videos: be alert to the confusion between "phenomena" and "problems"
LiveData postValue会“丢”数据
1、《创建您自己的NFT集合并发布一个Web3应用程序来展示它们》什么是NFT
R language epidisplay package ordinal or. The display function obtains the summary statistical information of the ordered logistic regression model (the odds ratio and its confidence interval correspo
AI 训练速度突破摩尔定律;宋舒然团队获得RSS 2022最佳论文奖
OpenAI|视频预训练 (VPT):基于观看未标记的在线视频的行动学习
Depth first search - DFS (burst search)
R语言使用epiDisplay包的followup.plot函数可视化多个ID(病例)监测指标的纵向随访图、使用n.of.lines参数指定显示的病例数
Computer network interview assault
Technology implementation and Architecture Practice
用WPF写一款开源方便、快捷的数据库文档查询、生成工具
Lumiprobe 双功能交联剂丨Sulfo-Cyanine5 双-NHS 酯
Write it down once Net travel management background CPU Explosion Analysis
Database - MySQL advanced SQL statement (I)
Leetcode-83 删除排序链表中重复的元素
Lumiprobe 生物分子定量丨QuDye 蛋白定量试剂盒
MySQL connection tools
Case study on comprehensive competitiveness of principal components
R语言使用epiDisplay包的aggregate函数将数值变量基于因子变量拆分为不同的子集,计算每个子集的汇总统计信息
R语言使用dplyr包的transmute函数计算dataframe数据中的指定数据列的移动窗口均值、使用ggplot2包可视化移动均值与原始数据的折线图