当前位置:网站首页>WGCNA analysis basic tutorial summary
WGCNA analysis basic tutorial summary
2022-07-04 21:20:00 【Scientific research workers strive to move bricks】
WGCNA R Bao official website tutorial :
WGCNA: R package for performing Weighted Gene Co-expression Network Analysis
Related articles :
WGCNA: an R package for weighted correlation network analysis | BMC Bioinformatics | Full Text
Weighted gene coexpression network analysis
Weighted correlation network analysis (WGCNA)
Network analysis method based on correlation coefficient , Applicable to multi sample data , The more samples, the more stable the analysis . A systems biology approach to describe the patterns of gene association between different samples .
It can be used to find clusters of highly related genes ( modular ), Summarize such clusters using module characteristic genes or hub genes within the module , Correlate modules with external sample traits ( Using characteristic gene network method ), To measure the distribution of module members , Then it can be used to identify candidate biomarkers or therapeutic targets .
WGCNA advantage :① Make full use of information , Use the information of thousands or nearly 10000 genes with the greatest changes or all genes to identify the gene set of interest , And significant correlation analysis with phenotype ;② Transform the association between thousands of genes and phenotypes into the association between several gene sets and phenotypes , It avoids the problem of multiple hypothesis test correction .
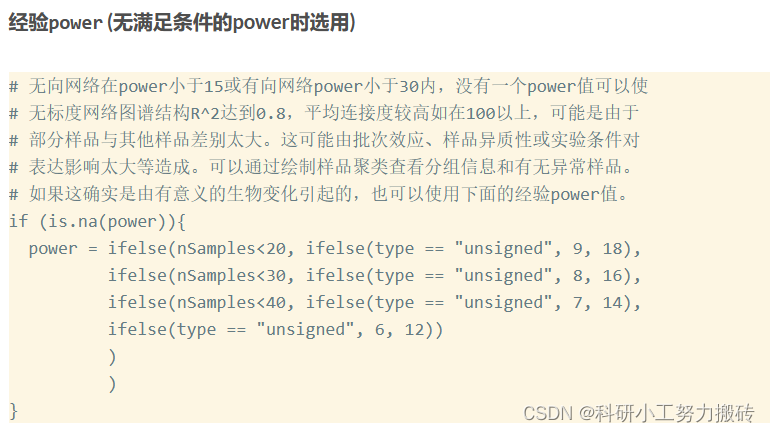
Co expression network ( Weighted genetic network ): Dots represent genes , Edges represent gene expression correlations . Weighting refers to The correlation value is calculated twice ( The value of Mingci is Soft threshold (power, pickSoftThreshold What this function does is determine the appropriate power)). The screening principle of soft threshold is to make the constructed network more consistent with the characteristics of scale-free network . If there is nothing suitable power, Generally, it is because some samples are too different from other samples for some reason . terms of settlement : Remove some samples / Check the experience value .
The edge properties of undirected networks are calculated as abs(cor(genex, geney)) ^ power; The edge properties of directed networks are calculated as (1+cor(genex, geney)/2) ^ power; sign hybrid The edge attribute of is calculated as cor(genex, geney)^power if cor>0 else 0.
Module( modular ): Highly interconnected gene set . In undirected networks , Inside the module is the height relevant Genes . In directed networks , Inside the module is the height positive correlation Genes .
After clustering genes into modules , Each module can be analyzed at three levels :
1. Functional enrichment analysis (GO/KEGG/GSEA) Check whether its functional characteristics are consistent with the research purpose ;
2. Association analysis between modules and traits , Find the module with the highest correlation with the traits concerned ;
3. Correlation analysis between modules and samples , Find the specific and highly expressed module of the sample .
Connectivity ( Connectivity ): It's similar to in the network “ degree ” (degree) The concept of . The connectivity of each gene is that of the genes connected to it Sum of edge attributes .
Module eigengene E: The first principal component of a given model , representative Gene expression profile of the whole model .
Intramodular connectivity: The correlation between a given gene and other genes in a given model , Judge the relationship of genes .
Module membership: Given gene expression profile and given model eigengene The relevance of .
Adjacency matrix ( Adjacency matrix ): A matrix composed of weighted correlation values between genes .
TOM (Topological overlap matrix): Convert adjacency matrix into topological overlap matrix , To reduce noise and false correlation , The new distance matrix obtained , This information can be used to build networks or draw TOM chart .
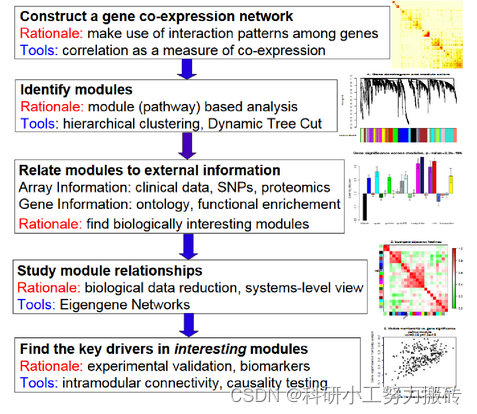
Basic analysis process :
Construct gene coexpression network : Use weighted expression correlation .
Identify gene sets : Based on weighted correlation , Hierarchical cluster analysis , The clustering results are segmented according to the set criteria , Get different gene modules , It is represented by the branches and different colors of the cluster tree .
If there is phenotypic information , Calculate the correlation between gene module and phenotype , Identify modules related to traits .
Study the relationship between models , View the interaction networks of different models from the system level .
Select the driver genes of interest from the key models , Or infer the function of unknown genes according to the function of known genes in the model .
export TOM matrix , Draw a correlation diagram .
The specific actual combat can be operated according to the article reproduction in the link , To get familiar with the process .
Input data format :
1、 Gene expression matrix : Genes are good , Samples are listed . You can use Deseq2 in varianceStabilizingTransformation or log2(x+1) Transform the standardized data . If the data comes from different batches , You need to remove the batch effect first ( I remember that the last transcriptome training class talked about how to operate ). If the data has a system offset , Need to do quantile normalization. perhaps normalizeBetweenArrays().
2、 Trait matrix : It must be continuous or sub type of value (0/1).
3、 Undirected networks are power Less than 15 Or directed network power Less than 30 Inside , None of them power Value can make the scale-free network map structure R^2 achieve 0.8 Or the average connectivity drops to 100 following , It may be because some samples are too different from other samples . This may be caused by Batch effect 、 Sample heterogeneity or Experimental conditions have too much influence on expression And so on , You can view grouping information by plotting sample clusters 、 Associate batch information 、 Process information and whether there are abnormal samples if this is really caused by meaningful biological changes , Experience can also be used power value
reference :
WGCNA analysis , Simple and comprehensive latest tutorial – All over the world
边栏推荐
猜你喜欢

偷窃他人漏洞报告变卖成副业,漏洞赏金平台出“内鬼”
js 3D爆炸碎片图片切换js特效
杰理之AD 系列 MIDI 功能说明【篇】
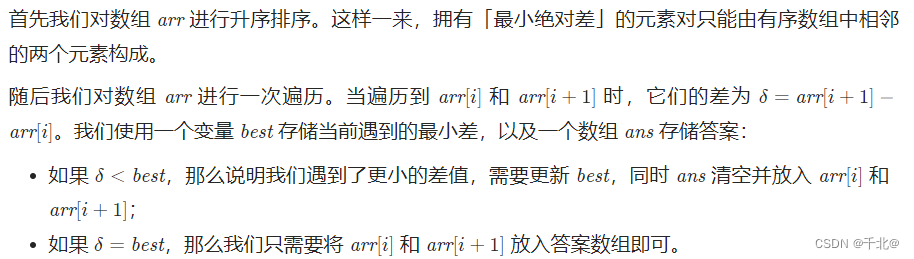
【1200. 最小绝对差】
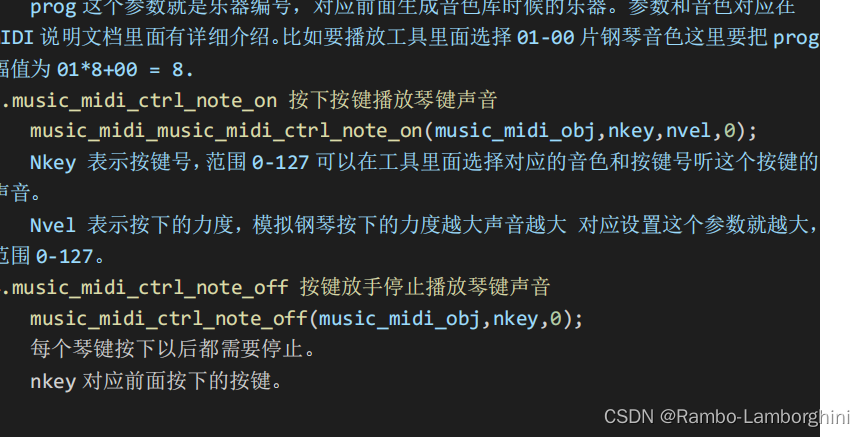
杰理之AD 系列 MIDI 功能说明【篇】
Configuration of DNS server of Huawei ENSP simulator
[1200. Minimum absolute difference]
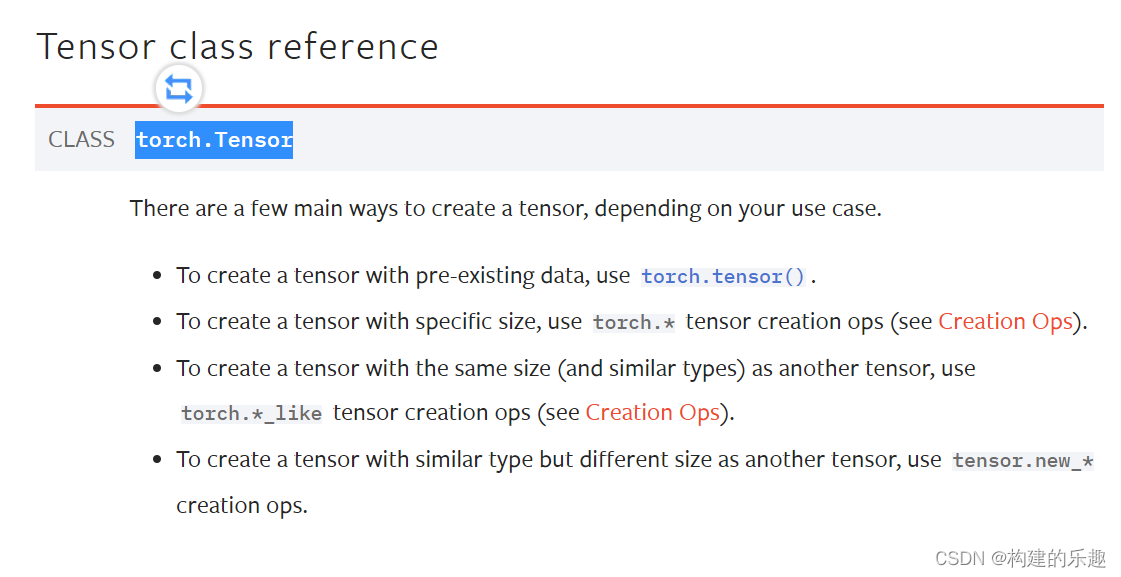
torch. Tensor and torch The difference between tensor
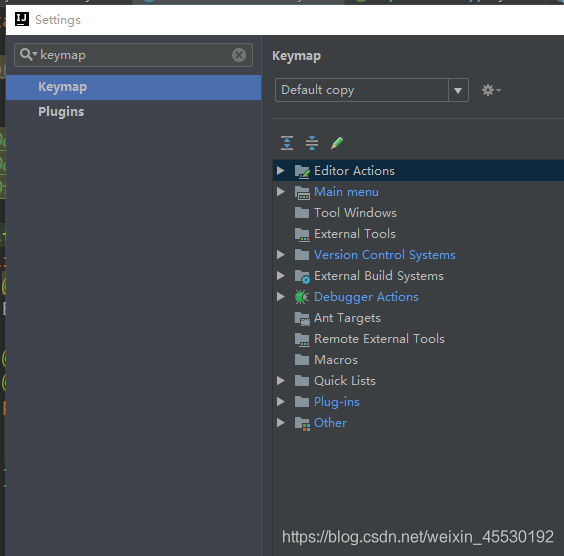
Idea restore default shortcut key
NetWare r7000 Merlin system virtual memory creation failed, prompting that the USB disk reading and writing speed does not meet the requirements. Solution, is it necessary to create virtual memory??
随机推荐
TweenMax表情按钮js特效
实战模拟│JWT 登录认证
6月“墨力原创作者计划”获奖名单公布!邀您共话国产数据库
Huawei ENSP simulator configures DHCP for router
hash 表的概念及应用
heatmap.js图片热点热力图插件
Go language notes (4) go common management commands
PS竖排英文和数字文字怎么改变方向(变竖直显示)
Nmap scan
c语言函数形参自增自减情况分析
Day24:文件系统
Leetcode+ 81 - 85 monotone stack topic
Quelques suggestions pour la conception de l'interface
华为ensp模拟器 DNS服务器的配置
[observation] Lenovo: 3x (1+n) smart office solution, releasing the "multiplier effect" of office productivity
The concept and application of hash table
maya灯建模
redis事务
B站视频 声音很小——解决办法
RFID仓储管理系统解决方案的优点