当前位置:网站首页>【optimtool.unconstrain】无约束优化工具箱
【optimtool.unconstrain】无约束优化工具箱
2022-07-04 20:02:00 【DeeGLMath】
【optimtool.unconstrain】无约束优化工具箱
# import packages
%matplotlib inline
import sympy as sp
import matplotlib.pyplot as plt
import optimtool as oo
def train(funcs, args, x_0):
    f_list = []
    title = ["gradient_descent_barzilar_borwein", "newton_CG", "newton_quasi_L_BFGS", "trust_region_steihaug_CG"]
    colorlist = ["maroon", "teal", "slateblue", "orange"]
    _, _, f = oo.unconstrain.gradient_descent.barzilar_borwein(funcs, args, x_0, False, True)
    f_list.append(f)
    _, _, f = oo.unconstrain.newton.CG(funcs, args, x_0, False, True)
    f_list.append(f)
    _, _, f = oo.unconstrain.newton_quasi.L_BFGS(funcs, args, x_0, False, True)
    f_list.append(f)
    _, _, f = oo.unconstrain.trust_region.steihaug_CG(funcs, args, x_0, False, True)
    f_list.append(f)
    return colorlist, f_list, title
# 可视化函数:传参接口(颜色列表,函数值列表,标题列表)
def test(colorlist, f_list, title):
    handle = []
    for j, z in zip(colorlist, f_list):
        ln, = plt.plot([i for i in range(len(z))], z, c=j, marker='o', linestyle='dashed')
        handle.append(ln)
    plt.xlabel("$Iteration \ times \ (k)$")
    plt.ylabel("$Objective \ function \ value: \ f(x_k)$")
    plt.legend(handle, title)
    plt.title("Performance Comparison")
    return None
Extended Freudenstein & Roth function
f ( x ) = ∑ i = 1 n / 2 ( − 13 + x 2 i − 1 + ( ( 5 − x 2 i ) x 2 i − 2 ) x 2 i ) 2 + ( − 29 + x 2 i − 1 + ( ( x 2 i + 1 ) x 2 i − 14 ) x 2 i ) 2 , x 0 = [ 0.5 , − 2 , 0.5 , − 2 , . . . , 0.5 , − 2 ] . f(x)=\sum_{i=1}^{n/2}(-13+x_{2i-1}+((5-x_{2i})x_{2i}-2)x_{2i})^2+(-29+x_{2i-1}+((x_{2i}+1)x_{2i}-14)x_{2i})^2, x_0=[0.5, -2, 0.5, -2, ..., 0.5, -2]. f(x)=i=1∑n/2(−13+x2i−1+((5−x2i)x2i−2)x2i)2+(−29+x2i−1+((x2i+1)x2i−14)x2i)2,x0=[0.5,−2,0.5,−2,...,0.5,−2].
# make data(4 dimension)
x = sp.symbols("x1:5")
f = (-13 + x[0] + ((5 - x[1])*x[1] - 2)*x[1])**2 + \
    (-29 + x[0] + ((x[1] + 1)*x[1] - 14)*x[1])**2 + \
    (-13 + x[2] + ((5 - x[3])*x[3] - 2)*x[3])**2 + \
    (-29 + x[2] + ((x[3] + 1)*x[3] - 14)*x[3])**2
x_0 = (1, -1, 1, -1) # Random given
# train
color, values, title = train(funcs=f, args=x, x_0=x_0)
# test
test(color, values, title)

Extended Trigonometric function:
f ( x ) = ∑ i = 1 n ( ( n − ∑ j = 1 n cos x j ) + i ( 1 − cos x i ) − sin x i ) 2 , x 0 = [ 0.2 , 0.2 , . . . , 0.2 ] f(x)=\sum_{i=1}^{n}((n-\sum_{j=1}^{n}\cos x_j)+i(1-\cos x_i)-\sin x_i)^2, x_0=[0.2, 0.2, ...,0.2] f(x)=i=1∑n((n−j=1∑ncosxj)+i(1−cosxi)−sinxi)2,x0=[0.2,0.2,...,0.2]
# make data(2 dimension)
x = sp.symbols("x1:3")
f = (2 - (sp.cos(x[0]) + sp.cos(x[1])) + (1 - sp.cos(x[0])) - sp.sin(x[0]))**2 + \
    (2 - (sp.cos(x[0]) + sp.cos(x[1])) + 2 * (1 - sp.cos(x[1])) - sp.sin(x[1]))**2
x_0 = (0.1, 0.1) # Random given
# train
color, values, title = train(funcs=f, args=x, x_0=x_0)
# test
test(color, values, title)

Extended Rosenbrock function
f ( x ) = ∑ i = 1 n / 2 c ( x 2 i − x 2 i − 1 2 ) 2 + ( 1 − x 2 i − 1 ) 2 , x 0 = [ − 1.2 , 1 , . . . , − 1.2 , 1 ] . c = 100 f(x)=\sum_{i=1}^{n/2}c(x_{2i}-x_{2i-1}^2)^2+(1-x_{2i-1})^2, x_0=[-1.2, 1, ...,-1.2, 1]. c=100 f(x)=i=1∑n/2c(x2i−x2i−12)2+(1−x2i−1)2,x0=[−1.2,1,...,−1.2,1].c=100
# make data(4 dimension)
x = sp.symbols("x1:5")
f = 100 * (x[1] - x[0]**2)**2 + \
    (1 - x[0])**2 + \
    100 * (x[3] - x[2]**2)**2 + \
    (1 - x[2])**2
x_0 = (-2, 2, -2, 2) # Random given
# train
color, values, title = train(funcs=f, args=x, x_0=x_0)
# test
test(color, values, title)

Generalized Rosenbrock function
f ( x ) = ∑ i = 1 n − 1 c ( x i + 1 − x i 2 ) 2 + ( 1 − x i ) 2 , x 0 = [ − 1.2 , 1 , . . . , − 1.2 , 1 ] , c = 100. f(x)=\sum_{i=1}^{n-1}c(x_{i+1}-x_i^2)^2+(1-x_i)^2, x_0=[-1.2, 1, ...,-1.2, 1], c=100. f(x)=i=1∑n−1c(xi+1−xi2)2+(1−xi)2,x0=[−1.2,1,...,−1.2,1],c=100.
# make data(2 dimension)
x = sp.symbols("x1:3")
f = 100 * (x[1] - x[0]**2)**2 + (1 - x[0])**2
x_0 = (-1, 0.5) # Random given
# train
color, values, title = train(funcs=f, args=x, x_0=x_0)
# test
test(color, values, title)

Extended White & Holst function
f ( x ) = ∑ i = 1 n / 2 c ( x 2 i − x 2 i − 1 3 ) 2 + ( 1 − x 2 i − 1 ) 2 , x 0 = [ − 1.2 , 1 , . . . , − 1.2 , 1 ] . c = 100 f(x)=\sum_{i=1}^{n/2}c(x_{2i}-x_{2i-1}^3)^2+(1-x_{2i-1})^2, x_0=[-1.2, 1, ...,-1.2, 1]. c=100 f(x)=i=1∑n/2c(x2i−x2i−13)2+(1−x2i−1)2,x0=[−1.2,1,...,−1.2,1].c=100
# make data(4 dimension)
x = sp.symbols("x1:5")
f = 100 * (x[1] - x[0]**3)**2 + \
    (1 - x[0])**2 + \
    100 * (x[3] - x[2]**3)**2 + \
    (1 - x[2])**2
x_0 = (-1, 0.5, -1, 0.5) # Random given
# train
color, values, title = train(funcs=f, args=x, x_0=x_0)
# test
test(color, values, title)

Extended Penalty function
f ( x ) = ∑ i = 1 n − 1 ( x i − 1 ) 2 + ( ∑ j = 1 n x j 2 − 0.25 ) 2 , x 0 = [ 1 , 2 , . . . , n ] . f(x)=\sum_{i=1}^{n-1} (x_i-1)^2+(\sum_{j=1}^{n}x_j^2-0.25)^2, x_0=[1,2,...,n]. f(x)=i=1∑n−1(xi−1)2+(j=1∑nxj2−0.25)2,x0=[1,2,...,n].
# make data(4 dimension)
x = sp.symbols("x1:5")
f = (x[0] - 1)**2 + (x[1] - 1)**2 + (x[2] - 1)**2 + \
    ((x[0]**2 + x[1]**2 + x[2]**2 + x[3]**2) - 0.25)**2
x_0 = (5, 5, 5, 5) # Random given
# train
color, values, title = train(funcs=f, args=x, x_0=x_0)
# test
test(color, values, title)

Perturbed Quadratic function
f ( x ) = ∑ i = 1 n i x i 2 + 1 100 ( ∑ i = 1 n x i ) 2 , x 0 = [ 0.5 , 0.5 , . . . , 0.5 ] . f(x)=\sum_{i=1}^{n}ix_i^2+\frac{1}{100}(\sum_{i=1}^{n}x_i)^2, x_0=[0.5,0.5,...,0.5]. f(x)=i=1∑nixi2+1001(i=1∑nxi)2,x0=[0.5,0.5,...,0.5].
# make data(4 dimension)
x = sp.symbols("x1:5")
f = x[0]**2 + 2*x[1]**2 + 3*x[2]**2 + 4*x[3]**2 + \
    0.01 * (x[0] + x[1] + x[2] + x[3])**2
x_0 = (1, 1, 1, 1) # Random given
# train
color, values, title = train(funcs=f, args=x, x_0=x_0)
# test
test(color, values, title)

Raydan 1 function
f ( x ) = ∑ i = 1 n i 10 ( exp x i − x i ) , x 0 = [ 1 , 1 , . . . , 1 ] . f(x)=\sum_{i=1}^{n}\frac{i}{10}(\exp{x_i}-x_i), x_0=[1,1,...,1]. f(x)=i=1∑n10i(expxi−xi),x0=[1,1,...,1].
# make data(4 dimension)
x = sp.symbols("x1:5")
f = 0.1 * (sp.exp(x[0]) - x[0]) + \
    0.2 * (sp.exp(x[1]) - x[1]) + \
    0.3 * (sp.exp(x[2]) - x[2]) + \
    0.4 * (sp.exp(x[3]) - x[3])
x_0 = (0.5, 0.5, 0.5, 0.5) # Random given
# train
color, values, title = train(funcs=f, args=x, x_0=x_0)
# test
test(color, values, title)

Raydan 2 function
f ( x ) = ∑ i = 1 n ( exp x i − x i ) , x 0 = [ 1 , 1 , . . . , 1 ] . f(x)=\sum_{i=1}^{n}(\exp{x_i}-x_i), x_0=[1,1,...,1]. f(x)=i=1∑n(expxi−xi),x0=[1,1,...,1].
# make data(4 dimension)
x = sp.symbols("x1:5")
f = (sp.exp(x[0]) - x[0]) + \
    (sp.exp(x[1]) - x[1]) + \
    (sp.exp(x[2]) - x[2]) + \
    (sp.exp(x[3]) - x[3])
x_0 = (2, 2, 2, 2) # Random given
# train
color, values, title = train(funcs=f, args=x, x_0=x_0)
# test
test(color, values, title)

Diagonal 1 function
f ( x ) = ∑ i = 1 n ( exp x i − i x i ) , x 0 = [ 1 / n , 1 / n , . . . , 1 / n ] . f(x)=\sum_{i=1}^{n}(\exp{x_i}-ix_i), x_0=[1/n,1/n,...,1/n]. f(x)=i=1∑n(expxi−ixi),x0=[1/n,1/n,...,1/n].
# make data(4 dimension)
x = sp.symbols("x1:5")
f = (sp.exp(x[0]) - x[0]) + \
    (sp.exp(x[1]) - 2 * x[1]) + \
    (sp.exp(x[2]) - 3 * x[2]) + \
    (sp.exp(x[3]) - 4 * x[3])
x_0 = (0.5, 0.5, 0.5, 0.5) # Random given
# train
color, values, title = train(funcs=f, args=x, x_0=x_0)
# test
test(color, values, title)

Diagonal 2 function
f ( x ) = ∑ i = 1 n ( exp x i − x i i ) , x 0 = [ 1 / 1 , 1 / 2 , . . . , 1 / n ] . f(x)=\sum_{i=1}^{n}(\exp{x_i}-\frac{x_i}{i}), x_0=[1/1,1/2,...,1/n]. f(x)=i=1∑n(expxi−ixi),x0=[1/1,1/2,...,1/n].
# make data(4 dimension)
x = sp.symbols("x1:5")
f = (sp.exp(x[0]) - x[0]) + \
    (sp.exp(x[1]) - x[1] / 2) + \
    (sp.exp(x[2]) - x[2] / 3) + \
    (sp.exp(x[3]) - x[3] / 4)
x_0 = (0.9, 0.6, 0.4, 0.3) # Random given
# train
color, values, title = train(funcs=f, args=x, x_0=x_0)
# test
test(color, values, title)

Diagonal 3 function
f ( x ) = ∑ i = 1 n ( exp x i − i sin ( x i ) ) , x 0 = [ 1 , 1 , . . . , 1 ] . f(x)=\sum_{i=1}^{n}(\exp{x_i}-i\sin(x_i)), x_0=[1,1,...,1]. f(x)=i=1∑n(expxi−isin(xi)),x0=[1,1,...,1].
# make data(4 dimension)
x = sp.symbols("x1:5")
f = (sp.exp(x[0]) - sp.sin(x[0])) + \
    (sp.exp(x[1]) - 2 * sp.sin(x[1])) + \
    (sp.exp(x[2]) - 3 * sp.sin(x[2])) + \
    (sp.exp(x[3]) - 4 * sp.sin(x[3]))
x_0 = (0.5, 0.5, 0.5, 0.5) # Random given
# train
color, values, title = train(funcs=f, args=x, x_0=x_0)
# test
test(color, values, title)

Hager function
f ( x ) = ∑ i = 1 n ( exp x i − i x i ) , x 0 = [ 1 , 1 , . . . , 1 ] . f(x)=\sum_{i=1}^{n}(\exp{x_i}-\sqrt{i}x_i), x_0=[1,1,...,1]. f(x)=i=1∑n(expxi−ixi),x0=[1,1,...,1].
# make data(4 dimension)
x = sp.symbols("x1:5")
f = (sp.exp(x[0]) - x[0]) + \
    (sp.exp(x[1]) - sp.sqrt(2) * x[1]) + \
    (sp.exp(x[2]) - sp.sqrt(3) * x[2]) + \
    (sp.exp(x[3]) - sp.sqrt(4) * x[3])
x_0 = (0.5, 0.5, 0.5, 0.5) # Random given
# train
color, values, title = train(funcs=f, args=x, x_0=x_0)
# test
test(color, values, title)

Generalized Tridiagonal 1 function
f ( x ) = ∑ i = 1 n − 1 ( x i + x i + 1 − 3 ) 2 + ( x i − x i + 1 + 1 ) 4 , x 0 = [ 2 , 2 , . . . , 2 ] . f(x)=\sum_{i=1}^{n-1}(x_i+x_{i+1}-3)^2+(x_i-x_{i+1}+1)^4, x_0=[2,2,...,2]. f(x)=i=1∑n−1(xi+xi+1−3)2+(xi−xi+1+1)4,x0=[2,2,...,2].
# make data(3 dimension)
x = sp.symbols("x1:4")
f = (x[0] + x[1] - 3)**2 + (x[0] - x[1] + 1)**4 + \
    (x[1] + x[2] - 3)**2 + (x[1] - x[2] + 1)**4
x_0 = (1, 1, 1) # Random given
# train
color, values, title = train(funcs=f, args=x, x_0=x_0)
# test
test(color, values, title)

Extended Tridiagonal 1 function:
f ( x ) = ∑ i = 1 n / 2 ( x 2 i − 1 + x 2 i − 3 ) 2 + ( x 2 i − 1 − x 2 i + 1 ) 4 , x 0 = [ 2 , 2 , . . . , 2 ] . f(x)=\sum_{i=1}^{n/2}(x_{2i-1}+x_{2i}-3)^2+(x_{2i-1}-x_{2i}+1)^4, x_0=[2,2,...,2]. f(x)=i=1∑n/2(x2i−1+x2i−3)2+(x2i−1−x2i+1)4,x0=[2,2,...,2].
# make data(2 dimension)
x = sp.symbols("x1:3")
f = (x[0] + x[1] - 3)**2 + (x[0] - x[1] + 1)**4
x_0 = (1, 1) # Random given
# train
color, values, title = train(funcs=f, args=x, x_0=x_0)
# test
test(color, values, title)

Extended TET function : (Three exponential terms)
f ( x ) = ∑ i = 1 n / 2 ( ( exp x 2 i − 1 + 3 x 2 i − 0.1 ) + exp ( x 2 i − 1 − 3 x 2 i − 0.1 ) + exp ( − x 2 i − 1 − 0.1 ) ) , x 0 = [ 0.1 , 0.1 , . . . , 0.1 ] . f(x)=\sum_{i=1}^{n/2}((\exp x_{2i-1} + 3x_{2i} - 0.1) + \exp (x_{2i-1} - 3x_{2i} - 0.1) + \exp (-x_{2i-1}-0.1)), x_0=[0.1,0.1,...,0.1]. f(x)=i=1∑n/2((expx2i−1+3x2i−0.1)+exp(x2i−1−3x2i−0.1)+exp(−x2i−1−0.1)),x0=[0.1,0.1,...,0.1].
# make data(4 dimension)
x = sp.symbols("x1:5")
f = sp.exp(x[0] + 3*x[1] - 0.1) + sp.exp(x[0] - 3*x[1] - 0.1) + sp.exp(-x[0] - 0.1) + \
    sp.exp(x[2] + 3*x[3] - 0.1) + sp.exp(x[2] - 3*x[3] - 0.1) + sp.exp(-x[2] - 0.1)
x_0 = (0.2, 0.2, 0.2, 0.2) # Random given
# train
color, values, title = train(funcs=f, args=x, x_0=x_0)
# test
test(color, values, title)

边栏推荐
- Advantages of RFID warehouse management system solution
- Poster cover of glacier
- Ten years' experience of byte test engineer directly hits the pain point of UI automation test
- 企业数字化转型最佳实践案例:基于云的数字化平台系统安全措施简介与参考
- What if the computer page cannot be full screen? The solution of win11 page cannot be full screen
- [1200. Minimum absolute difference]
- NetWare r7000 Merlin system virtual memory creation failed, prompting that the USB disk reading and writing speed does not meet the requirements. Solution, is it necessary to create virtual memory??
- What if the brightness of win11 is locked? Solution to win11 brightness locking
- hash 表的概念及应用
- 剑指 Offer II 80-100(持续更新)
猜你喜欢
What should I do if my computer sharing printer refuses access

Alibaba testers use UI automated testing to achieve element positioning
Hwinfo hardware detection tool v7.26 green version

分析伦敦银走势图的技巧
接口設計時的一些建議
多模输入事件分发机制详解
Golang中UTF编码和字符集
Some suggestions for interface design
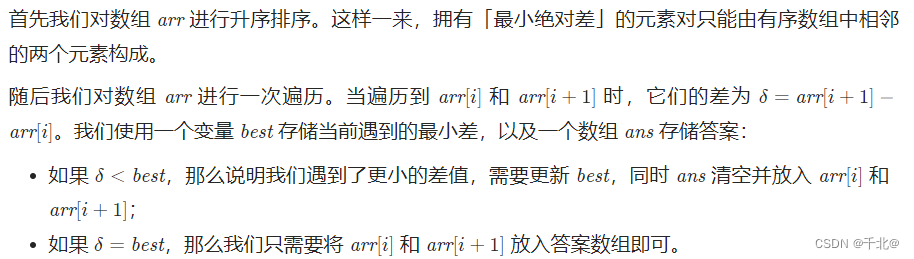
【1200. 最小绝对差】
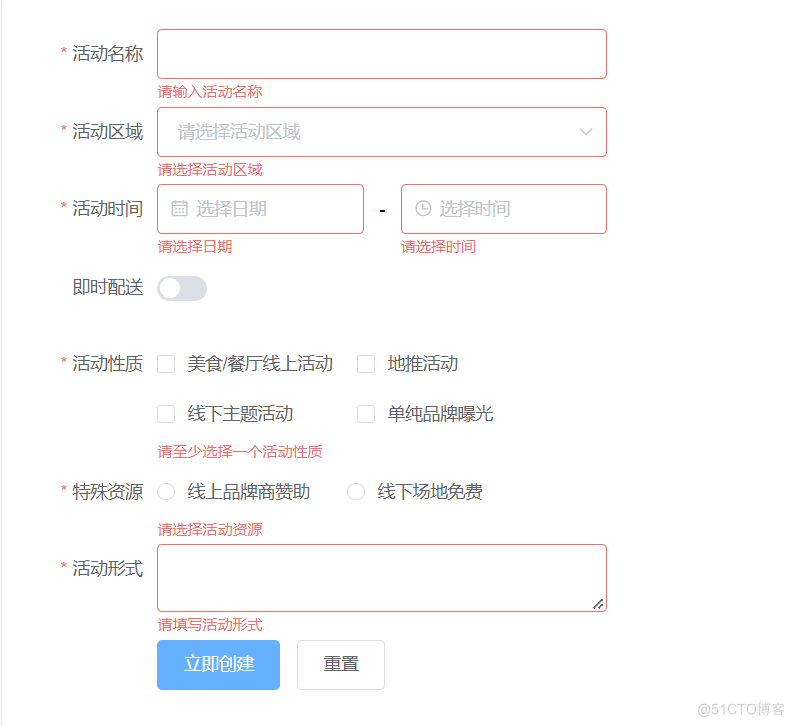
Common verification rules of form components -1 (continuously updating ~)
随机推荐
See how Tencent does interface automation testing
嵌入式TC 测试用例
mysql语句执行详解
What if the win11 shared file cannot be opened? The solution of win11 shared file cannot be opened
【解决方案】PaddlePaddle 2.x调用静态图模式
Four traversal methods of binary tree, as well as the creation of binary tree from middle order to post order, pre order to middle order, pre order to post order, and sequence [specially created for t
测试员的算法面试题-找众数
[server data recovery] a case of RAID5 data recovery stored in a brand of server
BFC面试简述
多模输入事件分发机制详解
The concept and application of hash table
Understand Alibaba cloud's secret weapon "dragon architecture" in the article "science popularization talent"
What is the development of block hash quiz game system? Hash quiz game system development (case mature)
Hands on deep learning (III) -- convolutional neural network CNN
jekins初始化密码没有或找不到
接口设计时的一些建议
LeetCode 8. 字符串转换整数 (atoi)
Play the music of youth
Idea restore default shortcut key
《动手学深度学习》(三) -- 卷积神经网络 CNN