当前位置:网站首页>JVM memory area and garbage collection
JVM memory area and garbage collection
2020-11-06 01:18:00 【Clamhub's blog】
1、JAVA Memory area and memory overflow
1.1、 summary
Java in JVM Memory management mechanism is provided ,Java Virtual machine is executing Java During the process of the program, the memory is divided into different data areas , Pictured :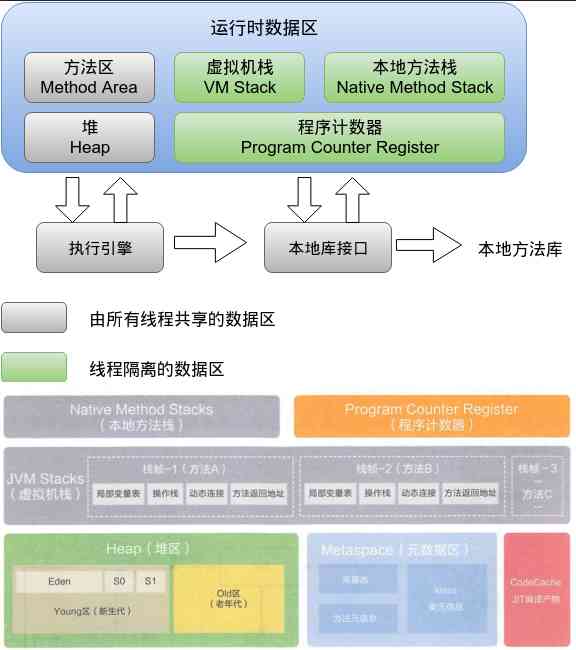
1.2、 Program counter
Program counter is the line number indicator of bytecode executed by the current thread , The function is to get the next bytecode instruction to be executed according to the counter value . When it comes to java Method , It records the address of the executing virtual machine bytecode instruction , If it is Native Method , Then the value of this counter is null . There is no such thing as OutOfMemoryError.
1.3、 Virtual machine stack
Every ordinary Java Method ( remove Native Method ) The stack frame will be created at the same time during execution , Used to store local variables 、 Stack operation 、 Dynamic links 、 Method exit information , Each method is called until the completion of the process corresponding to the stack frame in JVM Stack in and stack out . The memory space required by the local variable table is allocated among compilers .
There are two types of exceptions associated with the virtual machine stack :
- StackOverflowError
The stack depth of thread request is greater than the maximum depth allowed by virtual machine .
- OutOfMemoryError
The virtual machine stack cannot be extended to enough memory .
1.4、 Native Method Stack
For virtual machine execution Native Method , The others are the same as the local method stack . There will be StackOverflowError and OutOfMemoryError.
1.5、 Pile up
Create a heap after the virtual machine starts , For storing object instances . The heap is the main working area of the garbage collector , Mainly divided into the new generation and the old generation , The new generation can be subdivided into Eden Space 、From Survivor Space 、To Survivor Space .java Program startup , You can use -Xmx And -Xms Control the size of the heap . If there is no memory in the heap to complete the instance allocation and the heap cannot be expanded, it will be thrown OutOfMemoryError.
1.6、 Method area
The method area mainly stores the metadata of the class , Such as class information loaded by virtual machine 、 Constant 、 Static variables 、 Real time compiler compiled code ,JDK1.8 It was realized by permanent replacement ,JDK1.8 Then use Metaspace , And Metaspace uses system memory . If you can't request memory , Will throw out OutOfMemoryError.
2、 Garbage collection
2.1、 How to judge that the object has died ?
2.1.1、 Reference counting
Add a reference counter to the object , When there's a place to quote , Counter value +1, When the reference fails , Counter value -1. The counter for 0 The object of death is , But there's a problem : Object circular reference , Two objects refer to each other , The reference counter that causes them is not 0, So I can't tell GC Recycling .
2.1.2、GC Roots Search for
Java It is used in GC ROOT Search for , The idea is to go through a series called “GC Roots” As the starting point , Start with these nodes and drill down , The path in search is called the reference chain , When GC Roots When you can't reach an object , The object is not available .
GC Roots These include the following :
- Objects referenced in local variable table in stack frame
- Object referenced by a class static property in a method area
- The object referenced by a constant in the method area
- Native Method Stack Native Method reference object
2.2、 Garbage collection algorithm
2.2.1、 Mark - Clear algorithm
Mark - The clearing algorithm is divided into two stages :
- Mark : First mark all objects to be recycled .
- eliminate : Uniformly reclaim marked objects .
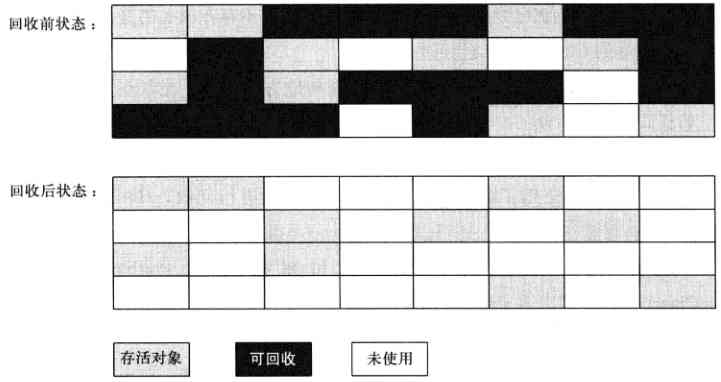
This algorithm has two disadvantages :
- The efficiency is not high
- It will generate discontinuous memory fragments
2.2.2、 Copy algorithm
The replication algorithm is very efficient , It divides the available memory into two equal sized blocks according to the capacity , Use only one piece at a time , When one piece is used up , Copy the surviving objects to another piece , Then clear the used memory space .

This algorithm is very suitable for recycling the new generation , In the new generation, it is divided into Eden Space 、From Survivor Space 、To Survivor Space , Generally, the proportion of allocated memory is 8:1:1, When recycling , take Eden And From Survivor Objects that are still alive in are copied to To Survivor in , Then clean up Eden And From Servivor Space , When To Survivor When there is not enough space , Need to rely on the old age .
2.2.3、 Mark - Sorting algorithm
In the old age , The survival rate of the subjects is relatively high , So mark - The sorting algorithm has been proposed , First mark the objects to recycle , Then move all living objects to one end , And then clean up the dead :

2.2.4、 Generational collection algorithm
The idea of generational recycling is based on the life cycle of the object , Divide different memory into several pieces , According to the characteristics of each block of memory, the appropriate collection algorithm , For example, the new generation uses replication algorithm , The old days use signs - Sorting algorithm .
2.3、 Garbage collector
The following figure shows 7 Different generations of collectors , If there is a connection between the two collectors , Can be used with .

You can view the garbage collector information through the following command :
1 |
java -XX:+PrintCommandLineFlags -version |
My test server results :
1 |
-XX:InitialHeapSize=524503488 -XX:MaxHeapSize=8392055808 -XX:+PrintCommandLineFlags -XX:+UseCompressedClassPointers -XX:+UseCompressedOops -XX:+UseParallelGC |
It can be seen that :ParallelGC.
JVM Parameter correspondence :
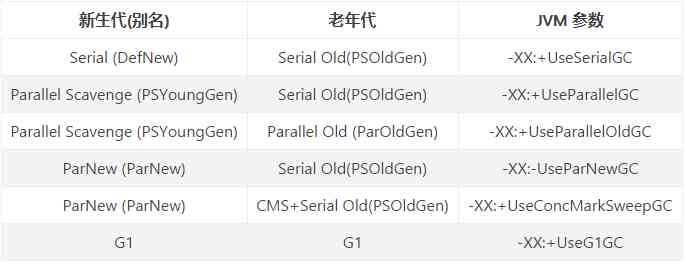
Here is a brief introduction to 7 A garbage collector :
2.3.1、Serial The collector
A new generation of single-threaded collectors , A simple and efficient .
2.3.2、ParNew The collector
Serial Multithreaded version of collector , In addition to multithreading in garbage collection , The rest go with Serial The collectors are the same .
2.3.3、Parallel Scavenge The collector
Parallel Scavenge Collector is a new generation of parallel collector which adopts replication algorithm , Focus on the throughput of the system , Tasks that are suitable for background computing without too much user interaction .
2.3.4、Serial Old The collector
Serial Old It's a single threaded old-fashioned garbage collector , Use the tag - Sorting algorithm . It is simple and efficient .
2.3.5、Parallel Old The collector
Parallel Old The collector is Parallel Scanenge The old version , Multithreaded garbage collection , It's also marked - Sorting algorithm .
2.3.6、CMS The collector
CMS Focus on service response time , It's based on markers - Clear algorithm implementation . With concurrent collection 、 The characteristic of a low pause .
2.3.7、G1 The collector
Garbage First, Based on tags - Sorting algorithm , It will Java Pile up ( Including the new generation and the old generation ) It is divided into several independent areas of fixed size , And keep track of the amount of garbage in these areas , Maintain a priority list in the background , Each time according to the allowed collection time , Priority to recycle the most garbage .
3、CPU High occupancy troubleshooting
3.1、 linux View process information
1 |
top |

3.2、 View process occupancy cpu Most threads
1 |
ps -mp 23967 -o THREAD,tid,time |

3.3、 Threads ID turn 16 Base number
1 |
printf "%x\n" 23968 |

3.4、 View thread information
1 |
jstack 23967 |grep -A 10 5da0 |

1 |
jstack 23967 |grep 5da0 -A 30 |

3.5、 View the object information of the process
1 |
jmap -histo:live 23967 | more |

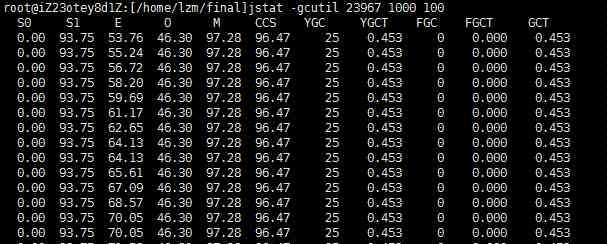
3.6、 View the progress of GC situation
1 |
jstat -gcutil 23967 1000 100 |
Reference resources
utilize jmap and MAT Wait for tools to check JVM Runtime heap memory

版权声明
本文为[Clamhub's blog]所创,转载请带上原文链接,感谢
边栏推荐
- 網路程式設計NIO:BIO和NIO
- PHP应用对接Justswap专用开发包【JustSwap.PHP】
- Did you blog today?
- Skywalking series blog 5-apm-customize-enhance-plugin
- 钻石标准--Diamond Standard
- Process analysis of Python authentication mechanism based on JWT
- Working principle of gradient descent algorithm in machine learning
- Can't be asked again! Reentrantlock source code, drawing a look together!
- GUI 引擎评价指标
- 关于Kubernetes 与 OAM 构建统一、标准化的应用管理平台知识!(附网盘链接)
猜你喜欢

In order to save money, I learned PHP in one day!

采购供应商系统是什么?采购供应商管理平台解决方案

大数据应用的重要性体现在方方面面
快快使用ModelArts,零基礎小白也能玩轉AI!

数据产品不就是报表吗?大错特错!这分类里有大学问

Just now, I popularized two unique skills of login to Xuemei
(1) ASP.NET Introduction to core3.1 Ocelot

Aprelu: cross border application, adaptive relu | IEEE tie 2020 for machine fault detection

条码生成软件如何隐藏部分条码文字
Use of vuepress
随机推荐
xmppmini 專案詳解:一步一步從原理跟我學實用 xmpp 技術開發 4.字串解碼祕笈與訊息包
Can't be asked again! Reentrantlock source code, drawing a look together!
PHPSHE 短信插件说明
It's so embarrassing, fans broke ten thousand, used for a year!
容联完成1.25亿美元F轮融资
In order to save money, I learned PHP in one day!
熬夜总结了报表自动化、数据可视化和挖掘的要点,和你想的不一样
Nodejs crawler captures ancient books and records, a total of 16000 pages, experience summary and project sharing
Troubleshooting and summary of JVM Metaspace memory overflow
DTU连接经常遇到的问题有哪些
Python3 e-learning case 4: writing web proxy
Basic principle and application of iptables
GUI 引擎评价指标
After reading this article, I understand a lot of webpack scaffolding
Sort the array in ascending order according to the frequency
Vue 3 responsive Foundation
“颜值经济”的野望:华熙生物净利率六连降,收购案遭上交所问询
How to demote a domain controller in Windows Server 2012 and later
数字城市响应相关国家政策大力发展数字孪生平台的建设
速看!互联网、电商离线大数据分析最佳实践!(附网盘链接)