当前位置:网站首页>记一次 .NET 差旅管理后台 CPU 爆高分析
记一次 .NET 差旅管理后台 CPU 爆高分析
2022-07-03 03:39:00 【dotNET跨平台】
一:背景
1. 讲故事
前段时间有位朋友在微信上找到我,说他的 web 系统 cpu 运行一段时候后就爆高了,让我帮忙看一下是怎么回事,那就看吧,声明一下,我看 dump 是免费的,主要是锤炼自己技术,没有某软工程师高额的技术分析费。
闲话不多说,我们上 windbg 说话。
二:WinDbg 分析
1. CPU 真的爆高吗
是否真的爆高,我们得自己先验证下,使用 !tp 命令看一下即可。
0:065> !tp
CPU utilization: 81%
Worker Thread: Total: 32 Running: 7 Idle: 25 MaxLimit: 8191 MinLimit: 32
Work Request in Queue: 1
    AsyncTimerCallbackCompletion [email protected]
--------------------------------------
Number of Timers: 1
--------------------------------------
Completion Port Thread:Total: 4 Free: 4 MaxFree: 64 CurrentLimit: 4 MaxLimit: 1000 MinLimit: 32
从卦象看,确实存在 CPU 爆高的情况,根据过往经验,托管程序爆高大多是因为GC触发所致,但触发 GC 的原因千奇百怪,毕竟在 clr 层面 GC 触发的原因高达 14 种,代码如下:
static const char* const str_gc_reasons[] =
{
    "alloc_soh",
    "induced",
    "lowmem",
    "empty",
    "alloc_loh",
    "oos_soh",
    "oos_loh",
    "induced_noforce",
    "gcstress",
    "induced_lowmem",
    "induced_compacting",
    "lowmemory_host",
    "pm_full_gc",
    "lowmemory_host_blocking"
};
2. 真的是 GC 触发吗
验证当前程序是否为 GC 触发,方式有很多,可以用 !t 或者 !t -special,但这两种方式不是特别准,最准的就是根据GC模式直接到 CLR 里去搜全局变量 clr!SVR::gc_heap::gc_started 的值就可以了,参考如下:
0:038> dp clr!SVR::gc_heap::gc_started L1
712d3190  00000001
可以看到,此时的 gc_started=1,说明 GC 是触发状态,接下来可以从所有的线程栈中搜 garbage_collect 或者 gc1 什么的关键词即可。
0:038> k
 # ChildEBP RetAddr
00 0318f934 70de8248     clr!SVR::gc_heap::relocate_survivor_helper+0x1ea
01 0318f944 70de83df     clr!SVR::gc_heap::relocate_survivors_in_plug+0x24
02 0318f970 70de84ac     clr!SVR::gc_heap::relocate_survivors_in_brick+0x70
03 0318f9a8 70de830b     clr!SVR::gc_heap::relocate_survivors+0xe4
04 0318fa00 70de218a     clr!SVR::gc_heap::relocate_phase+0xb9
05 0318fbb4 70de18bf     clr!SVR::gc_heap::plan_phase+0x136e
06 0318fbec 70de1d49     clr!SVR::gc_heap::gc1+0x101
07 0318fc3c 70de1421     clr!SVR::gc_heap::garbage_collect+0x746
08 0318fc58 70ddacde     clr!SVR::gc_heap::gc_thread_function+0x14a
09 0318fc6c 70ddac6f     clr!SVR::gc_heap::gc_thread_stub+0x72
0a 0318fc80 770a6a14     clr!GCThreadStub+0x1f
0b 0318fc94 77e4a9ef     kernel32!BaseThreadInitThunk+0x24
0c 0318fcdc 77e4a9ba     ntdll!__RtlUserThreadStart+0x2f
0d 0318fcec 00000000 ntdll!_RtlUserThreadStart+0x1b从卦象看,gc_thread_stub 表示当前是一个 GC 线程,它正在处于 relocate_phase 阶段,这表明当前是一个 压缩回收,GC回收流程图可以看下官方文档。
GarbageCollectGeneration()
    {
        SuspendEE();
        garbage_collect();
        RestartEE();
    }

    garbage_collect()
    {
        generation_to_condemn();
        gc1();
    }

    gc1()
    {
        mark_phase();
        plan_phase();
    }

    plan_phase()
    {
        // actual plan phase work to decide to
        // compact or not
        if (compact)
        {
            relocate_phase();
            compact_phase();
        }
        else
            make_free_lists();
    }
在这个阶段,托管堆也会是损坏状态,你可以用 !dumpheap -stat 验证下。
0:038> !dumpheap -stat
The garbage collector data structures are not in a valid state for traversal.
It is either in the "plan phase," where objects are being moved around, or
we are at the initialization or shutdown of the gc heap. Commands related to
displaying, finding or traversing objects as well as gc heap segments may not
work properly. !dumpheap and !verifyheap may incorrectly complain of heap
consistency errors.
Object <exec cmd="!ListNearObj /d 03301000">03301000</exec> has an invalid method table.
3. 为什么会出现压缩回收
一般来说,GC 分清除和压缩回收,后者属于一种重量级操作,很伤GC,在临时段上还稍微好一些,接下来我们看下当前 GC 是在回收哪一代?可以到 CLR 里面去查一下判决代字段。clr!WKS::GCHeap::GcCondemnedGeneration。
0:038> dp clr!SVR::GCHeap::GcCondemnedGeneration L1
712d79d8  00000002
糟了,结果是个 2,这个 2 表示 fullGC, 也就是全量回收,大多对应着 gc_reason=lowmem 的情况,也就是内存不足。
4. 真的内存不足吗
要想找到答案,我们用 !address -summary 看下当前的虚拟内存情况。
0:038> !address -summary

--- Usage Summary ---------------- RgnCount ----------- Total Size -------- %ofBusy %ofTotal
<unknown>                              1835          dce6e000 (   3.452 GB)  91.56%   86.29%
Image                                   842           f436000 ( 244.211 MB)   6.33%    5.96%
Free                                    312           eba5000 ( 235.645 MB)            5.75%
Stack                                   451           2d80000 (  45.500 MB)   1.18%    1.11%
Heap                                     72           2342000 (  35.258 MB)   0.91%    0.86%
TEB                                     150             96000 ( 600.000 kB)   0.02%    0.01%
Other                                     7             4e000 ( 312.000 kB)   0.01%    0.01%
PEB                                       1              1000 (   4.000 kB)   0.00%    0.00%

--- Type Summary (for busy) ------ RgnCount ----------- Total Size -------- %ofBusy %ofTotal
MEM_PRIVATE                            2051          dd635000 (   3.459 GB)  91.76%   86.48%
MEM_IMAGE                              1267          11ad1000 ( 282.816 MB)   7.33%    6.90%
MEM_MAPPED                               40           2345000 (  35.270 MB)   0.91%    0.86%

--- State Summary ---------------- RgnCount ----------- Total Size -------- %ofBusy %ofTotal
MEM_COMMIT                             2604          cbe7d000 (   3.186 GB)  84.51%   79.65%
MEM_RESERVE                             754          255ce000 ( 597.805 MB)  15.49%   14.60%
MEM_FREE                                312           eba5000 ( 235.645 MB)            5.75%

--- Largest Region by Usage ----------- Base Address -------- Region Size ----------
<unknown>                                    3300000          20087000 ( 512.527 MB)
Image                                       6f819000            f5f000 (  15.371 MB)
Free                                        fea50000           1590000 (  21.562 MB)
Stack                                        3110000             7a000 ( 488.000 kB)
Heap                                        3bc80000            621000 (   6.129 MB)
TEB                                         fe6e5000              1000 (   4.000 kB)
Other                                       fea10000             33000 ( 204.000 kB)
PEB                                         fea49000              1000 (   4.000 kB)
从卦象看,当前的 MEM_COMMIT=3.186G, 最大的Free块 Free=15.371MB,再根据之前展示的内存地址,我们发现这个程序是 32bit ,跑了 64bit 机器上,这种情况下程序最多可占用 4G 内存空间,虽然 MEM_RESERVE= 597.805 MB, 但这种 RESERVE 是零散的,本质上来说此时的程序处于虚拟地址紧张,由于 虚拟地址 紧张,导致 GC 在不断的做 全量内存 回收。
三:总结
根据上面的分析, GC 触发的原因主要还是 32bit 程序的 4G 内存限制所致, 导致 GC 在不停的做全量回收,这种场景真的让 GC 很尴尬,优先解决办法就是将程序改成 64bit,后面再看看如何优化程序内存,毕竟现在托管堆处于损坏状态,也不好分析啦。
边栏推荐
- [national programming] [software programming - Lecture Video] [zero foundation introduction to practical application]
- Introduction à mongodb
- navicat 导出数据库的表结构
- Limit of one question per day
- The calculation of stripe, kernel and padding in CNN
- Role of JS No
- Limit of one question per day
- ffmpeg之 一张/多张图片合成视频
- Mongodb master profile
- Mysql Mac版下载安装教程
猜你喜欢

Limit of one question per day

Use three JS make a simple 3D scene
![C programming learning notes [edited by Mr. Tan Haoqiang] (Chapter III sequence programming) 05 data input and output](/img/38/9c460fc58b62609dd02e7c61207ae6.jpg)
C programming learning notes [edited by Mr. Tan Haoqiang] (Chapter III sequence programming) 05 data input and output
Vs 2019 installation and configuration opencv

Summary of electromagnetic spectrum

小程序获取用户头像和昵称

编译文件时报错:错误: 编码GBK的不可映射字符

Introduction à mongodb
The calculation of stripe, kernel and padding in CNN
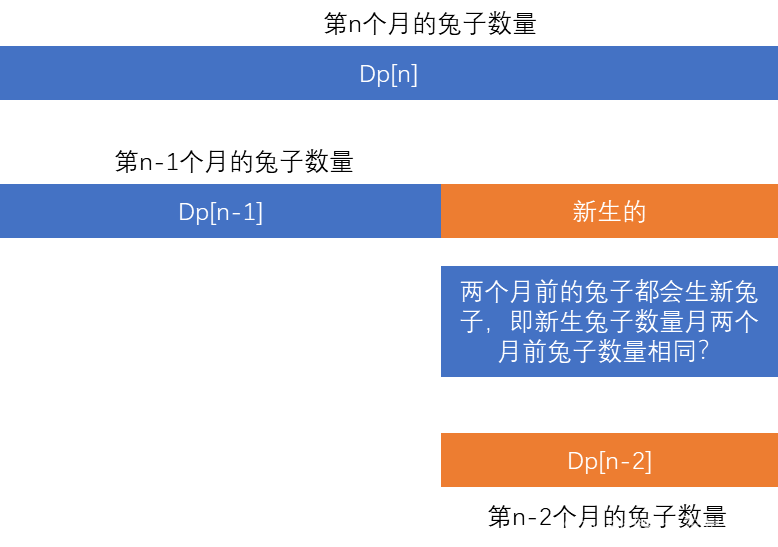
leetcode:动态规划模板
随机推荐
FileZilla Client下載安裝
CEPH Shangwen network xUP Nange that releases the power of data
递归:一维链表和数组
如何迈向IPv6之IPv6过渡技术-尚文网络奎哥
Introduction à mongodb
8.8.2-PointersOnC-20220214
IPv6过渡技术-6to4手工隧道配置实验--尚文网络奎哥
2022年已过半,得抓紧
[DRM] simple analysis of DRM bridge driver call process
Lvgl usage experience
Don't use the new Dede collection without the updated Dede plug-in
2020-01-01t00:00:00.000000z date format conversion
[mathematical logic] normal form (conjunctive normal form | disjunctive normal form | major item | minor item | maximal item | minor item | principal conjunctive normal form | principal disjunctive no
Table structure of Navicat export database
静态网页 和 动态网页的区别 & WEB1.0和WEB2.0的区别 & GET 和 POST 的区别
Tidal characteristics of the Bohai Sea and the Yellow Sea
shardingsphere动态数据源
The series of hyperbolic function in daily problem
PHP generates PDF tcpdf
umi 路由拦截(简单粗暴)