当前位置:网站首页>Beats (filebeat, metricbeat), kibana, logstack tutorial of elastic stack
Beats (filebeat, metricbeat), kibana, logstack tutorial of elastic stack
2022-07-02 09:25:00 【niceyz】
If you haven't heard of Elastic Stack, Then you must have heard of ELK, actually ELK It is the abbreviation of three kinds of software , Namely Elasticsearch、Logstash、Kibana form , In the process of development , There are new members Beats The addition of , So it forms Elastic Stack. So ,ELK It's the old name ,Elastic Stack It's a new name .
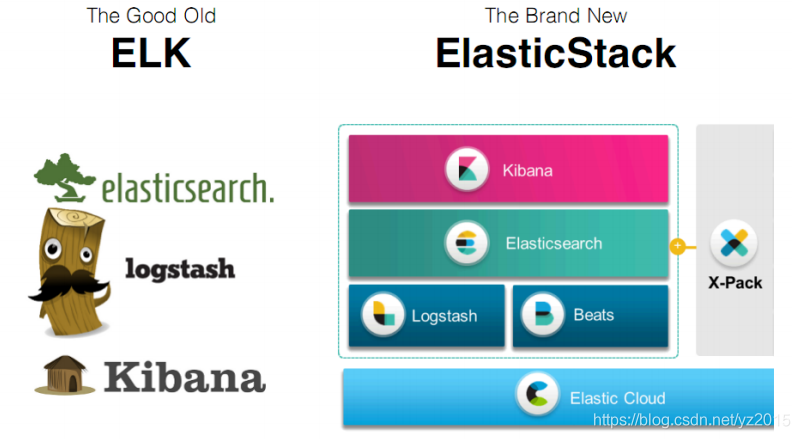
The whole department Elastic Stack The technology stack includes :
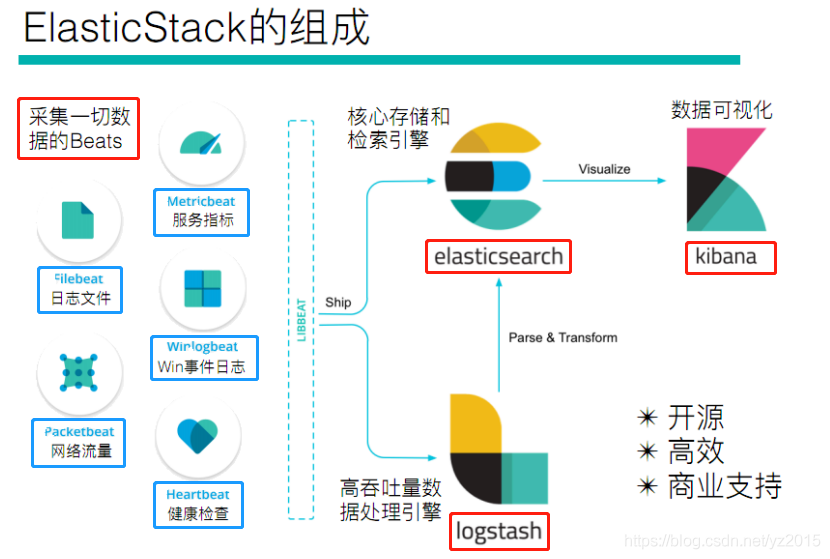
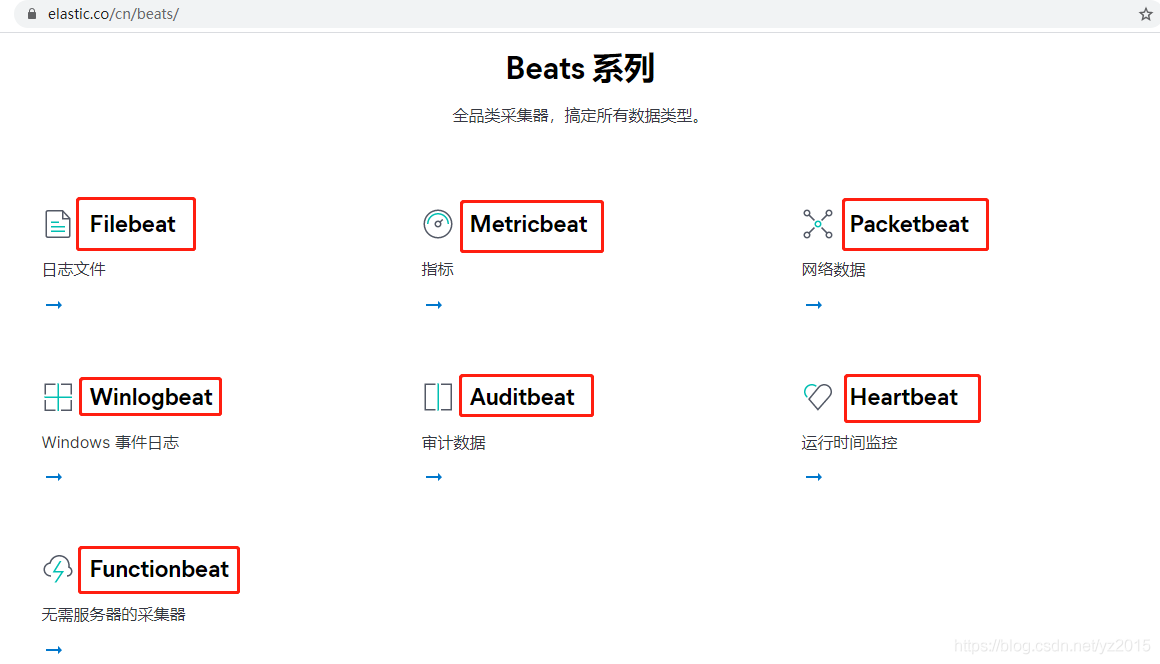
As can be seen from the figure above Beats It doesn't mean a single technology , It refers to a series of technologies in general , The collection ability is more lightweight and powerful , And has gradually replaced Logstash The status of .
https://www.elastic.co/cn/beats/
1. Beats brief introduction

2. Beats And Filebeat

2.1 framework
Used to monitor 、 Collect server log files .Harvester: harvester Spooler: Scroll , Transmit data downstream

2.2 Deploy and run
download : https://www.elastic.co/downloads/beats This article downloads :filebeat-7.10.0-linux-x86_64.tar.gz
Extract to the specified directory :tar -zxvf filebeat-7.10.0-linux-x86_64.tar.gz -C ../opt/
Enter into filebeat Catalog :cd /opt/filebeat-7.10.0-linux-x86_64/
2.2.1 Read standard input
# Create the following configuration file vim yztest.yml Notice that there are spaces
filebeat.inputs:
- type: stdin The standard input
enabled: true Enable input
setup.template.settings:
index.number_of_shards: 3 Appoint ES Number of index partitions , Now I don't need
output.console: Output to console
pretty: true Output beautification
enable: true Output enable

./filebeat -e -c yztest.yml

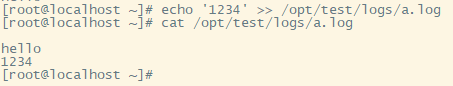
2.3 Read the file
filebeat.inputs:
- type: log The input type is log file
enabled: true Enable input
paths:
- /opt/test/logs/*.log Log path to collect
setup.template.settings:
index.number_of_shards: 3 Appoint ES Number of index partitions , Now I don't need
output.console: Output to console
pretty: true Output beautification
enable: true Output enable

./filebeat -e -c yztest-log.yml
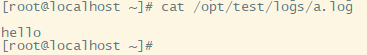

It can be seen that , An update to the log file has been detected , The updated content will be read immediately , And output to the console .
2.4 Custom field , Define the logs to be collected tab Tags are used to distinguish where they come from
filebeat.inputs:
- type: log
enabled: true
paths:
- /opt/test/logs/*.log
tags: ["fl-carloan-web"] # Add custom tag, For subsequent processing
fields: # Add custom fields , Explain where the log comes from
from: fl-carloan-web
fields_under_root: true #true To add to the root node ,false To add to child nodes
setup.template.settings:
index.number_of_shards: 3
output.console:
pretty: true
enable: true


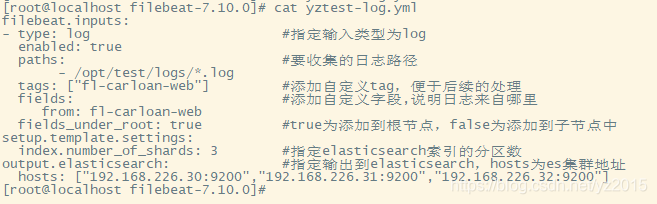
2.5 Output to Elasticsearch vim yztest-log.yml
- type: log # The input type is log
enabled: true
paths: # Log path to collect
- /opt/test/logs/*.log
tags: ["fl-carloan-web"] # Add custom tag, For subsequent processing
fields: # Add custom fields , Explain where the log comes from
from: fl-carloan-web
fields_under_root: true #true To add to the root node ,false To add to child nodes
setup.template.settings:
index.number_of_shards: 3 # Appoint elasticsearch Number of partitions in the index
setup.template.pattern: "filebeat-*"
hosts: ["192.168.226.30:9200","192.168.226.31:9200","192.168.226.32:9200"]


2.6 FileBeat working principle
Filebeat It consists of two main components :prospector( Prospector ) and harvester( harvester ).
harvester:
Responsible for reading the contents of a single file .
If the file is deleted or renamed while reading ,Filebeat Will continue to read the file .
prospector:
prospector Responsible for managing the harvester And find the source of all the files to read .
If the input type is log , The finder will find all the files that match the path , And start one for each file harvester.
Filebeat There are currently two kinds of prospector type :log and stdin.
Filebeat How to keep the status of the file ( Namely Filebeat Where to start reading after downtime ):
Filebeat Save the status of each file and often refresh the status to the registration file on disk ( The file status is recorded in filebeat-7.10.0/data/registry/filebeat/log.json In file ).
This state is used to remember harvester The last offset being read , And make sure all log lines are sent .
If the output ( for example Elasticsearch or Logstash) cannot access ,Filebeat Will track the last line sent , And continue to read the file when the output is available again .
stay Filebeat Runtime , Every prospector The file status information will also be saved in memory , When rebooting Filebeat when , The data of the registration file will be used to rebuild the file state ,Filebeat Each one harvester Continue reading from the last offset saved .
cat log.json Record the read log file and the last offset

Start command :
2.7 Read Nginx Log files ,filebeat Integrate nginx Do a test
Brief introduction Nginx Log analysis system
1.1、 Project requirements
Nginx It's a very good web The server , Often nginx The service will serve as the access portal to the project , that ,nginx It is very important to ensure the performance of the system , If nginx Problems in the operation of the project will have a greater impact on the project , therefore , We need to be right about nginx There are monitoring measures for the operation of , Master in real time nginx Operating condition , Then it needs to be collected nginx Operation index and analysis of nginx The running log of .
1.2、 The business process
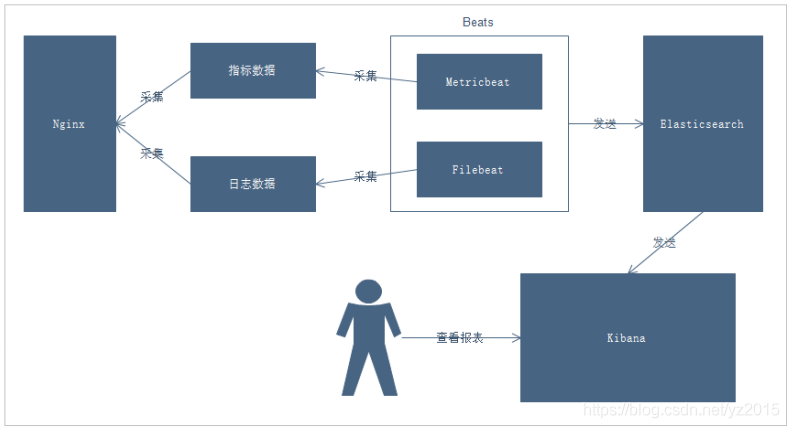
explain :
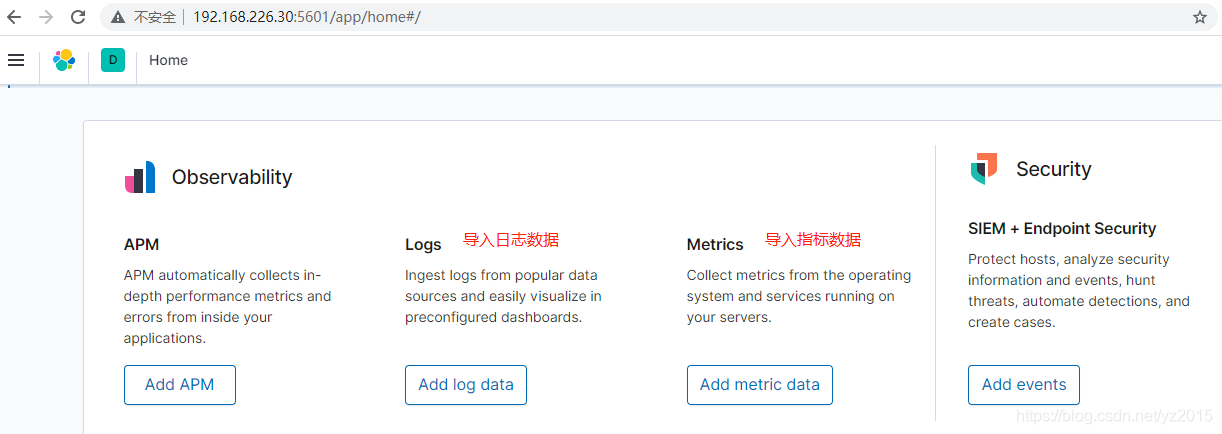
1. adopt Beats collection Nginx Index data and log data of
2. Beats Collect the data and send it to Elasticsearch in
3. Kibana Read data for analysis
4. User pass Kibana To view the analysis report


filebeat Read nginx Log files
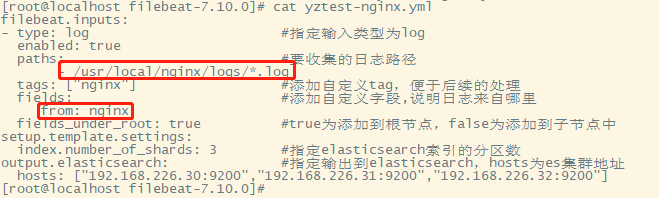
# Writing configuration files cd /opt/filebeat-7.10.0/ vim yztest-nginx.yml
- type: log
enabled: true
paths:
- /usr/local/nginx/logs/*.log
tags: ["nginx"]
setup.template.settings:
index.number_of_shards: 3 # Appoint ES Number of partitions in the index
output.elasticsearch: # Appoint ES Configuration of
hosts: ["192.168.226.30:9200","192.168.226.31:9200","192.168.226.32:9200"]
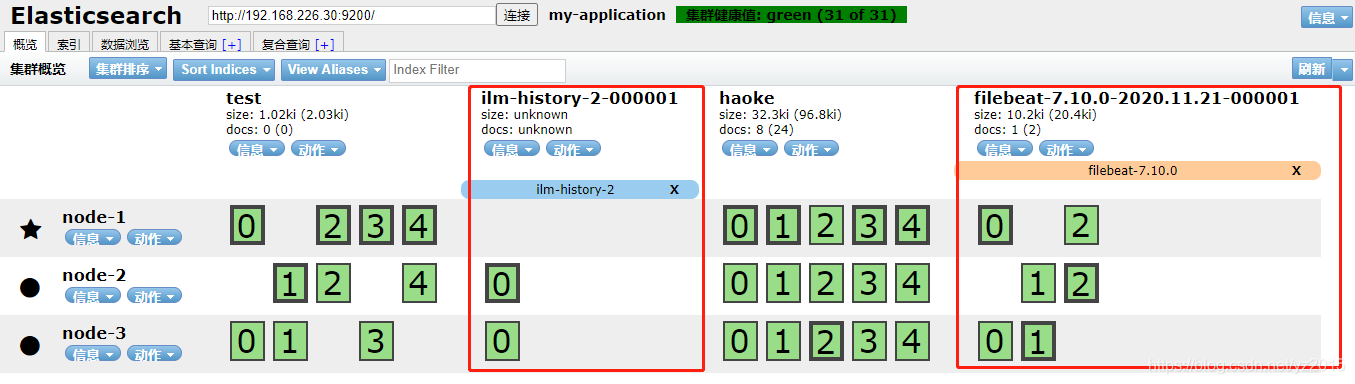

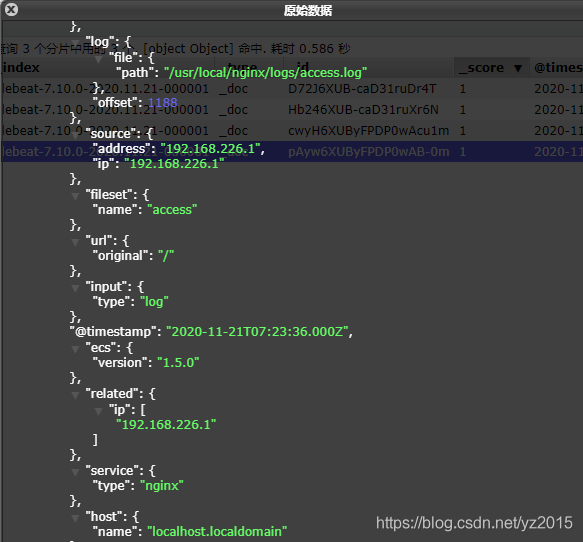
You can see , stay message We've got nginx Log , however , The content is not processed , Just read the original data , So it's not good for our later operation , You can use the built-in module Let's deal with it .
2.8 Module
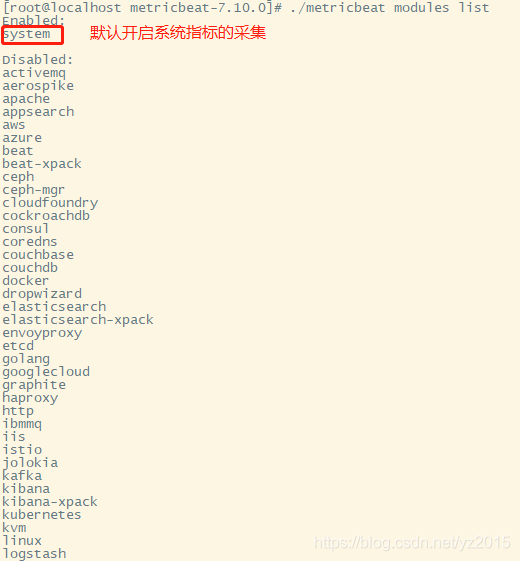
In front, you want to read and process the log data manually , Such as manual parsing message The contents of a string . Actually , stay Filebeat in , A large number of Module( Use module analysis message character string , Like tools ), Can simplify our configuration , You can use it directly , as follows : command ./filebeat modules list

./filebeat modules disable nginx # Ban

cd modules.d/ ll see


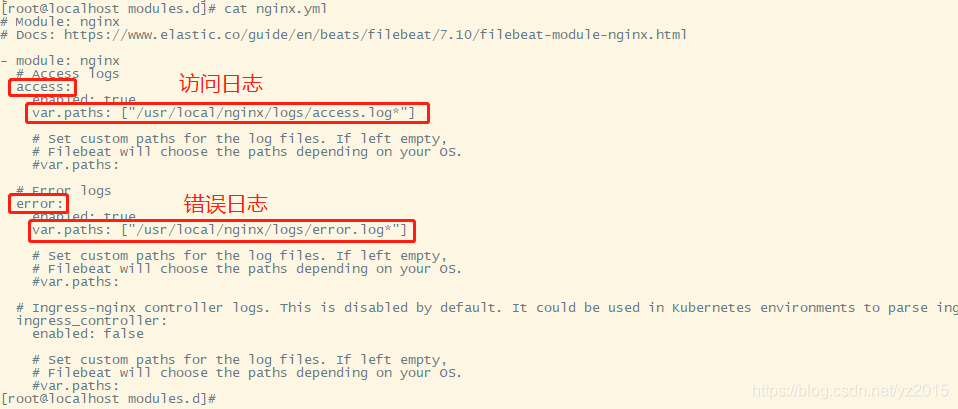
vim nginx.yml
- module: nginx
# Access logs
access:
enabled: true
var.paths: ["/usr/local/nginx/logs/access.log*"] # The log ends by day
# Error logs
error:
enabled: true
var.paths: ["/usr/local/nginx/logs/error.log*"] # The log ends by day
filebeat.inputs:
tags: ["nginx"] # Add custom tag, For subsequent processing
fields: # Add custom fields , Explain where the log comes from
from: nginx
fields_under_root: true #true To add to the root node ,false To add to child nodes
setup.template.settings:
index.number_of_shards: 3 # Appoint elasticsearch Number of partitions in the index
output.elasticsearch: # Specify output to elasticsearch,hosts by es The cluster address
hosts: ["192.168.226.30:9200","192.168.226.31:9200","192.168.226.32:9200"]
filebeat.config.modules:
path: ${path.config}/modules.d/*.yml
reload.enabled: false
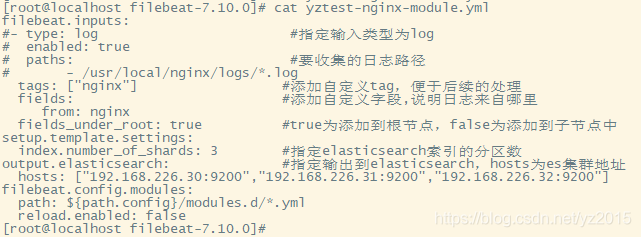
start-up ./filebeat -e -c yztest-nginx-module.yml
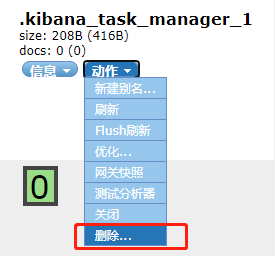
If there is an error , Solve it in the following way , There is no error when starting here .
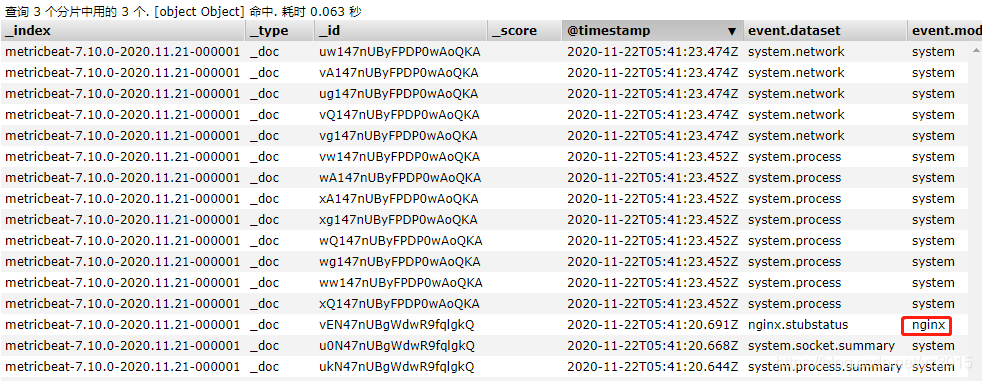
How many requests nginx, Give Way filebeat Read nginx Log file information and refresh to elasticsearch in , stay elasticsearch You can see , Use nginx-modul after , The returned information is a little thinner than the previous disassembly .

Mainly collect data of indicators
Collect index data of operating system or application service regularly
Store in Elasticsearch in , Real time analysis
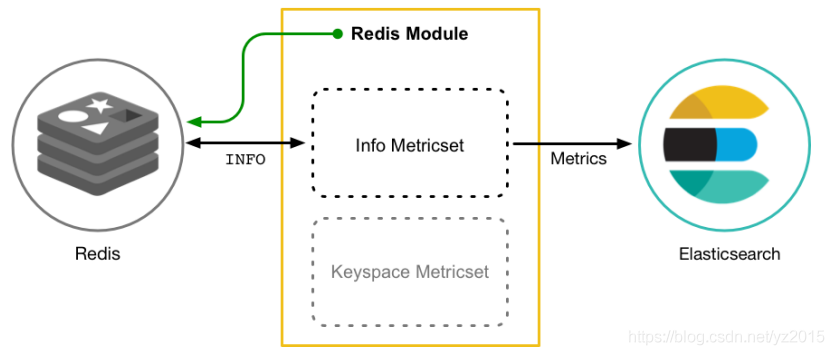
Metricbeat Yes 2 Part of it is made up of , Part of it is Module, The other part is Metricset.
Module: Collected objects , Such as :mysql、redis、nginx、 Operating system, etc ;
Metricset: Collect a collection of indicators , Such as :cpu、memory( Memory )、network( The Internet ) etc. ;
1. tar -zxvf metricbeat-7.10.0-linux-x86_64.tar.gz -C /opt/ mv metricbeat-7.10.0-linux-x86_64/ metricbeat-7.10.0
2. cd metricbeat-7.10.0
3. vim metricbeat.yml Modify only elasticsearch Output path , The rest remains the same ,es The number of slices can be changed, but not changed :
hosts: ["192.168.226.30:9200","192.168.226.31:9200","192.168.226.32:9200"]

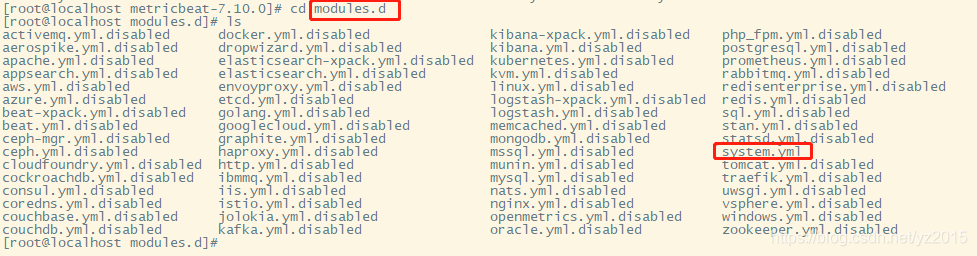
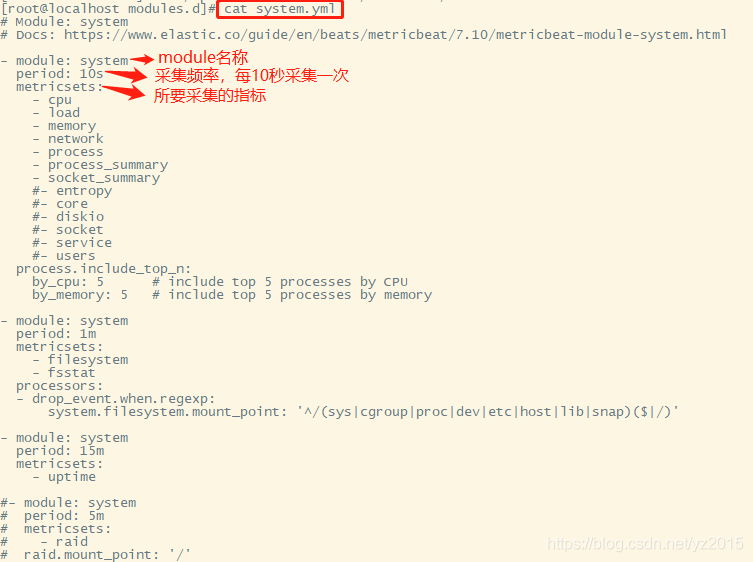
By default, the system indicator collection is on :

stay nginx in , Need to turn on status query , To query the index data
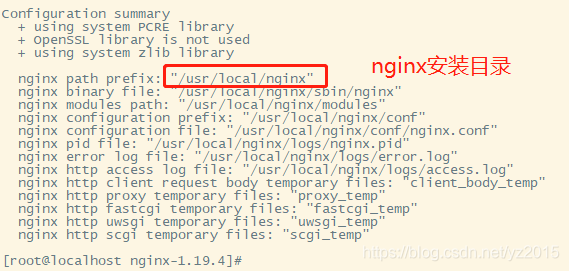
# recompile nginx
cd /opt/nginx-1.19.4/ perform : ./configure --prefix=/opt/context/nginx --with-http_ssl_module --with-http_stub_status_module
Execute first :make In execution :make install
cd /usr/local/nginx/sbin perform : ./nginx -V # Query version information nginx Status module installed 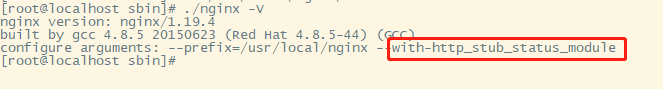
# To configure nginx
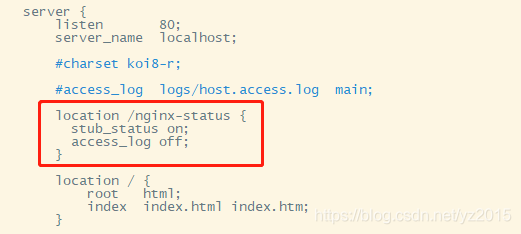
cd /usr/local/nginx/conf vim nginx.conf add to :
location /nginx-status {
stub_status on;
access_log off;
}
restart nginx : cd /usr/local/nginx/sbin/ perform : ./nginx -s reload ( If the order is not easy to use , Just stop nginx: ./nginx -s stop Start up ./nginx)
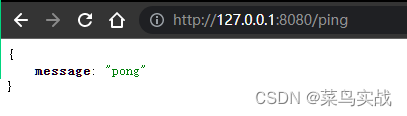
Access the just configured /nginx-status

The result shows that :
Active connections: Number of active connections being processed
server accepts handled requests
first server Express Nginx It's been started up until now 15 A connection
the second accepts Express Nginx It has been successfully created up to now 15 The second handshake
Third handled requests In total, we have dealt with 23 Requests
Number of requests lost = The number of handshakes - The number of connections , As you can see, no requests have been lost so far
Reading: 0 Writing: 1 Waiting: 1
Reading:Nginx Read... To the client Header Number of messages
Writing:Nginx Return to the client Header Number of messages
Waiting:Nginx Finished processing resident link waiting for next request instruction ( Turn on keep-alive Under the circumstances , This value is equal to Active - (Reading+Writing)
- module: nginx
#metricsets:
# - stubstatus
period: 10s
# Nginx hosts
#hosts: ["http://127.0.0.1"]
hosts: ["http://192.168.226.30"]
# Path to server status. Default server-status
#server_status_path: "server-status"
server_status_path: "nginx-status"
#username: "user"
#password: "secret"

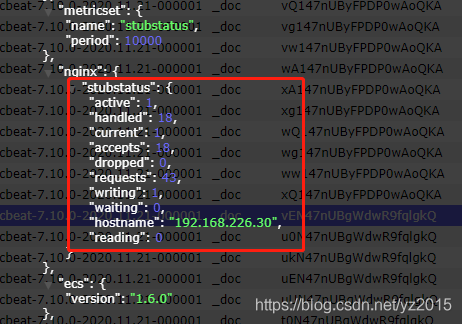

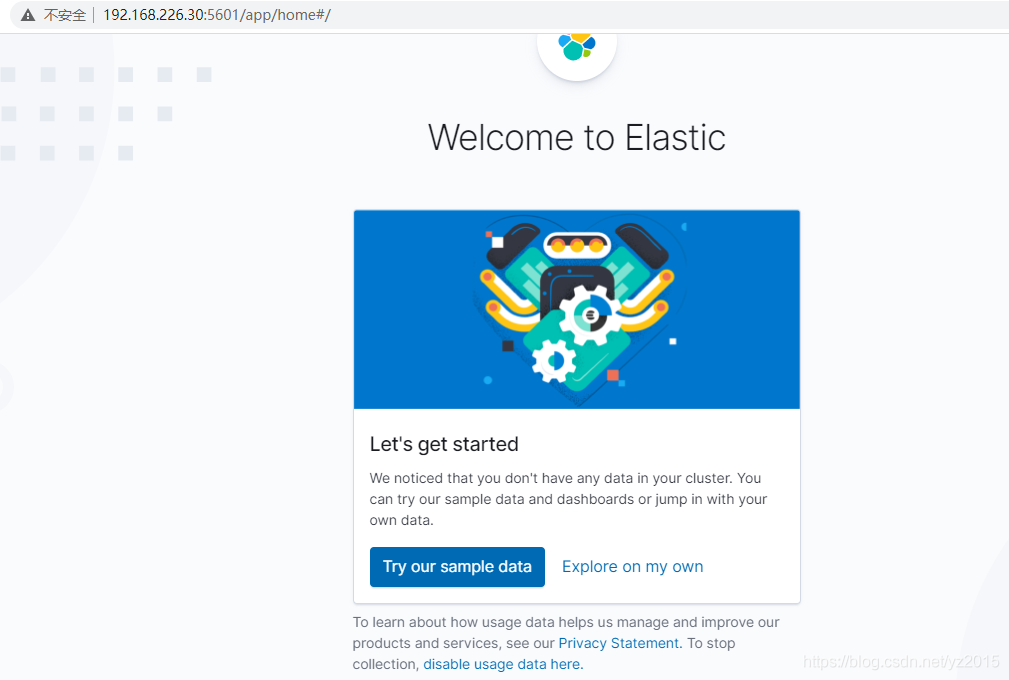
Kibana Is an open source data analysis and visualization platform , It is Elastic Stack One of the members , Designed for and Elasticsearch Collaboration . You can use Kibana Yes Elasticsearch Search the data in the index 、 see 、 interactions . You can easily use charts 、 Tables and maps provide diversified analysis and presentation of data .
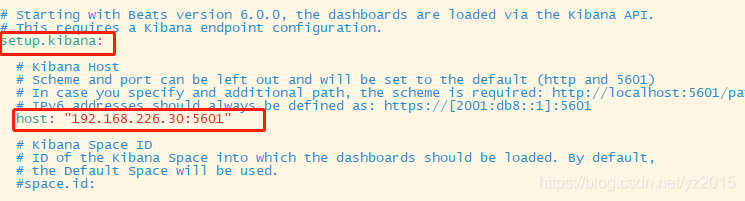
4.1 configuration setup

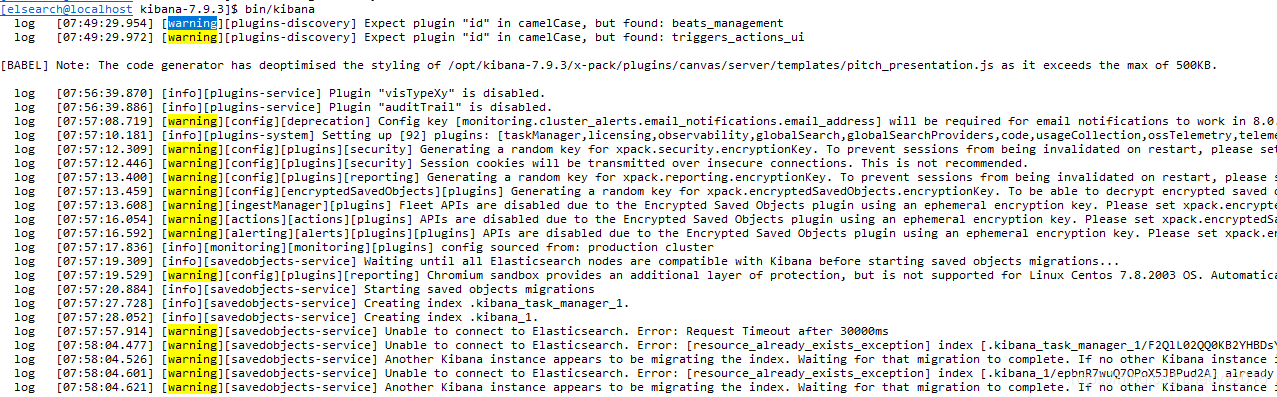
xpack.security.encryptionKey: "something_at_least_32_characters" # arbitrarily 32 A string
xpack.reporting.encryptionKey: "something_at_least_32_characters" # arbitrarily 32 A string
xpack.encryptedSavedObjects.encryptionKey: "something_at_least_32_characters" # arbitrarily 32 A string
xpack.reporting.capture.browser.chromium.disableSandbox: false # Turn off the sandbox

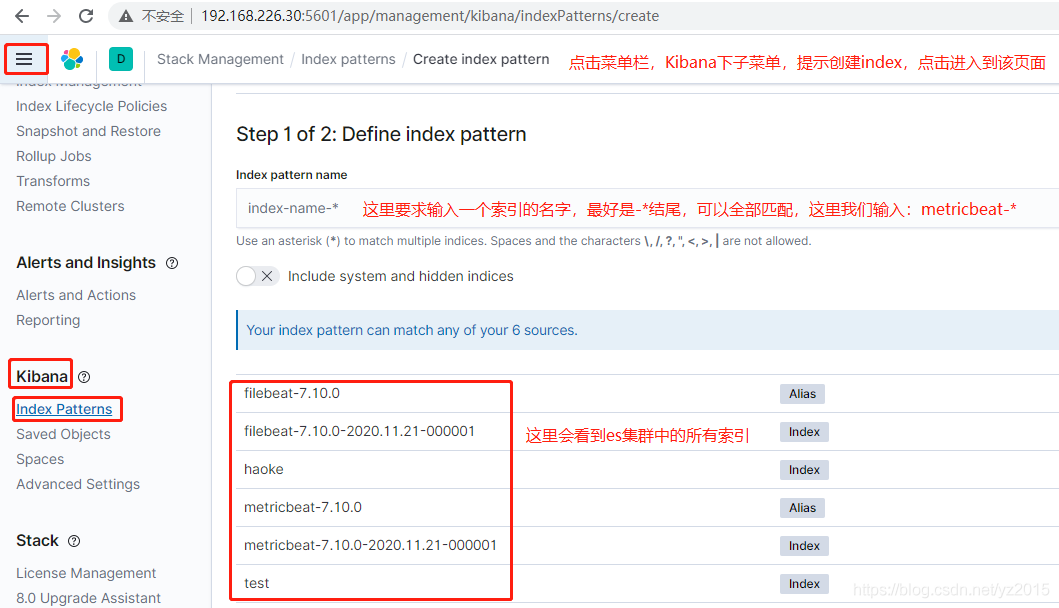

After creating the index , After a while, you can see the data of performance indicators on the dashboard :
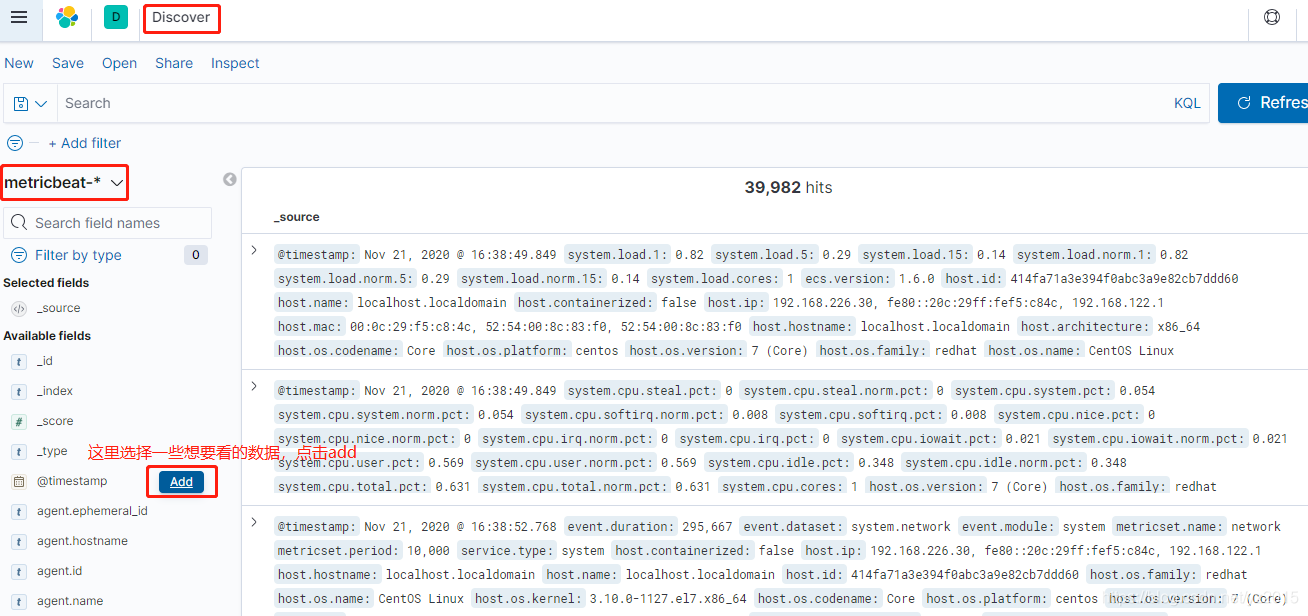
I added a few casually , That's too much , Here is the will es An operation of data visualization in


Re metricbeat Run up : ./metricbeat -e Let it constantly generate data .
stay kibana Click on the dashboard

These are the newly installed instrument panels

find [Metricbeat System] Host Services Overview , Click in to see some data information of the system
边栏推荐
- In depth analysis of how the JVM executes Hello World
- Jd.com interviewer asked: what is the difference between using on or where in the left join association table and conditions
- [staff] the lines and spaces of the staff (the nth line and the nth space in the staff | the plus N line and the plus N space on the staff | the plus N line and the plus N space below the staff | the
- Redis安装部署(Windows/Linux)
- Knife4j 2.X版本文件上传无选择文件控件问题解决
- AMQ6126问题解决思路
- 微服务实战|原生态实现服务的发现与调用
- 深入剖析JVM是如何执行Hello World的
- What is the future value of fluorite mine of karaqin Xinbao Mining Co., Ltd. under zhongang mining?
- How to realize asynchronous programming in a synchronous way?
猜你喜欢

A detailed explanation takes you to reproduce the statistical learning method again -- Chapter 2, perceptron model

Number structure (C language -- code with comments) -- Chapter 2, linear table (updated version)
【Go实战基础】如何安装和使用 gin

C4D quick start tutorial - Chamfer
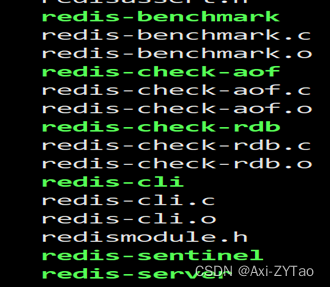
Redis安装部署(Windows/Linux)
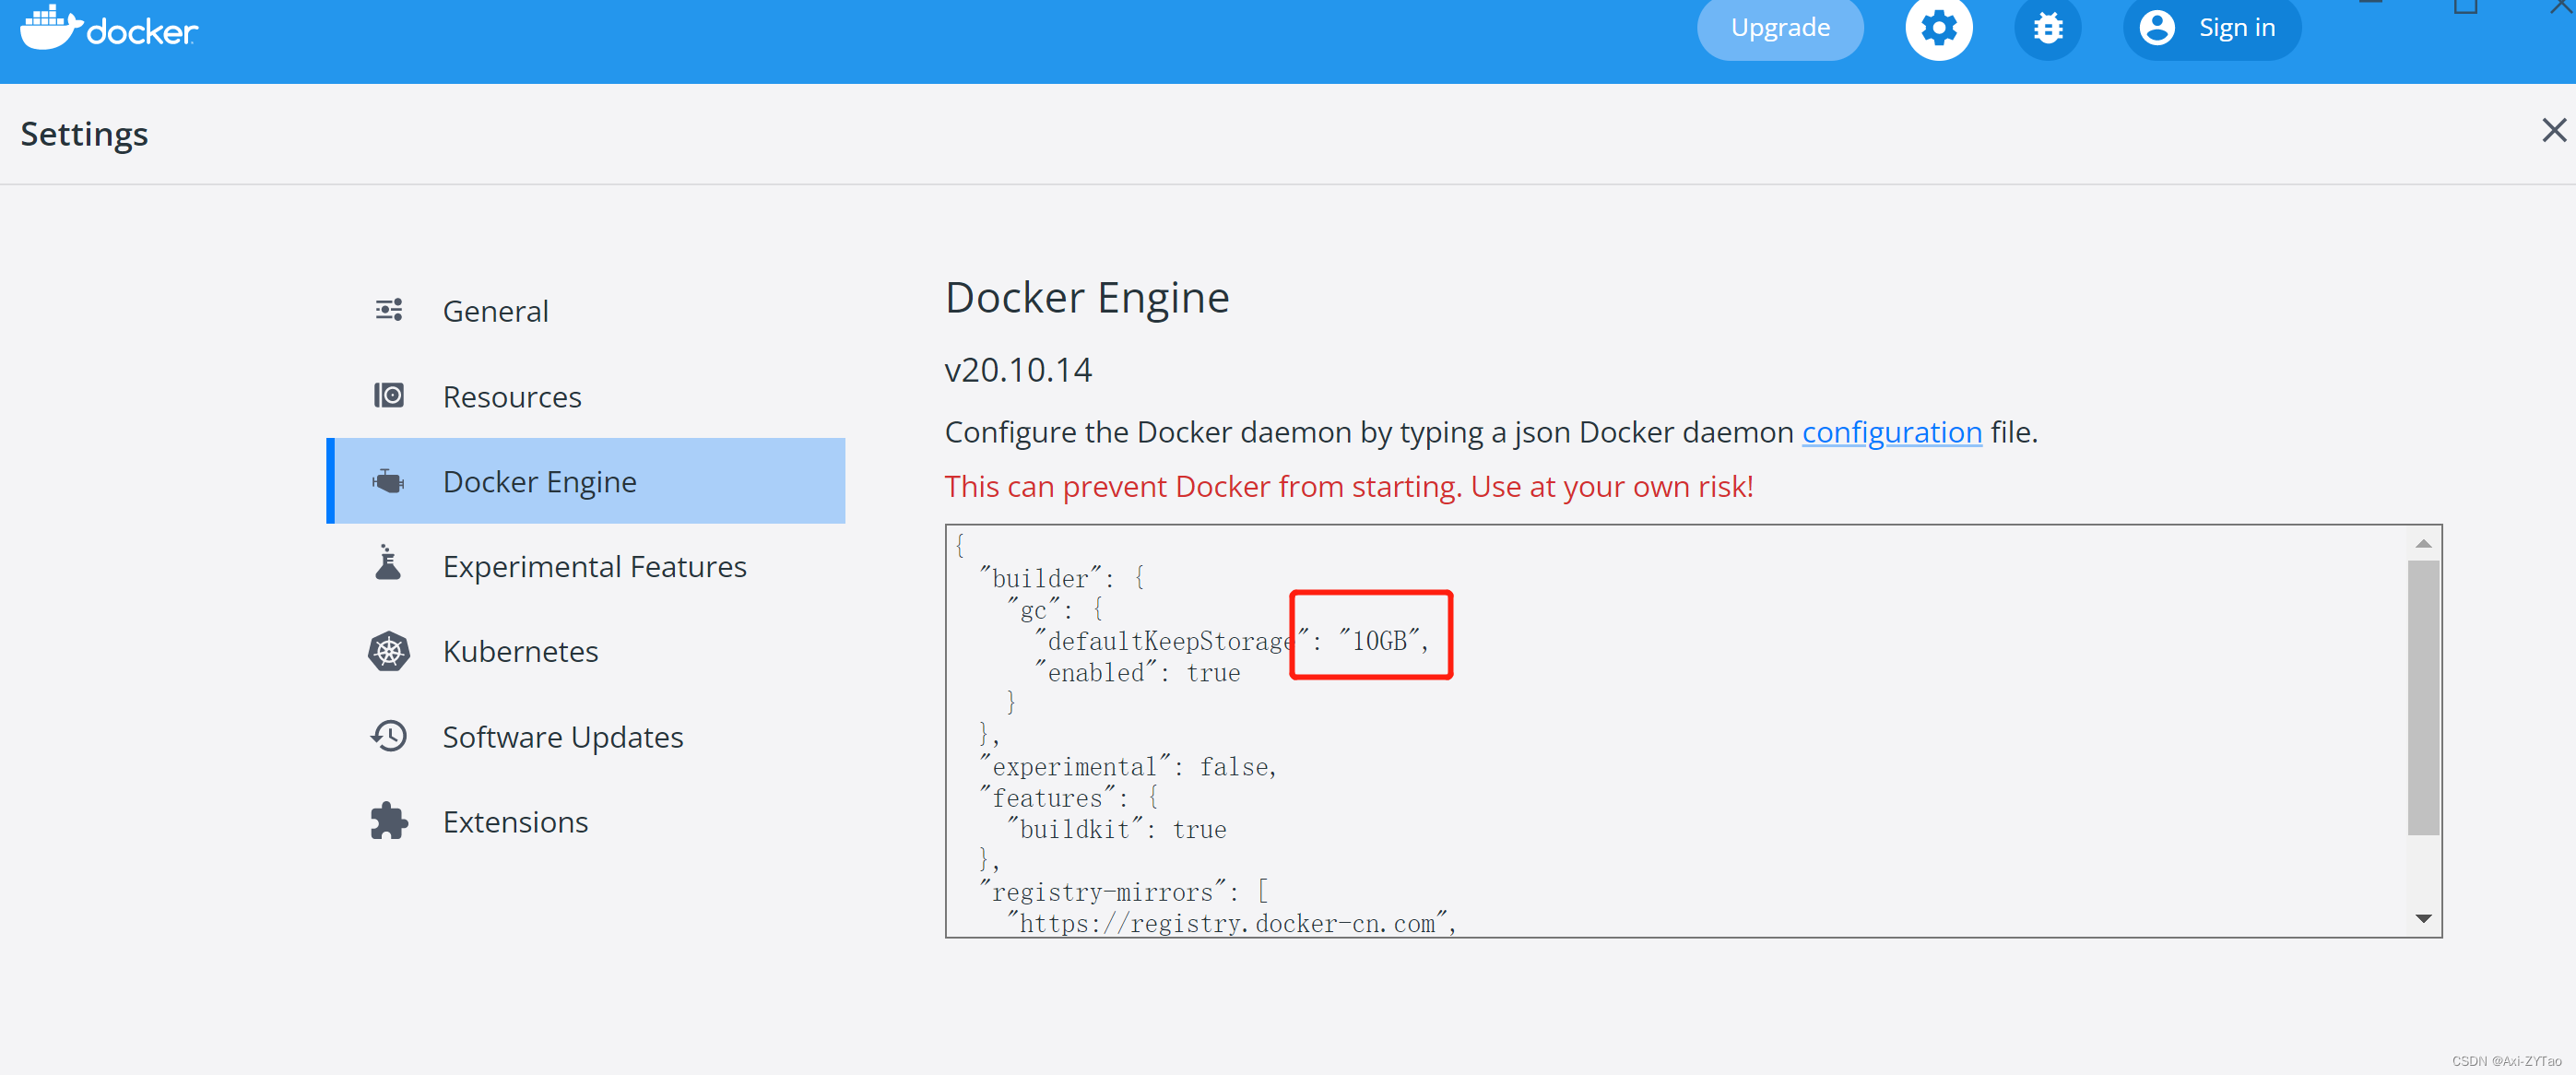
win10使用docker拉取redis镜像报错read-only file system: unknown

企业级SaaS CRM实现

【Go实战基础】gin 如何验证请求参数
盘点典型错误之TypeError: X() got multiple values for argument ‘Y‘

京东面试官问:LEFT JOIN关联表中用ON还是WHERE跟条件有什么区别
随机推荐
一篇详解带你再次重现《统计学习方法》——第二章、感知机模型
Avoid breaking changes caused by modifying constructor input parameters
Programmers with ten years of development experience tell you, what core competitiveness do you lack?
Chrome浏览器标签管理插件–OneTab
队列管理器running状态下无法查看通道
Matplotlib剑客行——容纳百川的艺术家教程
Matplotlib剑客行——没有工具用代码也能画图的造型师
Redis安装部署(Windows/Linux)
Microservice practice | fuse hytrix initial experience
"Redis source code series" learning and thinking about source code reading
Cartoon rendering - average normal stroke
Matplotlib剑客行——初相识Matplotlib
Elastic Stack之Beats(Filebeat、Metricbeat)、Kibana、Logstash教程
微服务实战|负载均衡组件及源码分析
[go practical basis] how to bind and use URL parameters in gin
Mysql 多列IN操作
京东高级工程师开发十年,编写出:“亿级流量网站架构核心技术”
JVM instruction mnemonic
微服务实战|手把手教你开发负载均衡组件
分布式服务架构精讲pdf文档:原理+设计+实战,(收藏再看)