当前位置:网站首页>Gee: explore the change of water area in the North Canal basin over the past 30 years [year by year]
Gee: explore the change of water area in the North Canal basin over the past 30 years [year by year]
2022-07-02 05:11:00 【Gee water ecological space】
Catalog
Preface
Use GEE Analyze the change characteristics of water area in the basin , Take the North Canal basin as an example
For the same area analysis, see :
GEE: Reclassification of land use in the North Canal basin
The analysis area is as follows :
One 、 Analysis steps
Main analysis steps :
Two 、python Code
1、 Load watershed range
python The code is as follows
#  Add display underlay , Select Gaode map
Map = geemap.Map()
Map.add_basemap('HYBRID')

#  Import watershed range
basin_shp = '../world_basins/byh.shp'
basin_bj = geemap.shp_to_ee(basin_shp)
roi = basin_bj.geometry()
#  Add display
Map.addLayer(ee.Image().paint(roi, 0, 2), {
    'palette':'red'}, 'roi')
Map.centerObject(basin_bj)
Map
give the result as follows :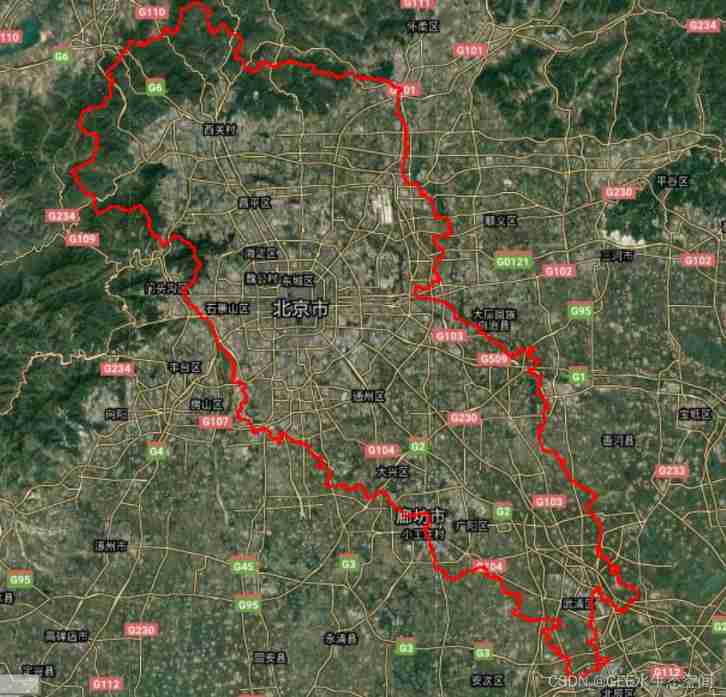
2、 Image capture and synthesis
- geemap.landsat_timeseries()
python The code is as follows :
#  Import image data , Annual synthesis
images = geemap.landsat_timeseries(roi=roi,
                                    start_year=1984,
                                    end_year=2020,
                                    start_date='01-01',
                                    end_date='12-31')
#  Check the image band
first = images.first()
first.bandNames().getInfo()
# ['Blue', 'Green', 'Red', 'NIR', 'SWIR1', 'SWIR2', 'pixel_qa', 'NBR']
#  Add display
Map.addLayer(first, {
    'bands':['SWIR2', 'SWIR1', 'Green'], 'min':0, 'max':3000}, 'first image')
give the result as follows :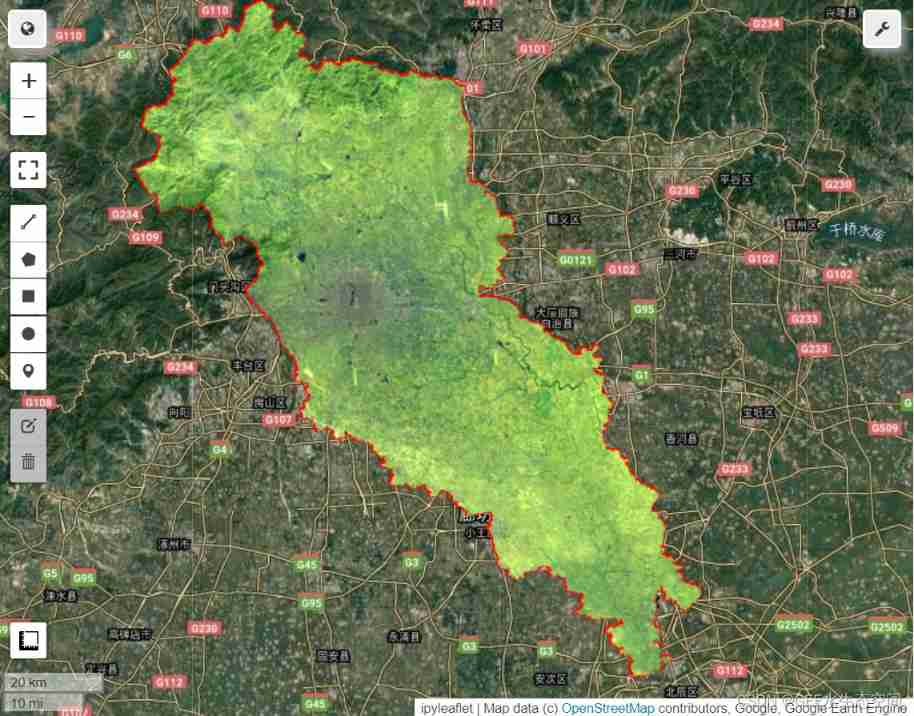
3、NDWI Calculation and water surface extraction
normalizedDifference()
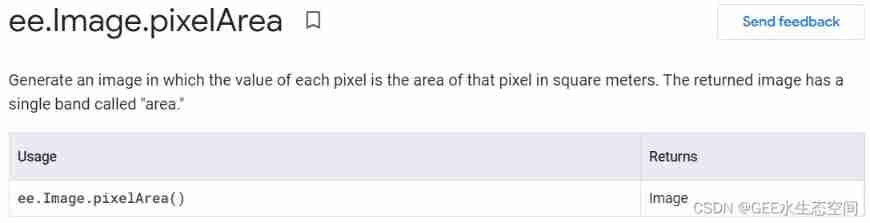
ee.Image.pixelArea()
 - ee.Image.reduceRegion()
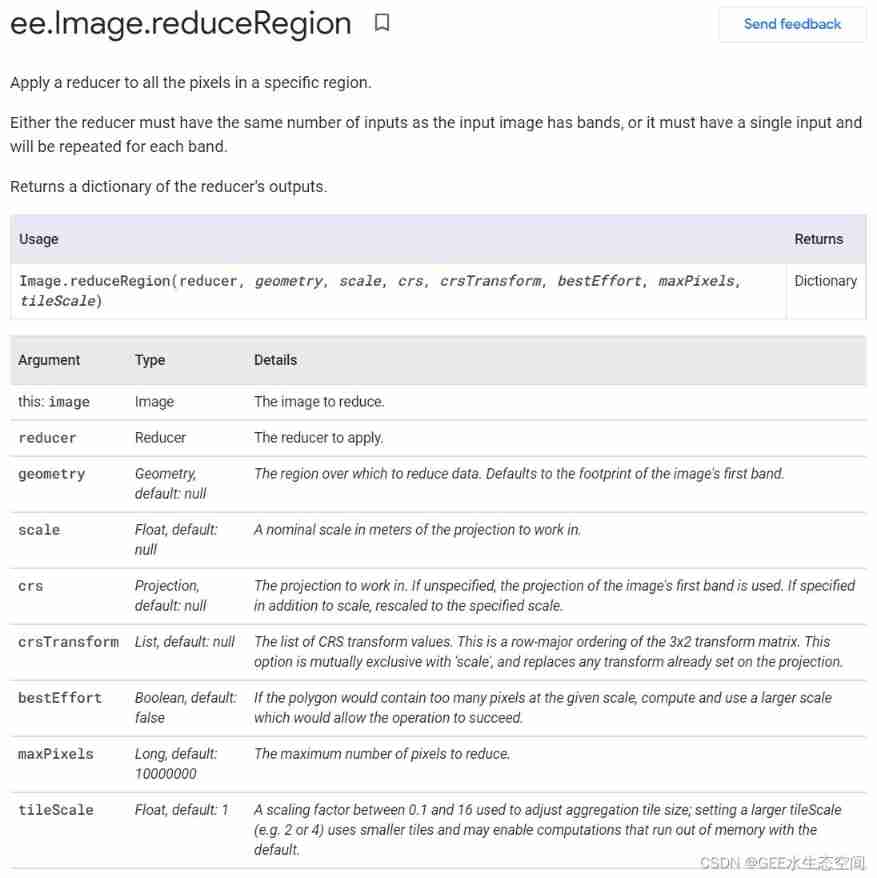
python The code is as follows :
def ndwi_cac(image):
    ndwi_image = image.normalizedDifference(['Green', 'SWIR1']).rename('ndwi')
    return ndwi_image.gt(0).selfMask()

#  Get water surface
ndwi_water = images.map(ndwi_cac)
Map.addLayer(ndwi_water.first(), {
    'palette':'blue'}, 'first water')

#  Calculate the water surface area , The unit is according to km2 meter
def cal_area(image):
    pixel_area = image.multiply(ee.Image.pixelArea()).divide(1e6)
    img_area = pixel_area.reduceRegion(**{

        'reducer':ee.Reducer.sum(),
        'geometry':roi,
        'scale':30,
        'maxPixels':1e13
    })
    return image.set({
    'water_area':img_area})

water_areas = ndwi_water.map(cal_area)
water_stats = water_areas.aggregate_array('water_area').getInfo()
water_stats
give the result as follows :
[{‘ndwi’: 35.52171285398048},
{‘ndwi’: 49.82769552462259},
{‘ndwi’: 95.52709095289183},
{‘ndwi’: 88.0812142082916},
{‘ndwi’: 93.93069886911051},
{‘ndwi’: 80.60827039904903},
{‘ndwi’: 136.78296227087307},
{‘ndwi’: 108.33794441999756},
{‘ndwi’: 171.22477916253243},
{‘ndwi’: 127.52933278774321},
{‘ndwi’: 86.3748384304267},
{‘ndwi’: 112.22821871601487},
{‘ndwi’: 101.4823960050295},
{‘ndwi’: 89.49672596974511},
{‘ndwi’: 295.2877416742835},
{‘ndwi’: 80.7449547841241},
{‘ndwi’: 120.11593294853824},
{‘ndwi’: 134.62668476349447},
{‘ndwi’: 149.84151247550966},
{‘ndwi’: 236.29430841558016},
{‘ndwi’: 158.22021181601244},
{‘ndwi’: 70.20089856972656},
{‘ndwi’: 97.93744088662496},
{‘ndwi’: 108.04200576387466},
{‘ndwi’: 107.22519927537127},
{‘ndwi’: 63.4901824073373},
{‘ndwi’: 85.06409974042677},
{‘ndwi’: 74.55227930805393},
{‘ndwi’: 221.75472506976308},
{‘ndwi’: 85.00424085790755},
{‘ndwi’: 60.99660440626263},
{‘ndwi’: 68.4423834487381},
{‘ndwi’: 67.66773335986407},
{‘ndwi’: 84.48483915371168},
{‘ndwi’: 76.99267855924732},
{‘ndwi’: 58.5695615691552},
{‘ndwi’: 87.93523549212745}]
4、 Statistical analysis
python The code is as follows :
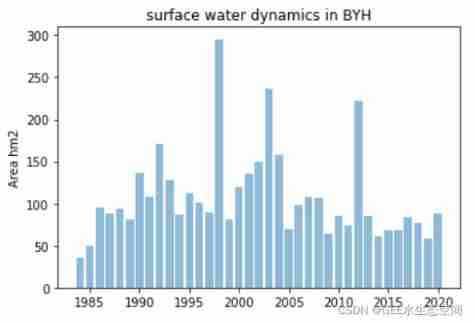
#  Time series change histogram shows
import matplotlib.pyplot as plt

x = list(range(1984, 2021))
y = [item.get('ndwi') for item in water_stats]

plt.bar(x, y, align='center', alpha=0.5)
plt.ylabel('Area hm2')
plt.title('surface water dynamics in BYH')
plt.show()
3、 ... and 、 comparative analysis
It is proposed to adopt JRC The data directly analyzes the changes of water surface , Its python The code is as follows :
【 To be analyzed ...】
give the result as follows :
Comparison and analysis of the difference between the two calculation results :
- It can be seen that ,
Four 、 Summary and discussion
- The characteristics of long-time series water surface changes in the North Canal basin are analyzed
- Problems to be explored , Water surface changes in different zones can be considered , Spatial and temporal changes of water surface in different administrative regions or upstream and downstream areas of the basin
Reference resources :
- https://geemap.org/notebooks/tn_surface_water/
- https://developers.google.com/earth-engine/apidocs/ee-image-pixelarea?hl=en
边栏推荐
- Leetcode 18 problem [sum of four numbers] recursive solution
- ansible安装与使用
- Fabric.js IText设置指定文字的颜色和背景色
- Differential identities (help find mean, variance, and other moments)
- Video cover image setting, put cover images into multiple videos in the simplest way
- Splice characters in {{}}
- Basic differences between Oracle and MySQL (entry level)
- Summary of MySQL key challenges (2)
- 10 minute quick start UI automation ----- puppeter
- Fabric.js 渐变
猜你喜欢

Fabric.js 右键菜单
Pytest learning ----- pytest Interface Association framework encapsulation of interface automation testing
![[Yu Yue education] autumn 2021 reference materials of Tongji University](/img/50/5136359b89a5d047fe648637643ad0.jpg)
[Yu Yue education] autumn 2021 reference materials of Tongji University
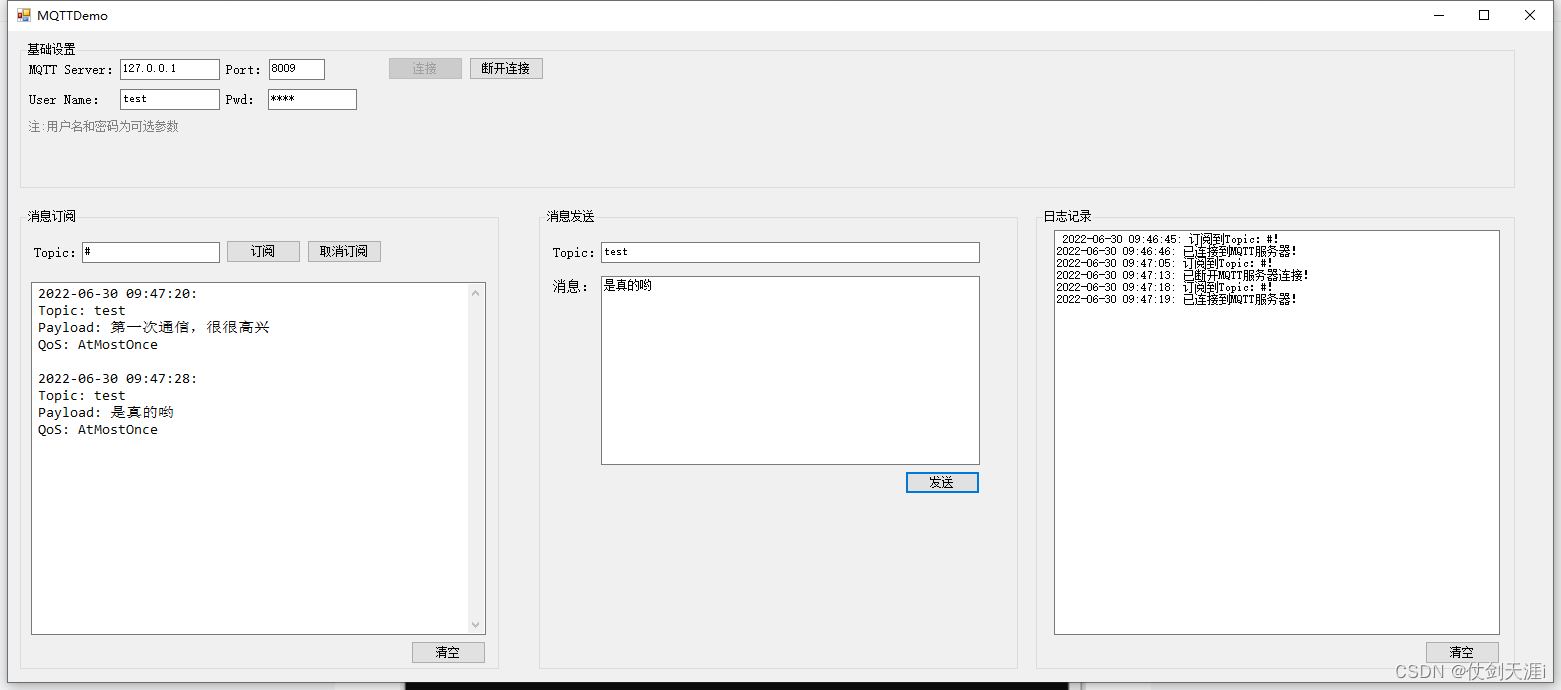
C case of communication between server and client based on mqttnet
关于Steam 教育的知识整理
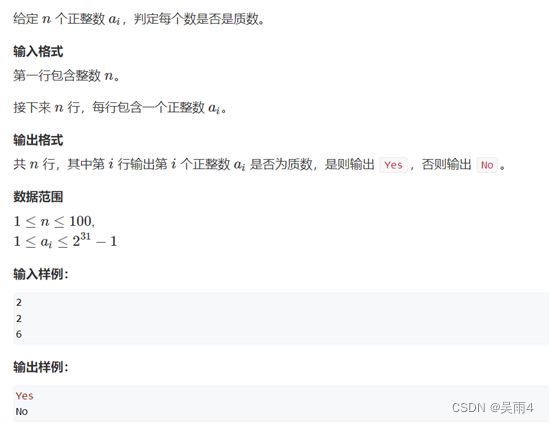
数学问题(数论)试除法做质数的判断、分解质因数,筛质数
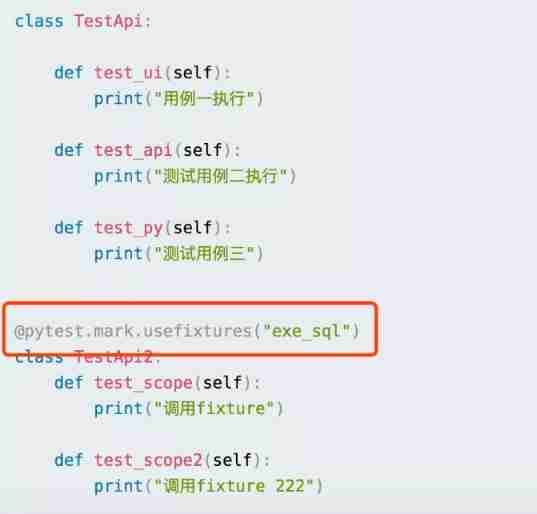
Getting started with pytest -- description of fixture parameters
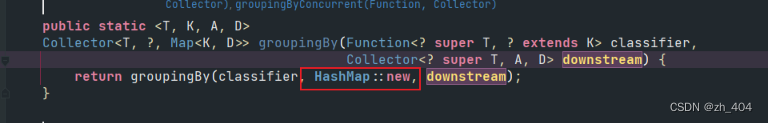
Collectors. Groupingby sort
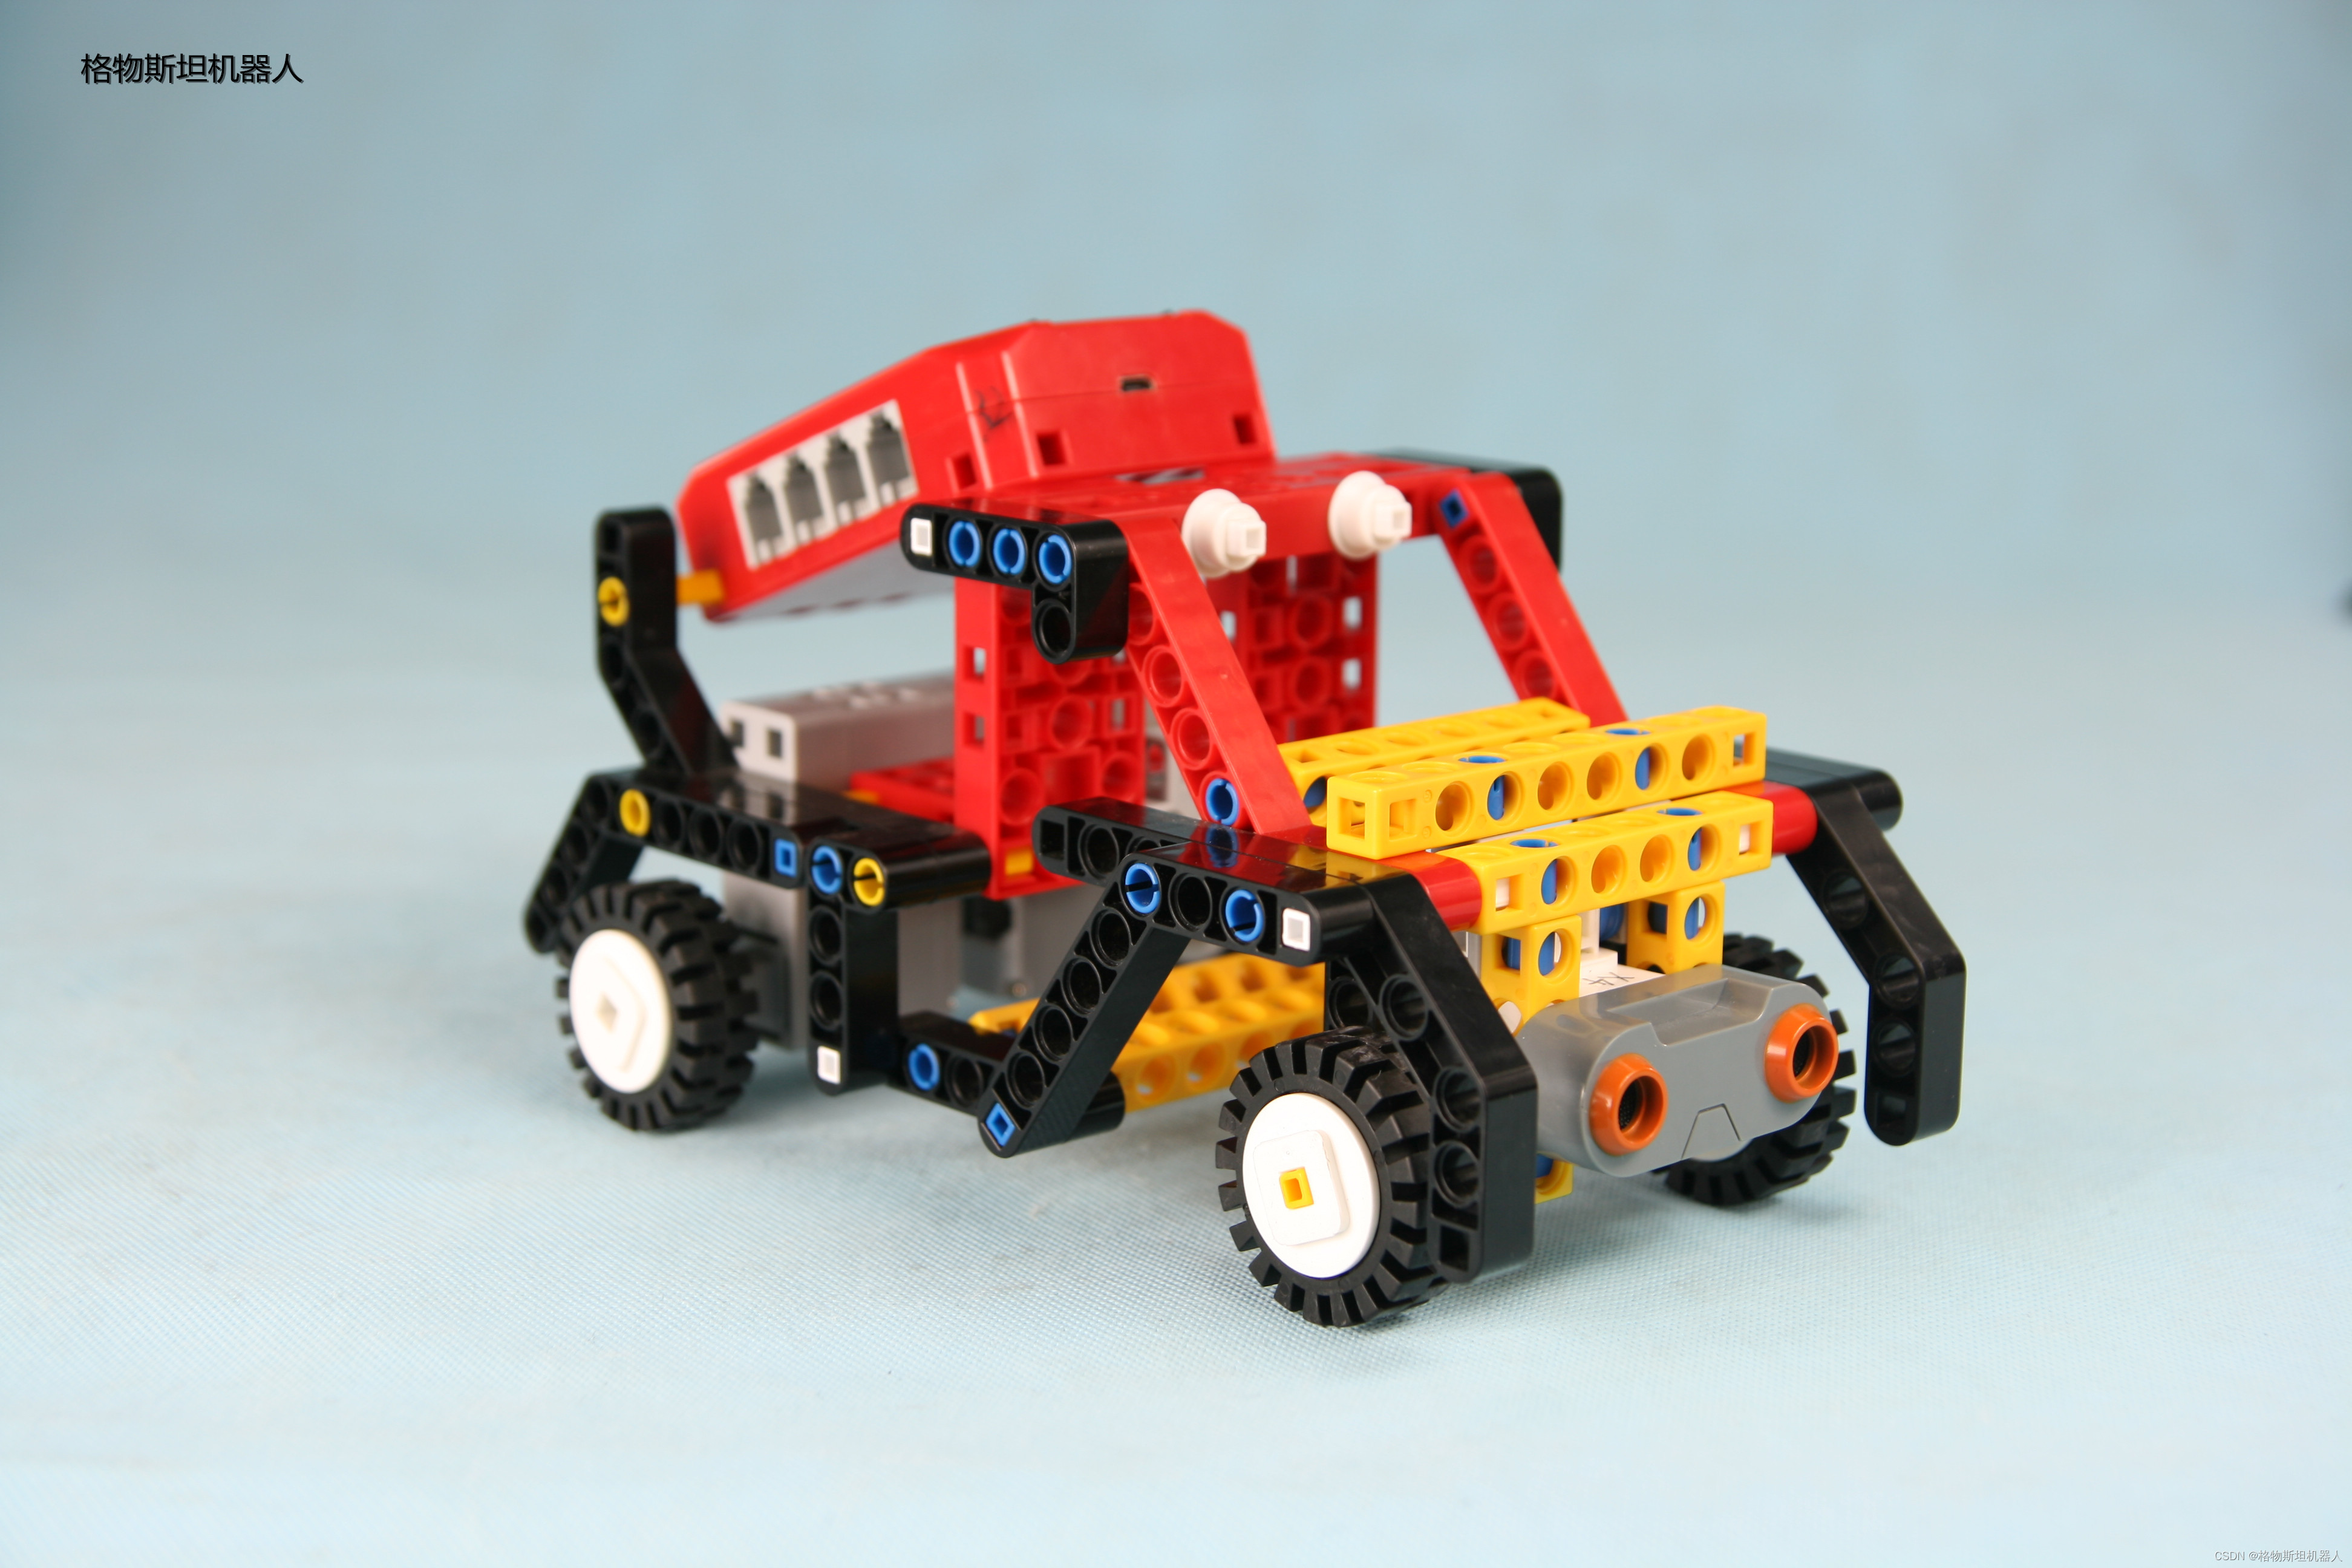
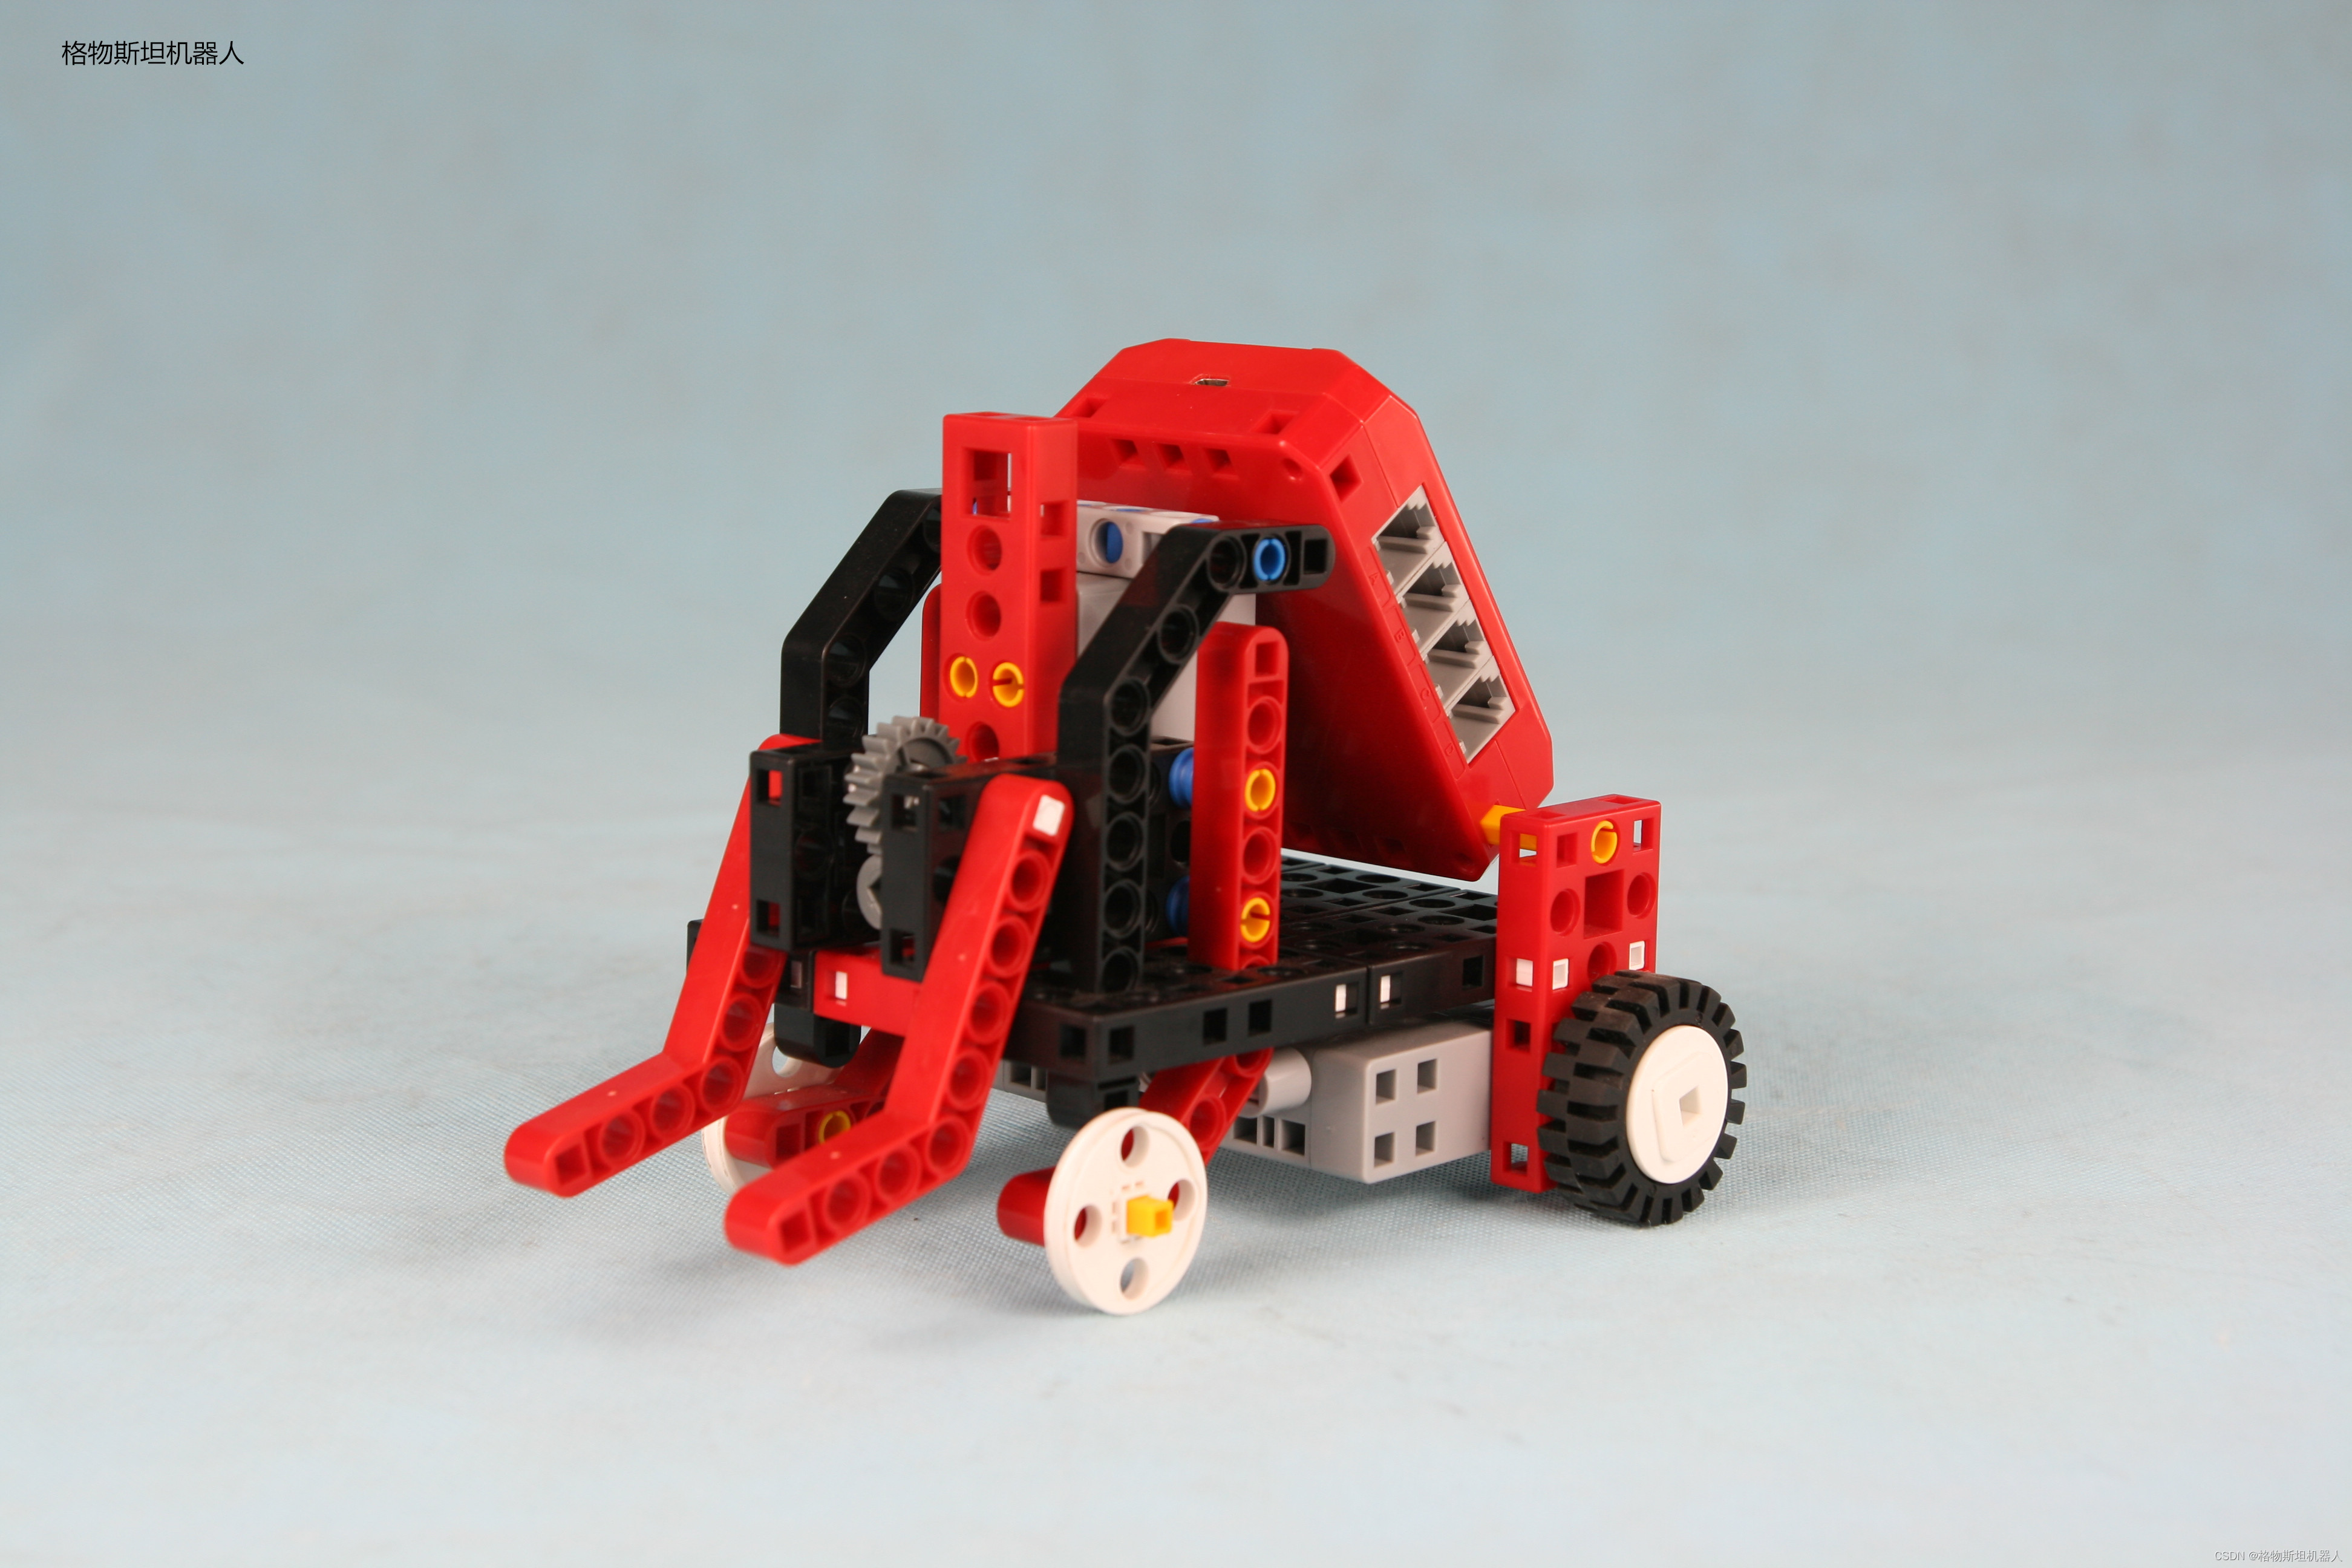
Application of intelligent robot in agricultural ecology
农业生态领域智能机器人的应用
随机推荐
LS1046nfs挂载文件系统
Differential identities (help find mean, variance, and other moments)
go实现leetcode旋转数组
Simple and practical accounting software, so that accounts can be checked
[quick view opencv] familiar with CV matrix operation with image splicing examples (3)
Video multiple effects production, fade in effect and border background are added at the same time
Mouse events in JS
Set the default style of scroll bar Google browser
C# 图片显示占用问题
Briefly introduce chown command
C# 基于MQTTNet的服务端与客户端通信案例
Dark horse notes -- Set Series Collection
运维工作的“本手、妙手、俗手”
Paddlepaddle project source code
7.1 Résumé du concours de simulation
Feign realizes file uploading and downloading
Map in JS (including leetcode examples)
Lay the foundation for children's programming to become a basic discipline
Application d'un robot intelligent dans le domaine de l'agroécologie
Fabric.js 自由绘制矩形