当前位置:网站首页>[data mining] task 2: mimic-iii data processing of medical database
[data mining] task 2: mimic-iii data processing of medical database
2022-07-03 01:38:00 【zstar-_】
requirement
The purpose of this task is to deal with PO2,PCO2 Two indicators . These two indicators are the patient's blood gas indicators , Collect at certain time intervals . A patient may collect one or more times during a hospital stay . requirement , According to the sequence of collection time , Summarize all the data of each patient during each hospitalization pO2, pCO2 Index value . The preprocessing methods involved include interpolation , Denoise , Missing value fill , Outlier data processing , Visualization, etc. .
Data set description
patients: Include all patient data .
chart_events: Contains all chart data available to patients . In their ICU period of stay , The main repository of patient information is their electronic charts . Electronic charts show patients' daily vital signs and any additional information related to their care : Ventilator settings 、 Laboratory value 、 Code status 、 Mental state and so on . therefore , Most of the information about patient hospitalization is contained in chartevent in . Besides , Even if laboratory values are captured elsewhere (labevent), They also often chartevent Repeat in . This is because it is desirable to display laboratory values on the patient's electronic chart , Therefore, these values are copied from the database where the laboratory values are stored to the storage chartevent In the database of . When labevent The value of and chartevent When the values in are different , With labevent The value in is subject to .
label_events: Experiment check information table , It is mainly the laboratory test record information of patients
How to download data sets :https://download.csdn.net/download/qq1198768105/85259010
Guide library
import pandas as pd
import numpy as np
import matplotlib.pyplot as plt
import seaborn as sns
Basic settings
#  Set the visualization style
plt.style.use('tableau-colorblind10')
#  Set the font to SimHei( In black )
plt.rcParams['font.sans-serif'] = ['SimHei']
#  Solve the problem of negative sign display of coordinate axis negative number under Chinese font
plt.rcParams['axes.unicode_minus'] = False
Data Extraction
extract LABEVENTS In the table PO2 and PCO2 data
#  Read the data according to the collection time
df = pd.read_csv('mini_label_events.csv', index_col='CHARTTIME')
#  select po2 and pco2 data
po2 = df.query('ITEMID==490 | ITEMID==3785 | ITEMID==3837 | ITEMID==50821')
pco2 = df.query('ITEMID==3784 | ITEMID==3835 | ITEMID==50818')
#  establish DateFrame To store data
a1 = pd.DataFrame()
a1["PO2"] = po2["VALUENUM"]
a1["PCO2"] = pco2["VALUENUM"]
a1["SUBJECT_ID"] = po2["SUBJECT_ID"]
a1["HADM_ID1"] = po2["HADM_ID"]
a1[' Acquisition time '] = a1.index
#  Reset index
a1.reset_index()
#  Sort according to the collection time from morning to night
a1.sort_values("CHARTTIME", inplace=True)
#  Insert serial number and set it as index
a1.insert(0, ' Serial number ', range(1, 1 + len(a1)))
a1.set_index(' Serial number ', inplace=True)
a1
| PO2 | PCO2 | SUBJECT_ID | HADM_ID1 | Acquisition time | |
|---|---|---|---|---|---|
| Serial number | |||||
| 1 | 186.0 | 32.0 | 60207 | 164814.0 | 2101-07-19 14:56:00 |
| 2 | 173.0 | 33.0 | 60207 | 164814.0 | 2101-07-19 22:07:00 |
| 3 | 194.0 | 29.0 | 60207 | 164814.0 | 2101-07-20 05:29:00 |
| 4 | 239.0 | 37.0 | 1205 | 152970.0 | 2101-12-20 09:03:00 |
| 5 | 129.0 | 40.0 | 1205 | 152970.0 | 2101-12-20 11:33:00 |
| ... | ... | ... | ... | ... | ... |
| 4669 | 88.0 | 28.0 | 24851 | 111571.0 | 2199-01-25 09:41:00 |
| 4670 | 35.0 | 41.0 | 24851 | 111571.0 | 2199-01-30 05:08:00 |
| 4671 | 65.0 | 36.0 | 23765 | 193447.0 | 2200-05-08 19:52:00 |
| 4672 | 89.0 | 32.0 | 23765 | 193447.0 | 2200-05-09 02:24:00 |
| 4673 | 38.0 | 44.0 | 70646 | NaN | 2201-01-25 12:23:00 |
4673 rows × 5 columns
extract CHARTEVENTS In the table PO2 and PCO2 data
df2 = pd.read_csv('mini_chart_events.csv',
                  low_memory=False, index_col="CHARTTIME")
#  select po2 and pco2 data
po2 = df2.query('ITEMID==490 | ITEMID==3785 | ITEMID==3837 | ITEMID==50821')
pco2 = df2.query('ITEMID==3784 | ITEMID==3835 | ITEMID==50818')
#  There is a repeating time index , Delete the previous , Keep the last one
po2 = po2.reset_index().drop_duplicates(
    subset='CHARTTIME', keep='last').set_index('CHARTTIME')
pco2 = pco2.reset_index().drop_duplicates(
    subset='CHARTTIME', keep='last').set_index('CHARTTIME')
#  establish DateFrame To store data
a2 = pd.DataFrame()
a2["PO2"] = po2["VALUENUM"]
a2["PCO2"] = pco2["VALUENUM"]
a2["SUBJECT_ID"] = po2["SUBJECT_ID"]
a2["HADM_ID1"] = po2["HADM_ID"]
a2[' Acquisition time '] = a2.index
#  Reset index
a2.reset_index()
#  Sort according to the collection time from morning to night
a2.sort_values("CHARTTIME", inplace=True)
#  Insert serial number and set it as index
a2.insert(0, ' Serial number ', range(1, 1 + len(a2)))
a2.set_index(' Serial number ', inplace=True)
a2
| PO2 | PCO2 | SUBJECT_ID | HADM_ID1 | Acquisition time | |
|---|---|---|---|---|---|
| Serial number | |||||
| 1 | NaN | NaN | 13081 | 120737 | 2102-01-11 06:00:00 |
| 2 | 257.200012 | NaN | 32476 | 119862 | 2109-05-30 18:59:00 |
| 3 | 54.000000 | 47.0 | 30712 | 167392 | 2111-02-22 19:23:00 |
| 4 | 68.000000 | 47.0 | 30712 | 167392 | 2111-02-22 23:32:00 |
| 5 | 42.000000 | 42.0 | 30712 | 167392 | 2111-02-23 06:23:00 |
| ... | ... | ... | ... | ... | ... |
| 132 | 49.000000 | 39.0 | 9557 | 178366 | 2195-08-07 12:00:00 |
| 133 | NaN | NaN | 9557 | 178366 | 2195-08-10 12:00:00 |
| 134 | 228.199997 | NaN | 12183 | 180744 | 2197-06-03 03:00:00 |
| 135 | 65.000000 | 36.0 | 23765 | 193447 | 2200-05-08 19:52:00 |
| 136 | NaN | NaN | 23765 | 193447 | 2200-05-16 02:00:00 |
136 rows × 5 columns
Interval of minimum acquisition time
#  According to the patient ID And different hospital stay ID Grouping
group = a1.groupby(["SUBJECT_ID", "HADM_ID1"])
#  The extraction and collection time is greater than 1 Group of ( Only 2 It takes more than a time to find the interval )
tem_list = []
for key, item in group[' Acquisition time ']:
    if item.count() > 1:
        tem_list.append(item)
#  Extract all collection intervals of each group
interval_list = []
for i in range(len(tem_list)):
    tem_list[i].sort_values(ascending=False, inplace=True)  #  Sort the collection time from large to small
    for j in range(tem_list[i].count() - 1):
        interval = pd.to_datetime(
            tem_list[i].iloc[j]) - pd.to_datetime(tem_list[i].iloc[j+1])
        interval_list.append(interval)
#  Select the minimum time interval
min(interval_list)
Output :
Timedelta('0 days 00:01:00')
You can find , The minimum acquisition interval is 1 minute , Let's use this time to interpolate .
interpolation
pandas The interpolation core function is interpolate()
The optional interpolation methods are :
nearest: Nearest neighbor interpolation
zero: Step interpolation
slinear、linear: linear interpolation
quadratic、cubic:2、3 rank B Spline interpolation
Yes LABEVENTS In the table PO2 and PCO2 Data interpolation
ipl = pd.DataFrame() # Used to store the interpolated results
for key, item in group:
    item.set_index(' Acquisition time ', inplace=True)
    item.index = pd.to_datetime(item.index)
    #  Set the resampling interval to 1min, The time is selected from the above
    ev_ipl = item.resample('1min').interpolate()  #  The default linear interpolation is used here
    ipl = pd.concat([ipl, ev_ipl], axis=0)
#  Reset index
ipl.reset_index(inplace=True)
#  Insert serial number and set it as index
ipl.insert(0, ' Serial number ', range(1, 1 + len(ipl)))
ipl.set_index(' Serial number ', inplace=True)
#  Change order
order = ['PO2', 'PCO2', 'SUBJECT_ID', 'HADM_ID1', ' Acquisition time ']
ipl = ipl[order]
ipl
| PO2 | PCO2 | SUBJECT_ID | HADM_ID1 | Acquisition time | |
|---|---|---|---|---|---|
| Serial number | |||||
| 1 | 63.000000 | 48.000000 | 127.0 | 141647.0 | 2183-08-21 10:26:00 |
| 2 | 347.000000 | 57.000000 | 273.0 | 158689.0 | 2141-04-19 05:26:00 |
| 3 | 346.573604 | 56.994924 | 273.0 | 158689.0 | 2141-04-19 05:27:00 |
| 4 | 346.147208 | 56.989848 | 273.0 | 158689.0 | 2141-04-19 05:28:00 |
| 5 | 345.720812 | 56.984772 | 273.0 | 158689.0 | 2141-04-19 05:29:00 |
| ... | ... | ... | ... | ... | ... |
| 2365510 | 56.030810 | 37.997630 | 99863.0 | 100749.0 | 2142-04-24 17:46:00 |
| 2365511 | 56.023108 | 37.998222 | 99863.0 | 100749.0 | 2142-04-24 17:47:00 |
| 2365512 | 56.015405 | 37.998815 | 99863.0 | 100749.0 | 2142-04-24 17:48:00 |
| 2365513 | 56.007703 | 37.999407 | 99863.0 | 100749.0 | 2142-04-24 17:49:00 |
| 2365514 | 56.000000 | 38.000000 | 99863.0 | 100749.0 | 2142-04-24 17:50:00 |
2365514 rows × 5 columns
Yes CHARTEVENTS In the table PO2 and PCO2 Data interpolation
ipl2 = pd.DataFrame() # Used to store the interpolated results
#  According to the patient ID And different hospital stay ID Grouping
group2 = a2.groupby(["SUBJECT_ID", "HADM_ID1"])
for key, item in group2:
    item.set_index(' Acquisition time ', inplace=True)
    item.index = pd.to_datetime(item.index)
    #  Set the resampling interval to 1min, The time is selected from the above
    ev_ipl = item.resample('1min').interpolate()  #  The default linear interpolation is used here
    ipl2 = pd.concat([ipl2, ev_ipl], axis=0)
#  Reset index
ipl2.reset_index(inplace=True)
#  Insert serial number and set it as index
ipl2.insert(0, ' Serial number ', range(1, 1 + len(ipl2)))
ipl2.set_index(' Serial number ', inplace=True)
#  Change order
order = ['PO2', 'PCO2', 'SUBJECT_ID', 'HADM_ID1', ' Acquisition time ']
ipl2 = ipl2[order]
ipl2
| PO2 | PCO2 | SUBJECT_ID | HADM_ID1 | Acquisition time | |
|---|---|---|---|---|---|
| Serial number | |||||
| 1 | 257.200012 | NaN | 907.0 | 149649.0 | 2155-08-21 19:00:00 |
| 2 | 308.500000 | NaN | 946.0 | 183564.0 | 2120-05-05 05:00:00 |
| 3 | 308.491890 | NaN | 946.0 | 183564.0 | 2120-05-05 05:01:00 |
| 4 | 308.483781 | NaN | 946.0 | 183564.0 | 2120-05-05 05:02:00 |
| 5 | 308.475671 | NaN | 946.0 | 183564.0 | 2120-05-05 05:03:00 |
| ... | ... | ... | ... | ... | ... |
| 325115 | 61.022901 | 35.984733 | 30712.0 | 167392.0 | 2111-02-24 06:10:00 |
| 325116 | 61.015267 | 35.989822 | 30712.0 | 167392.0 | 2111-02-24 06:11:00 |
| 325117 | 61.007634 | 35.994911 | 30712.0 | 167392.0 | 2111-02-24 06:12:00 |
| 325118 | 61.000000 | 36.000000 | 30712.0 | 167392.0 | 2111-02-24 06:13:00 |
| 325119 | 257.200012 | NaN | 32476.0 | 119862.0 | 2109-05-30 18:59:00 |
325119 rows × 5 columns
Missing point handling
Yes LABEVENTS In the table PO2 and PCO2 Deal with data missing points
#  testing PO2 Missing value
ipl.loc[ipl["PO2"].isnull(), :]
| PO2 | PCO2 | SUBJECT_ID | HADM_ID1 | Acquisition time | |
|---|---|---|---|---|---|
| Serial number |
#  testing PCO2 Missing value
ipl.loc[ipl["PCO2"].isnull(), :]
| PO2 | PCO2 | SUBJECT_ID | HADM_ID1 | Acquisition time | |
|---|---|---|---|---|---|
| Serial number |
LABEVENTS In the table PO2 and PCO2 There are no missing points in the data , No processing .
Yes LABEVENTS In the table PO2 and PCO2 Deal with data missing points
| PO2 | PCO2 | SUBJECT_ID | HADM_ID1 | Acquisition time | |
|---|---|---|---|---|---|
| Serial number | |||||
| 22158 | NaN | NaN | 7285.0 | 150783.0 | 2175-04-21 08:00:00 |
| 29662 | NaN | NaN | 13081.0 | 120737.0 | 2102-01-11 06:00:00 |
| 86560 | NaN | NaN | 18305.0 | 120110.0 | 2187-02-06 10:00:00 |
#  testing PCO2 Missing value
ipl2.loc[ipl2["PCO2"].isnull(), :]
| PO2 | PCO2 | SUBJECT_ID | HADM_ID1 | Acquisition time | |
|---|---|---|---|---|---|
| Serial number | |||||
| 1 | 257.200012 | NaN | 907.0 | 149649.0 | 2155-08-21 19:00:00 |
| 2 | 308.500000 | NaN | 946.0 | 183564.0 | 2120-05-05 05:00:00 |
| 3 | 308.491890 | NaN | 946.0 | 183564.0 | 2120-05-05 05:01:00 |
| 4 | 308.483781 | NaN | 946.0 | 183564.0 | 2120-05-05 05:02:00 |
| 5 | 308.475671 | NaN | 946.0 | 183564.0 | 2120-05-05 05:03:00 |
| ... | ... | ... | ... | ... | ... |
| 86557 | 249.199997 | NaN | 16378.0 | 179705.0 | 2134-03-15 19:00:00 |
| 86560 | NaN | NaN | 18305.0 | 120110.0 | 2187-02-06 10:00:00 |
| 270864 | 310.500000 | NaN | 20913.0 | 102847.0 | 2137-12-18 22:45:00 |
| 296323 | 249.199997 | NaN | 29769.0 | 179221.0 | 2178-02-28 19:00:00 |
| 325119 | 257.200012 | NaN | 32476.0 | 119862.0 | 2109-05-30 18:59:00 |
7813 rows × 5 columns
A total of 7813 Pieces of data have missing values , Delete these data
ipl2.dropna(axis='index', how='any', inplace=True) # any It means that as long as there is a missing value, the whole line will be deleted
The processed data is shown in the following table
ipl2
| PO2 | PCO2 | SUBJECT_ID | HADM_ID1 | Acquisition time | |
|---|---|---|---|---|---|
| Serial number | |||||
| 7562 | 50.000000 | 58.000000 | 4033.0 | 196289.0 | 2159-06-15 01:00:00 |
| 7563 | 50.000000 | 58.000000 | 4033.0 | 196289.0 | 2159-06-15 01:01:00 |
| 7564 | 50.000000 | 58.000000 | 4033.0 | 196289.0 | 2159-06-15 01:02:00 |
| 7565 | 50.000000 | 58.000000 | 4033.0 | 196289.0 | 2159-06-15 01:03:00 |
| 7566 | 50.000000 | 58.000000 | 4033.0 | 196289.0 | 2159-06-15 01:04:00 |
| ... | ... | ... | ... | ... | ... |
| 325114 | 61.030534 | 35.979644 | 30712.0 | 167392.0 | 2111-02-24 06:09:00 |
| 325115 | 61.022901 | 35.984733 | 30712.0 | 167392.0 | 2111-02-24 06:10:00 |
| 325116 | 61.015267 | 35.989822 | 30712.0 | 167392.0 | 2111-02-24 06:11:00 |
| 325117 | 61.007634 | 35.994911 | 30712.0 | 167392.0 | 2111-02-24 06:12:00 |
| 325118 | 61.000000 | 36.000000 | 30712.0 | 167392.0 | 2111-02-24 06:13:00 |
317306 rows × 5 columns
Denoise
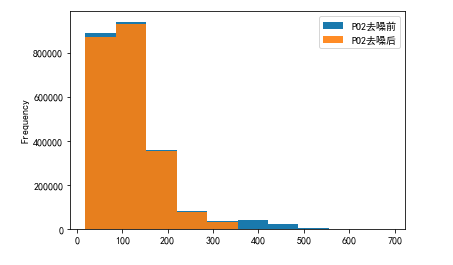
Gaussian white noise is added to the original data , Need to denoise . I choose to delete the data that deviates from the mean by three times the standard deviation for denoising .
def drop_noisy(df):
    df_copy = df.copy()
    df_describe = df_copy.describe()
    for column in df.columns:
        mean = df_describe.loc['mean', column]
        std = df_describe.loc['std', column]
        minvalue = mean - 3*std
        maxvalue = mean + 3*std
        df_copy = df_copy[df_copy[column] >= minvalue]
        df_copy = df_copy[df_copy[column] <= maxvalue]
    return df_copy
Yes LABEVENTS In the table PO2 and PCO2 Data denoising
#  Here only for PO2 and PCO2 Column for denoising
dno1 = drop_noisy(ipl.iloc[:, :2])
dno1
| PO2 | PCO2 | |
|---|---|---|
| Serial number | ||
| 1 | 63.000000 | 48.000000 |
| 2 | 347.000000 | 57.000000 |
| 3 | 346.573604 | 56.994924 |
| 4 | 346.147208 | 56.989848 |
| 5 | 345.720812 | 56.984772 |
| ... | ... | ... |
| 2365510 | 56.030810 | 37.997630 |
| 2365511 | 56.023108 | 37.998222 |
| 2365512 | 56.015405 | 37.998815 |
| 2365513 | 56.007703 | 37.999407 |
| 2365514 | 56.000000 | 38.000000 |
2266786 rows × 2 columns
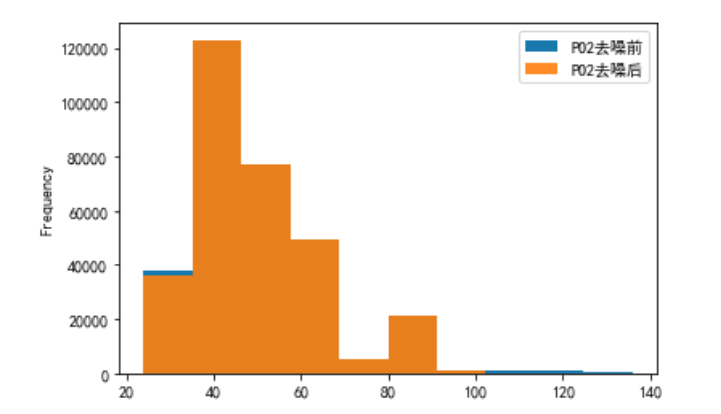
Yes PO2 and PCO2 The denoising results are displayed visually
# PO2 Visualization before and after denoising
plo1 = pd.DataFrame()
plo1['PO2 Before denoising '] = ipl['PO2']
plo1['PO2 After denoising '] = dno1['PO2']
plo1.plot.hist(alpha=0.9)
# PCO2 Visualization before and after denoising
plo2 = pd.DataFrame()
plo2['PCO2 Before denoising '] = ipl['PCO2']
plo2['PCO2 After denoising '] = dno1['PCO2']
plo2.plot.hist(alpha=0.9)

Yes CHARTEVENTS In the table PO2 and PCO2 Data denoising
dno2 = drop_noisy(ipl2.iloc[:, :2])
dno2
| PO2 | PCO2 | |
|---|---|---|
| Serial number | ||
| 7562 | 50.000000 | 58.000000 |
| 7563 | 50.000000 | 58.000000 |
| 7564 | 50.000000 | 58.000000 |
| 7565 | 50.000000 | 58.000000 |
| 7566 | 50.000000 | 58.000000 |
| ... | ... | ... |
| 325114 | 61.030534 | 35.979644 |
| 325115 | 61.022901 | 35.984733 |
| 325116 | 61.015267 | 35.989822 |
| 325117 | 61.007634 | 35.994911 |
| 325118 | 61.000000 | 36.000000 |
312190 rows × 2 columns
Yes PO2 and PCO2 The denoising results are displayed visually
# PO2 Visualization before and after denoising
plo3 = pd.DataFrame()
plo3['PO2 Before denoising '] = ipl2['PO2']
plo3['PO2 After denoising '] = dno2['PO2']
plo3.plot.hist(alpha=0.9)
# PCO2 Visualization before and after denoising
plo4 = pd.DataFrame()
plo4['PCO2 Before denoising '] = ipl2['PCO2']
plo4['PCO2 After denoising '] = dno2['PCO2']
plo4.plot.hist(alpha=0.9)

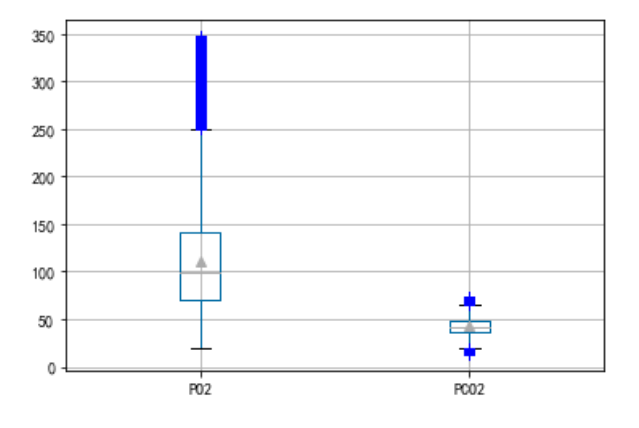
Outlier processing
By drawing a box diagram , Treat data outside the upper and lower edges as outliers , Remove it
Yes LABEVENTS In the table PO2 and PCO2 Data outliers are processed
c = pd.DataFrame()
c['PO2'] = plo1['PO2 After denoising ']
c['PCO2'] = plo2['PCO2 After denoising ']
c.boxplot(showmeans=True, sym='b+')
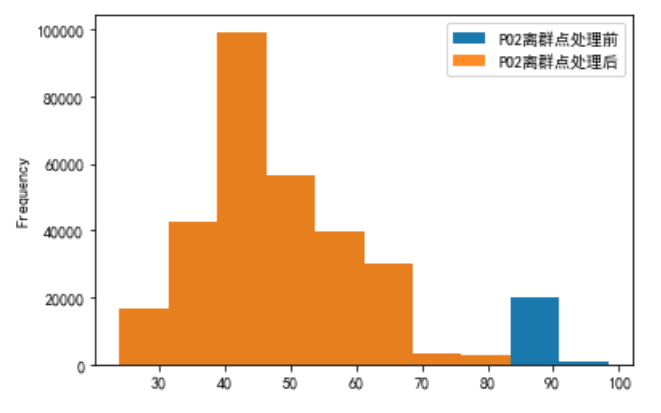
Yes PO2 Data processing , Remove the data on the upper and lower edges of the box diagram
a = pd.DataFrame()
b = pd.DataFrame()
a['PO2'] = plo1['PO2 After denoising ']
b['PO2 Before outlier processing '] = a['PO2']
#  Remove the data on the upper and lower edges of the box diagram
first_quartile = a['PO2'].describe()['25%']
third_quartile = a['PO2'].describe()['75%']
iqr = third_quartile - first_quartile
b['PO2 After outliers processing '] = a[(a['PO2'] > (first_quartile - 1.5 * iqr)) &
                   (a['PO2'] < (third_quartile + 1.5 * iqr))]
b.plot.hist(alpha=0.9)

Yes PCO2 Data processing
a = pd.DataFrame()
b = pd.DataFrame()
a['PCO2'] = plo2['PCO2 After denoising ']
b['PCO2 Before outlier processing '] = a['PCO2']
#  Remove the data on the upper and lower edges of the box diagram
first_quartile = a['PCO2'].describe()['25%']
third_quartile = a['PCO2'].describe()['75%']
iqr = third_quartile - first_quartile
b['PCO2 After outliers processing '] = a[(a['PCO2'] > (first_quartile - 1.5 * iqr)) &
                    (a['PCO2'] < (third_quartile + 1.5 * iqr))]
b.plot.hist(alpha=0.9)

Yes CHARTEVENTS In the table PO2 and PCO2 Data outliers are processed
c = pd.DataFrame()
c['PO2'] = plo3['PO2 After denoising ']
c['PCO2'] = plo4['PCO2 After denoising ']
c.boxplot(showmeans=True, sym='b+')

Yes PO2 Data processing , Remove the data on the upper and lower edges of the box diagram
a = pd.DataFrame()
b = pd.DataFrame()
a['PO2'] = plo3['PO2 After denoising ']
b['PO2 Before outlier processing '] = a['PO2']
#  Remove the data on the upper and lower edges of the box diagram
first_quartile = a['PO2'].describe()['25%']
third_quartile = a['PO2'].describe()['75%']
iqr = third_quartile - first_quartile
b['PO2 After outliers processing '] = a[(a['PO2'] > (first_quartile - 1.5 * iqr)) &
                   (a['PO2'] < (third_quartile + 1.5 * iqr))]
b.plot.hist(alpha=0.9)
Yes PCO2 Data processing
a = pd.DataFrame()
b = pd.DataFrame()
a['PCO2'] = plo4['PCO2 After denoising ']
b['PCO2 Before outlier processing '] = a['PCO2']
#  Remove the data on the upper and lower edges of the box diagram
first_quartile = a['PCO2'].describe()['25%']
third_quartile = a['PCO2'].describe()['75%']
iqr = third_quartile - first_quartile
b['PCO2 After outliers processing '] = a[(a['PCO2'] > (first_quartile - 1.5 * iqr)) &
                    (a['PCO2'] < (third_quartile + 1.5 * iqr))]
b.plot.hist(alpha=0.9)

边栏推荐
- C#应用程序界面开发基础——窗体控制(1)——Form窗体
- Tp6 fast installation uses mongodb to add, delete, modify and check
- Androd Gradle 对其使用模块依赖的替换
- Three core issues of concurrent programming - "deep understanding of high concurrent programming"
- 电信客户流失预测挑战赛
- Common English Vocabulary
- How is the mask effect achieved in the LPL ban/pick selection stage?
- 云原生题目整理(待更新)
- Using tensorboard to visualize the model, data and training process
- Uniapp component -uni notice bar notice bar
猜你喜欢
C#应用程序界面开发基础——窗体控制(1)——Form窗体

Scheme and practice of cold and hot separation of massive data
![[data mining] task 6: DBSCAN clustering](/img/af/ad7aa523b09884eee967c6773a613f.png)
[data mining] task 6: DBSCAN clustering
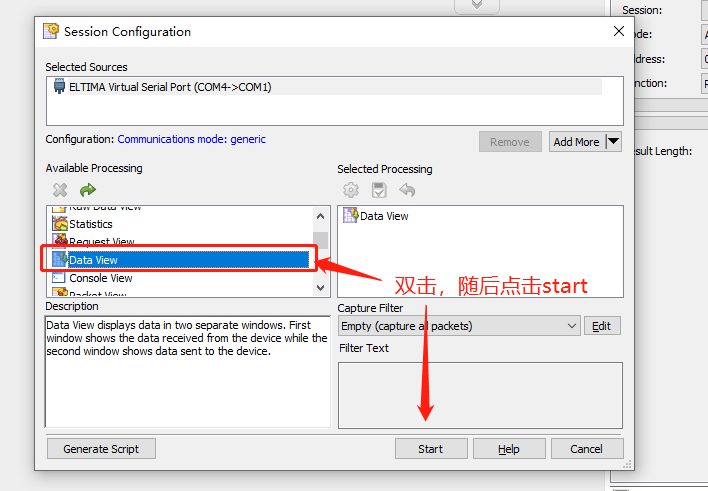
Installation and use of serial port packet capturing / cutting tool
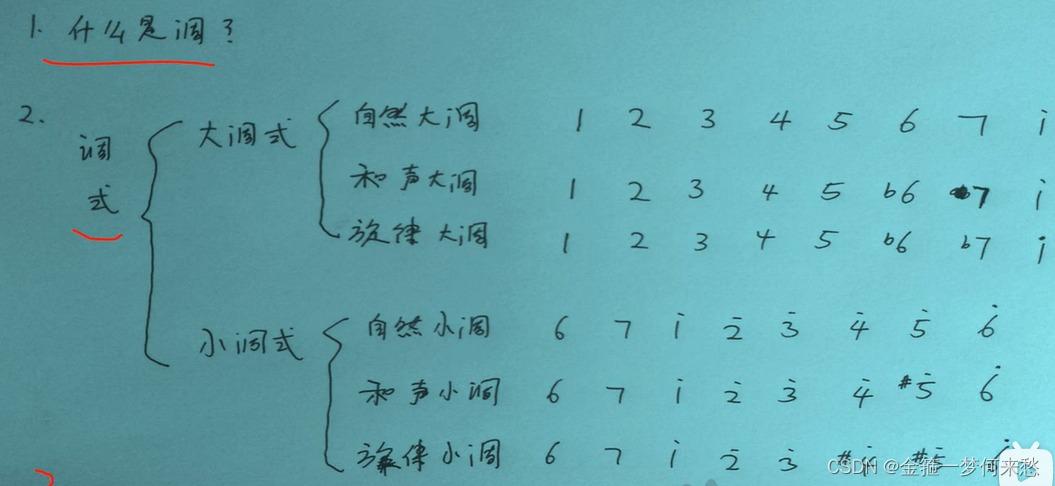
什么是调。调的故事

Take you ten days to easily complete the go micro service series (I)
【数据挖掘】任务2:医学数据库MIMIC-III数据处理
![[error record] the shutter component reports an error (no directionality widget found. | richtext widgets require a directionality)](/img/3c/93ef853784d4e7cef63f30be0b0bf2.jpg)
[error record] the shutter component reports an error (no directionality widget found. | richtext widgets require a directionality)
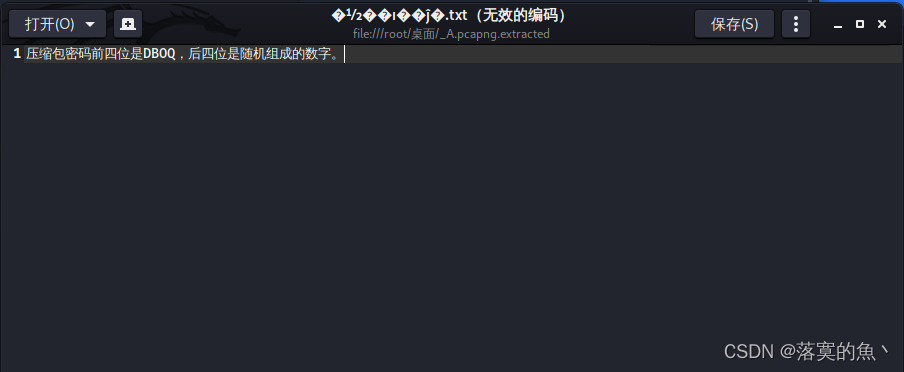
wirehark数据分析与取证A.pacapng

LeetCode 987. Vertical order transverse of a binary tree - Binary Tree Series Question 7
随机推荐
Everything文件搜索工具
Meituan dynamic thread pool practice ideas, open source
C语言课程信息管理系统
Is there a handling charge for spot gold investment
LeetCode 987. Vertical order transverse of a binary tree - Binary Tree Series Question 7
C#应用程序界面开发基础——窗体控制(2)——MDI窗体
给你一个可能存在 重复 元素值的数组 numbers ,它原来是一个升序排列的数组,并按上述情形进行了一次旋转。请返回旋转数组的最小元素。【剑指Offer】
wirehark数据分析与取证A.pacapng
[North Asia data recovery] data recovery case of raid crash caused by hard disk disconnection during data synchronization of hot spare disk of RAID5 disk array
View of MySQL
d,ldc構建共享庫
网络安全-密码破解
Androd gradle's substitution of its use module dependency
After reading this article, I will teach you to play with the penetration test target vulnhub - drivetingblues-9
Button wizard play strange learning - automatic return to the city route judgment
Tâche 6: regroupement DBSCAN
Scheme and practice of cold and hot separation of massive data
云原生题目整理(待更新)
Leetcode 6103 - minimum fraction to delete an edge from the tree
CF1617B Madoka and the Elegant Gift、CF1654C Alice and the Cake、 CF1696C Fishingprince Plays With Arr