当前位置:网站首页>Starting from 1.5, build a micro Service Framework - call chain tracking traceid
Starting from 1.5, build a micro Service Framework - call chain tracking traceid
2022-07-06 00:36:00 【InfoQ】
Preface
1Core functions
- Split multiple micro service modules , Draw out one demo Microservice module for expansion , Completed
- Extract core framework modules , Completed
- Registry Center Eureka, Completed
- The remote invocation OpenFeign, Completed
- journal logback, contain traceId track , Completed
- Swagger API file , Completed
- Configure file sharing , Completed
- Log retrieval ,ELK Stack, Completed
- Customize Starter, undetermined
- Consolidated cache Redis,Redis Sentinel high availability , Completed
- Consolidate databases MySQL,MySQL High availability , Completed
- Integrate MyBatis-Plus, Completed
- Link tracking component , undetermined
- monitor , undetermined
- Tool class , To be developed
- gateway , Technology selection to be determined
- Audit log entry ES, undetermined
- distributed file system , undetermined
- Timing task , undetermined
- wait
One 、 Pain points
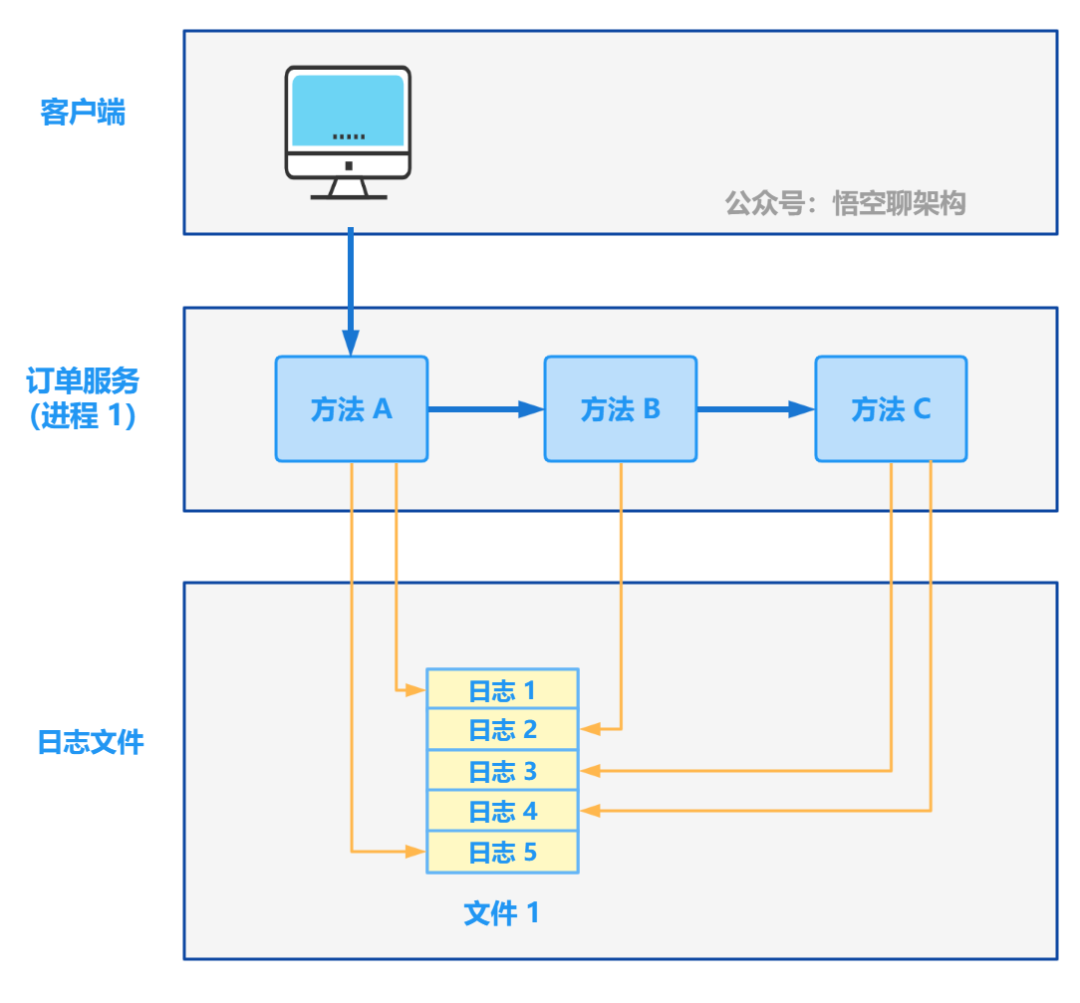
It hurts a little : Multiple logs in the process cannot be traced
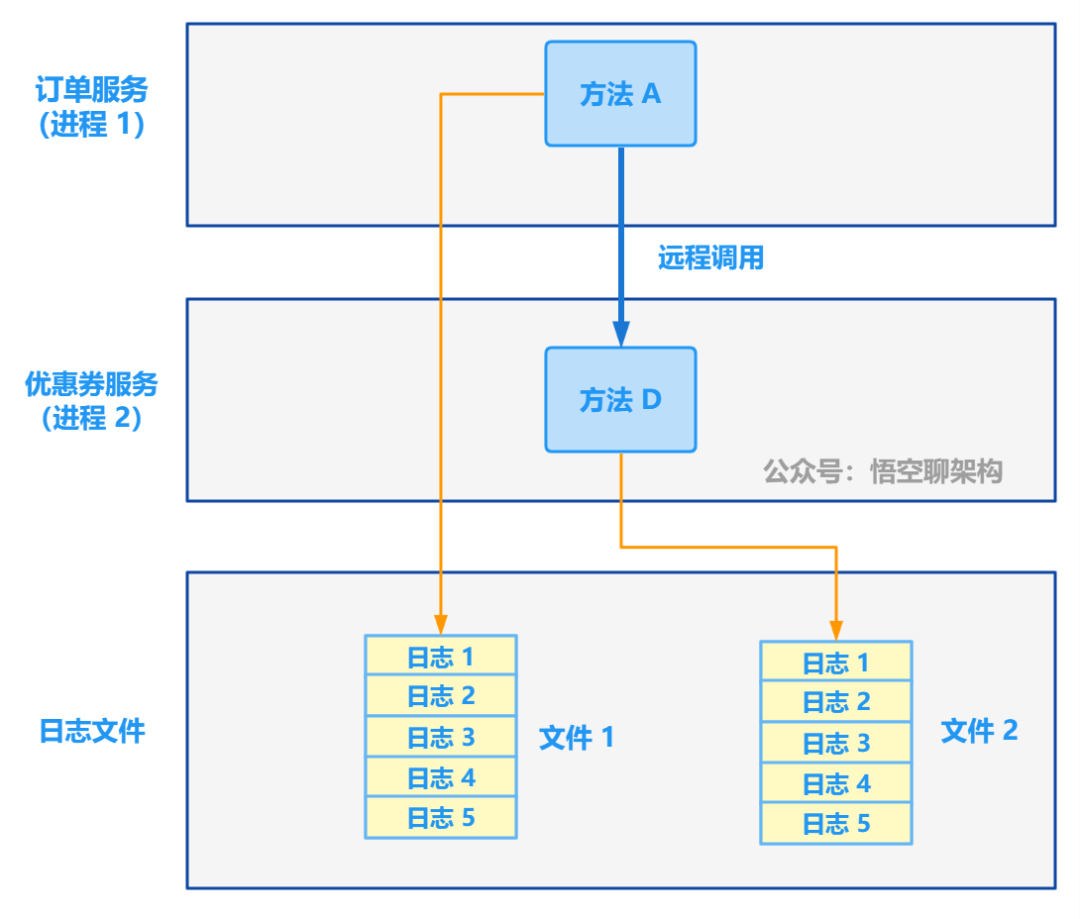
Pain point two : How to correlate logs across Services
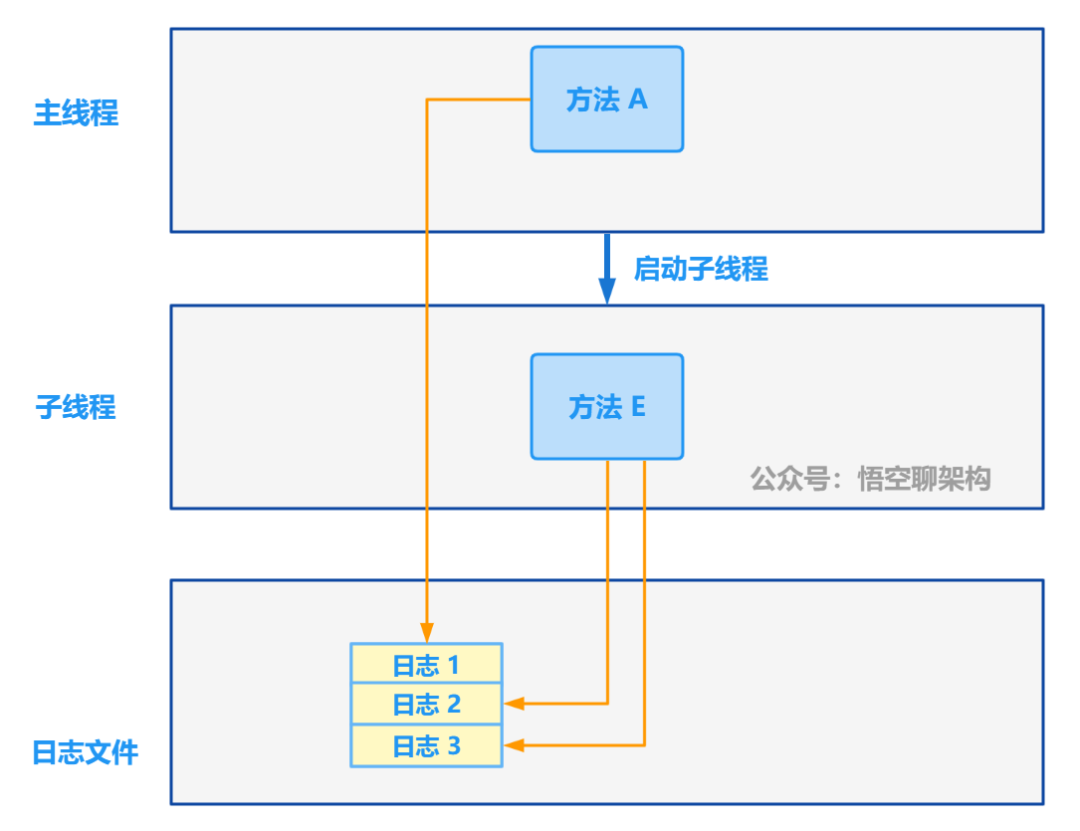
Pain point three : How to correlate logs across threads
It hurts four : The third party calls our service , How to track ?
Two 、 programme
1.1 Solution
1.2 MDC programme
3、 ... and 、 Principle and practice
2.1 Track multiple logs of a request
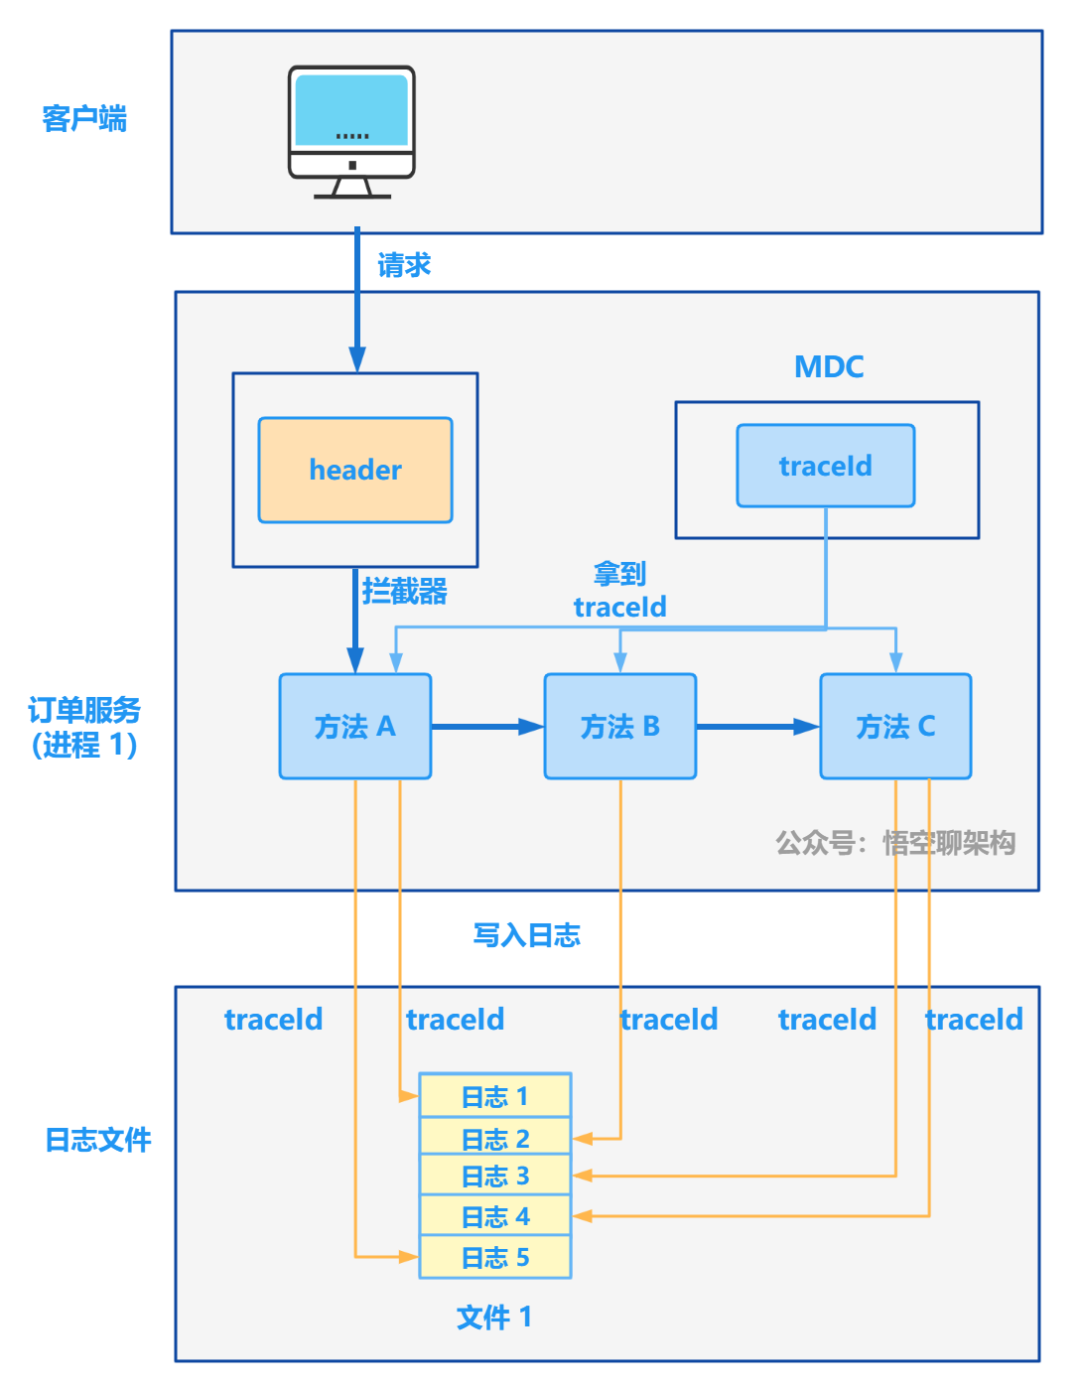
<pattern>%d{yyyy-MM-dd HH:mm:ss.SSS} [%thread] %X{traceId} %-5level %logger - %msg%n</pattern>
headertraceId
Sample code
/**
 * @author www.passjava.cn, official account : Wukong chat structure
 * @date 2022-07-05
 */
@Service
public class LogInterceptor extends HandlerInterceptorAdapter {

 private static final String TRACE_ID = "traceId";

 @Override
 public boolean preHandle(HttpServletRequest request, HttpServletResponse response, Object handler) throws Exception {
 String traceId = request.getHeader(TRACE_ID);
 if (StringUtils.isEmpty(traceId)) {
 MDC.put("traceId", UUID.randomUUID().toString());
 } else {
 MDC.put(TRACE_ID, traceId);
 }

 return true;
 }

 @Override
 public void postHandle(HttpServletRequest request, HttpServletResponse response, Object handler, ModelAndView modelAndView) throws Exception {
 // Prevent memory leaks
 MDC.remove("traceId");
 }
}
/**
 * @author www.passjava.cn, official account : Wukong chat structure
 * @date 2022-07-05
 */
@Configuration
public class InterceptorConfig implements WebMvcConfigurer {

 @Resource
 private LogInterceptor logInterceptor;

 @Override
 public void addInterceptors(InterceptorRegistry registry) {
 registry.addInterceptor(logInterceptor).addPathPatterns("/**");
 }
}
2.2 Track multiple logs across Services
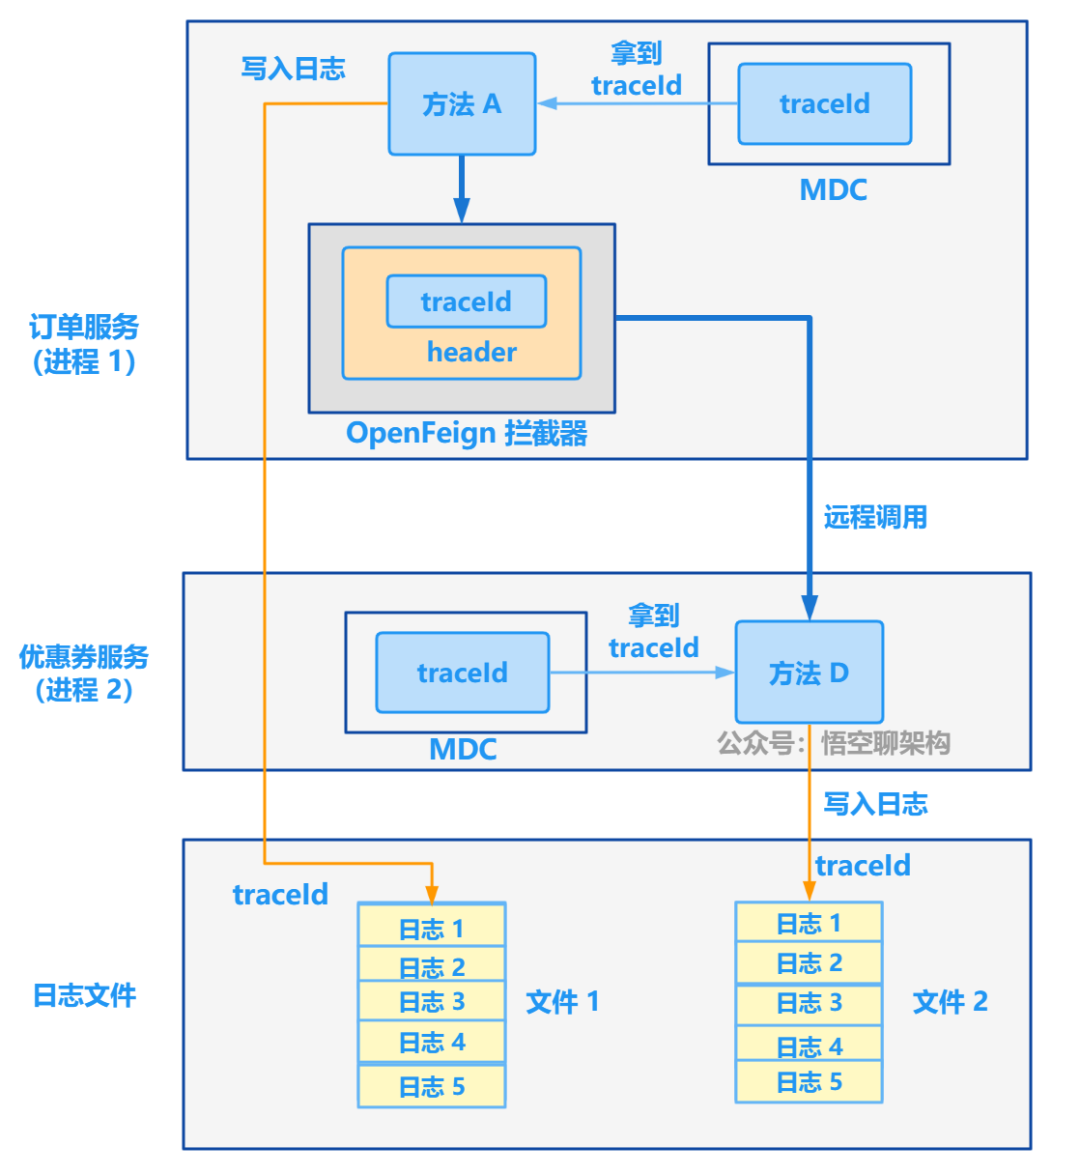
/**
 * @author www.passjava.cn, official account : Wukong chat structure
 * @date 2022-07-05
 */
@Configuration
public class FeignInterceptor implements RequestInterceptor {
 private static final String TRACE_ID = "traceId";

 @Override
 public void apply(RequestTemplate requestTemplate) {
 requestTemplate.header(TRACE_ID, (String) MDC.get(TRACE_ID));
 }
}

Four 、 summary
边栏推荐
- Intranet Security Learning (V) -- domain horizontal: SPN & RDP & Cobalt strike
- [Chongqing Guangdong education] reference materials for Zhengzhou Vocational College of finance, taxation and finance to play around the E-era
- MIT博士论文 | 使用神经符号学习的鲁棒可靠智能系统
- About the slmgr command
- Spark AQE
- Key structure of ffmpeg - avformatcontext
- Codeforces Round #804 (Div. 2)【比赛记录】
- Natural language processing (NLP) - third party Library (Toolkit):allenlp [library for building various NLP models; based on pytorch]
- An understanding of & array names
- Data analysis thinking analysis methods and business knowledge -- analysis methods (II)
猜你喜欢
Room cannot create an SQLite connection to verify the queries

Ffmpeg captures RTSP images for image analysis

FFmpeg抓取RTSP图像进行图像分析
Data analysis thinking analysis methods and business knowledge - analysis methods (III)
如何制作自己的機器人
Extension and application of timestamp

Problems and solutions of converting date into specified string in date class
常用API类及异常体系

2022-02-13 work record -- PHP parsing rich text
图解网络:TCP三次握手背后的原理,为啥两次握手不可以?
随机推荐
关于slmgr命令的那些事
Pointer pointer array, array pointer
建立时间和保持时间的模型分析
Opencv classic 100 questions
STM32 key chattering elimination - entry state machine thinking
Spark获取DataFrame中列的方式--col,$,column,apply
小程序容器可以发挥的价值
MySql——CRUD
Hudi of data Lake (1): introduction to Hudi
[Chongqing Guangdong education] Chongqing Engineering Vocational and Technical College
小程序技术优势与产业互联网相结合的分析
Free chat robot API
MySQL functions
Cloud guide DNS, knowledge popularization and classroom notes
State mode design procedure: Heroes in the game can rest, defend, attack normally and attack skills according to different physical strength values.
【文件IO的简单实现】
Common API classes and exception systems
如何解决ecology9.0执行导入流程流程产生的问题
MySQL storage engine
Spark-SQL UDF函数