当前位置:网站首页>Recognize the small experiment of extracting and displaying Mel spectrum (observe the difference between different y_axis and x_axis)
Recognize the small experiment of extracting and displaying Mel spectrum (observe the difference between different y_axis and x_axis)
2022-07-06 00:01:00 【Begonia_ cat】
Import librosa
import librosa
Read audio
y, sr = librosa.load("C:/Users/24061/Desktop/MER Data sets /DEAM/DEAM_audio/MEMD_audio_wav/2.wav")
y
array([0.        , 0.        , 0.        , ..., 0.4163208 , 0.43338013,
       0.40551758], dtype=float32)
sr
22050
Extract Mel spectrum
mel_spectrogram = librosa.feature.melspectrogram(y=y, sr=sr, n_fft=2048, hop_length=1024)
mel_spectrogram # type: numpy.ndarray
array([[0.00000000e+00, 1.25761675e-02, 2.62945890e+00, ...,
        4.08293676e+00, 7.79196739e+00, 5.92219353e+00],
       [0.00000000e+00, 1.00206733e-01, 1.33076525e+00, ...,
        6.49990678e-01, 1.44000304e+00, 1.67580545e+00],
       [0.00000000e+00, 4.64823037e-01, 1.54586525e+01, ...,
        3.54503012e+00, 2.53890848e+00, 9.59981441e+00],
       ...,
       [0.00000000e+00, 6.95451519e-09, 3.43443826e-05, ...,
        6.05733460e-03, 1.72329806e-02, 7.06060929e-03],
       [0.00000000e+00, 7.65795605e-09, 7.63881962e-06, ...,
        1.81941327e-03, 3.55470460e-03, 4.70093498e-03],
       [0.00000000e+00, 4.74458783e-09, 5.26388646e-07, ...,
        1.27859021e-04, 7.03962069e-05, 1.91266462e-03]], dtype=float32)
mel_spectrogram.shape
(128, 971)
Show Mel spectrum
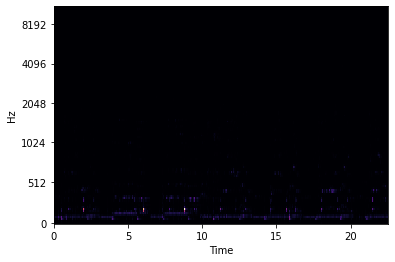
1、 When not converted to logarithmic spectrum
- Display frequency on mel scale
y_axis='mel'
import librosa.display
librosa.display.specshow(mel_spectrogram, y_axis='mel', x_axis='time')
<matplotlib.collections.QuadMesh at 0x23d902a60b8>
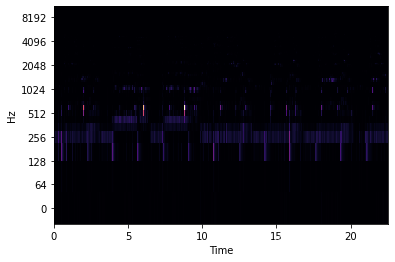
- Display frequency on logarithmic scale
y_axis='log'
librosa.display.specshow(mel_spectrogram, y_axis='log', x_axis='time')
<matplotlib.collections.QuadMesh at 0x23d92827e80>
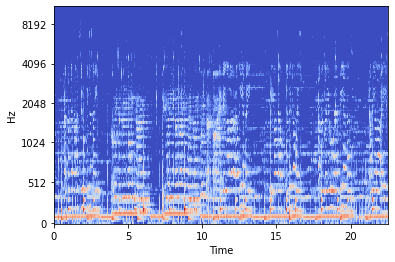
2、 Convert the amplitude to logarithm
mel_spectrogram_db = librosa.amplitude_to_db(mel_spectrogram)
mel_spectrogram_db
array([[-19.654686 , -19.654686 ,   8.397327 , ...,  12.219453 ,
         17.832943 ,  15.449652 ],
       [-19.654686 , -19.654686 ,   2.482029 , ...,  -3.7418575,
          3.167268 ,   4.484472 ],
       [-19.654686 ,  -6.6542473,  23.783434 , ...,  10.992398 ,
          8.092941 ,  19.645256 ],
       ...,
       [-19.654686 , -19.654686 , -19.654686 , ..., -19.654686 ,
        -19.654686 , -19.654686 ],
       [-19.654686 , -19.654686 , -19.654686 , ..., -19.654686 ,
        -19.654686 , -19.654686 ],
       [-19.654686 , -19.654686 , -19.654686 , ..., -19.654686 ,
        -19.654686 , -19.654686 ]], dtype=float32)
mel_spectrogram_db.shape
(128, 971)
- Display frequency on mel scale
y_axis="mel"
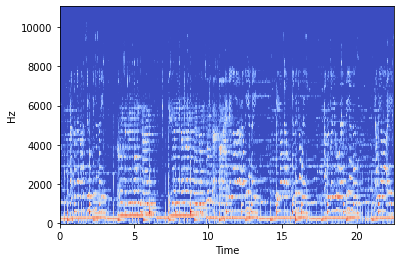
librosa.display.specshow(mel_spectrogram_db, y_axis="mel",x_axis="time" )
<matplotlib.collections.QuadMesh at 0x23d9194ce10>
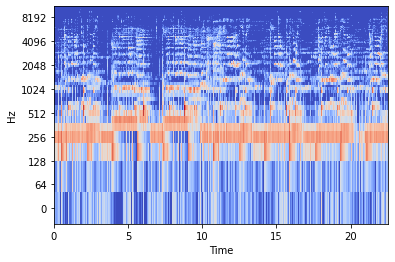
- Display frequency on logarithmic scale
y_axis="log"
librosa.display.specshow(mel_spectrogram_db, y_axis="log",x_axis="time" )
<matplotlib.collections.QuadMesh at 0x23d925c7cc0>
With Hz Display frequency y_axis="hz"
librosa.display.specshow(mel_spectrogram_db, y_axis="hz",x_axis="time" )
<matplotlib.collections.QuadMesh at 0x23d92c2f5f8>
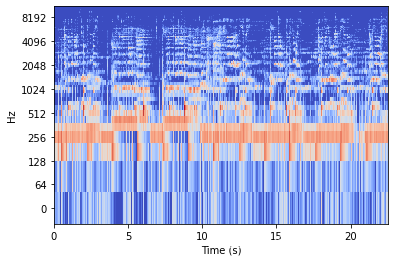
- Show the frequency in logarithmic spectrum
y_axis="log", The unit of time is secondsx_axis="s"
librosa.display.specshow(mel_spectrogram_db, y_axis="log",x_axis="s" )
<matplotlib.collections.QuadMesh at 0x23d9348a550>
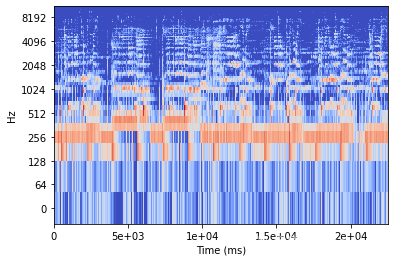
- Show the frequency in logarithmic spectrum
y_axis="log", Time is measured in millisecondsx_axis="ms"
librosa.display.specshow(mel_spectrogram_db, y_axis="log",x_axis="ms" )
<matplotlib.collections.QuadMesh at 0x23d93ea76a0>
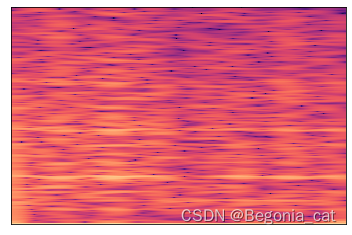
rhythm ( To be continued ), I don't quite understand
librosa.feature.fourier_tempogram(y, sr)
C:\Users\24061\anaconda3\envs\tensorflow\lib\site-packages\ipykernel_launcher.py:1: FutureWarning: Pass y=[0.         0.         0.         ... 0.4163208  0.43338013 0.40551758], sr=22050 as keyword args. From version 0.10 passing these as positional arguments will result in an error
  """Entry point for launching an IPython kernel.


array([[ 1.41953934e+02+0.0000000e+00j,  1.43232498e+02+0.0000000e+00j,
         1.44507858e+02+0.0000000e+00j, ...,
         1.20833031e+02+0.0000000e+00j,  1.19599785e+02+0.0000000e+00j,
         1.18365807e+02+0.0000000e+00j],
       [-8.12093430e+01+7.8693253e+01j, -8.25004044e+01+7.8347717e+01j,
        -8.37830200e+01+7.7980965e+01j, ...,
        -6.11498871e+01-7.6005348e+01j, -5.98955841e+01-7.6018913e+01j,
        -5.86419067e+01-7.6011627e+01j],
       [ 2.08344612e+01-5.4645943e+01j,  2.22085571e+01-5.3934937e+01j,
         2.35550823e+01-5.3178368e+01j, ...,
         1.26519930e+00+5.0331814e+01j,  4.82287928e-02+5.0350494e+01j,
        -1.16933417e+00+5.0330265e+01j],
       ...,
       [-3.68897580e-02-7.4101496e-01j,  9.78471190e-02+7.0739186e-01j,
        -1.57261893e-01-6.6958255e-01j, ...,
        -4.85646218e-01+1.2208136e-01j,  4.81895536e-01-1.4795184e-01j,
        -4.76868808e-01+1.7341925e-01j],
       [-1.62224078e+00-6.7166932e-02j,  1.64763165e+00+3.6856860e-02j,
        -1.67323339e+00-5.3153611e-03j, ...,
         6.40185595e-01-6.1752874e-01j, -6.37307167e-01+6.1541033e-01j,
         6.34444416e-01-6.1347997e-01j],
       [ 1.42917812e+00+0.0000000e+00j, -1.40549254e+00+0.0000000e+00j,
         1.38058436e+00+0.0000000e+00j, ...,
        -1.41562808e+00+0.0000000e+00j,  1.39833307e+00+0.0000000e+00j,
        -1.38108861e+00+0.0000000e+00j]], dtype=complex64)
librosa.display.specshow(librosa.amplitude_to_db(librosa.feature.fourier_tempogram(y, sr)))
C:\Users\24061\anaconda3\envs\tensorflow\lib\site-packages\ipykernel_launcher.py:1: FutureWarning: Pass y=[0.         0.         0.         ... 0.4163208  0.43338013 0.40551758], sr=22050 as keyword args. From version 0.10 passing these as positional arguments will result in an error
  """Entry point for launching an IPython kernel.
C:\Users\24061\anaconda3\envs\tensorflow\lib\site-packages\librosa\util\decorators.py:88: UserWarning: amplitude_to_db was called on complex input so phase information will be discarded. To suppress this warning, call amplitude_to_db(np.abs(S)) instead.
  return f(*args, **kwargs)


<matplotlib.collections.QuadMesh at 0x23d9325f860>
边栏推荐
- Effet Doppler (déplacement de fréquence Doppler)
- 【GYM 102832H】【模板】Combination Lock(二分图博弈)
- Chapter 16 oauth2authorizationrequestredirectwebfilter source code analysis
- 20220703 周赛:知道秘密的人数-动规(题解)
- USB Interface USB protocol
- C# 反射与Type
- 从底层结构开始学习FPGA----FIFO IP核及其关键参数介绍
- Which side projects can be achieved? Is it difficult for we media to earn more than 10000 a month?
- NSSA area where OSPF is configured for Huawei equipment
- 软件测试工程师必会的银行存款业务,你了解多少?
猜你喜欢
Breadth first search open turntable lock
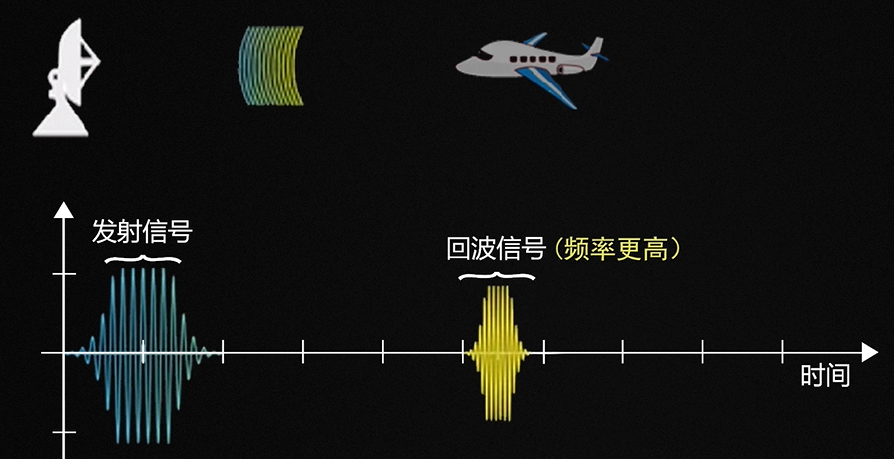
多普勒效應(多普勒頻移)
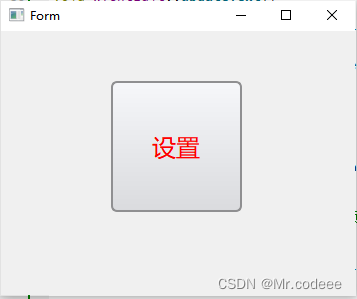
Qt QPushButton详解
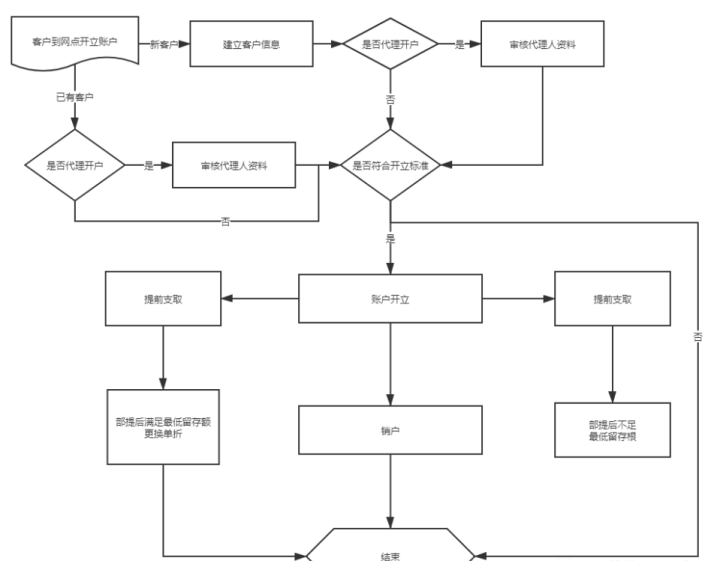
How much do you know about the bank deposit business that software test engineers must know?
【DesignMode】组合模式(composite mode)

What are the functions of Yunna fixed assets management system?
Spreadjs 15.1 CN and spreadjs 15.1 en
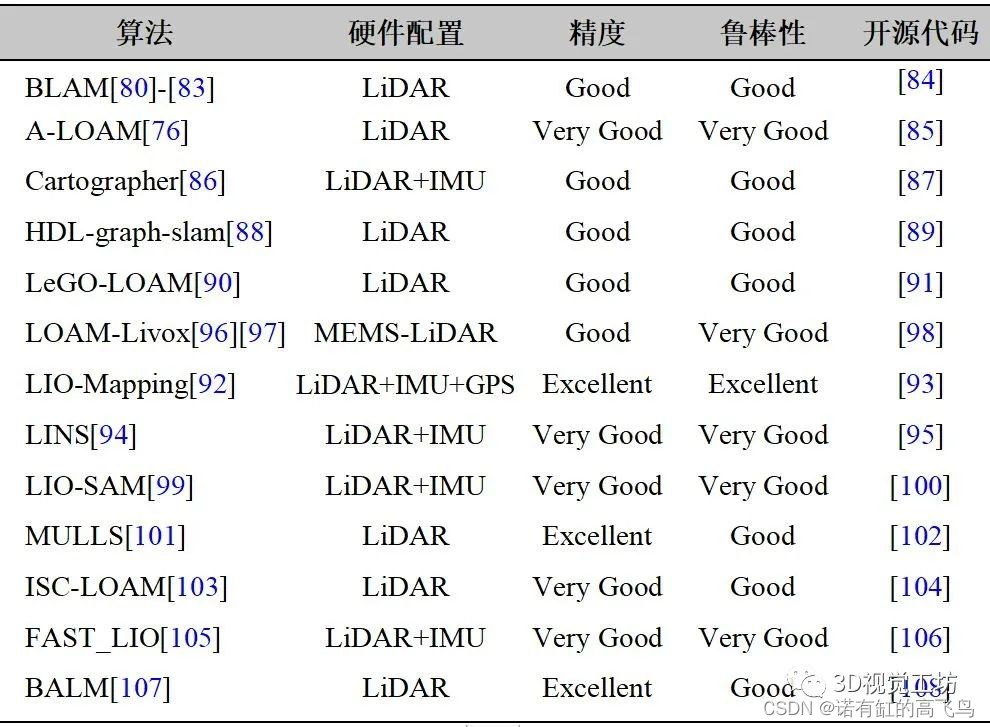
Laser slam learning record
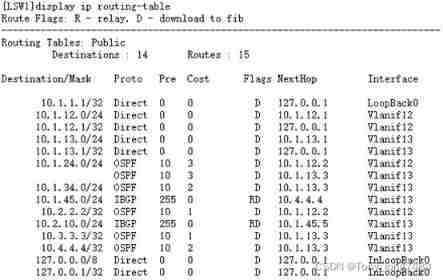
Huawei equipment configuration ospf-bgp linkage

wx.getLocation(Object object)申请方法,最新版
随机推荐
Knowledge about the memory size occupied by the structure
Determinant learning notes (I)
Zero rhino technology joined hands with the intelligence Club: the "causal faction" forum was successfully held, and the "causal revolution" brought the next generation of trusted AI
教你在HbuilderX上使用模拟器运行uni-app,良心教学!!!
Use CAS instead of synchronized
Research notes I software engineering and calculation volume II (Chapter 1-7)
云呐|公司固定资产管理系统有哪些?
18. (ArcGIS API for JS) ArcGIS API for JS point collection (sketchviewmodel)
【luogu CF487E】Tourists(圆方树)(树链剖分)(线段树)
Russian Foreign Ministry: Japan and South Korea's participation in the NATO summit affects security and stability in Asia
JS 这次真的可以禁止常量修改了!
Shardingsphere source code analysis
15 MySQL stored procedures and functions
同事悄悄告诉我,飞书通知还能这样玩
【GYM 102832H】【模板】Combination Lock(二分图博弈)
14 MySQL view
mysql-全局锁和表锁
Which side projects can be achieved? Is it difficult for we media to earn more than 10000 a month?
Learn PWN from CTF wiki - ret2libc1
What is information security? What is included? What is the difference with network security?