当前位置:网站首页>Visualization Document Feb 12 16:42
Visualization Document Feb 12 16:42
2022-07-07 07:50:00 【SyncStudy】
Visualization Document Feb 12 16:42
List of articles
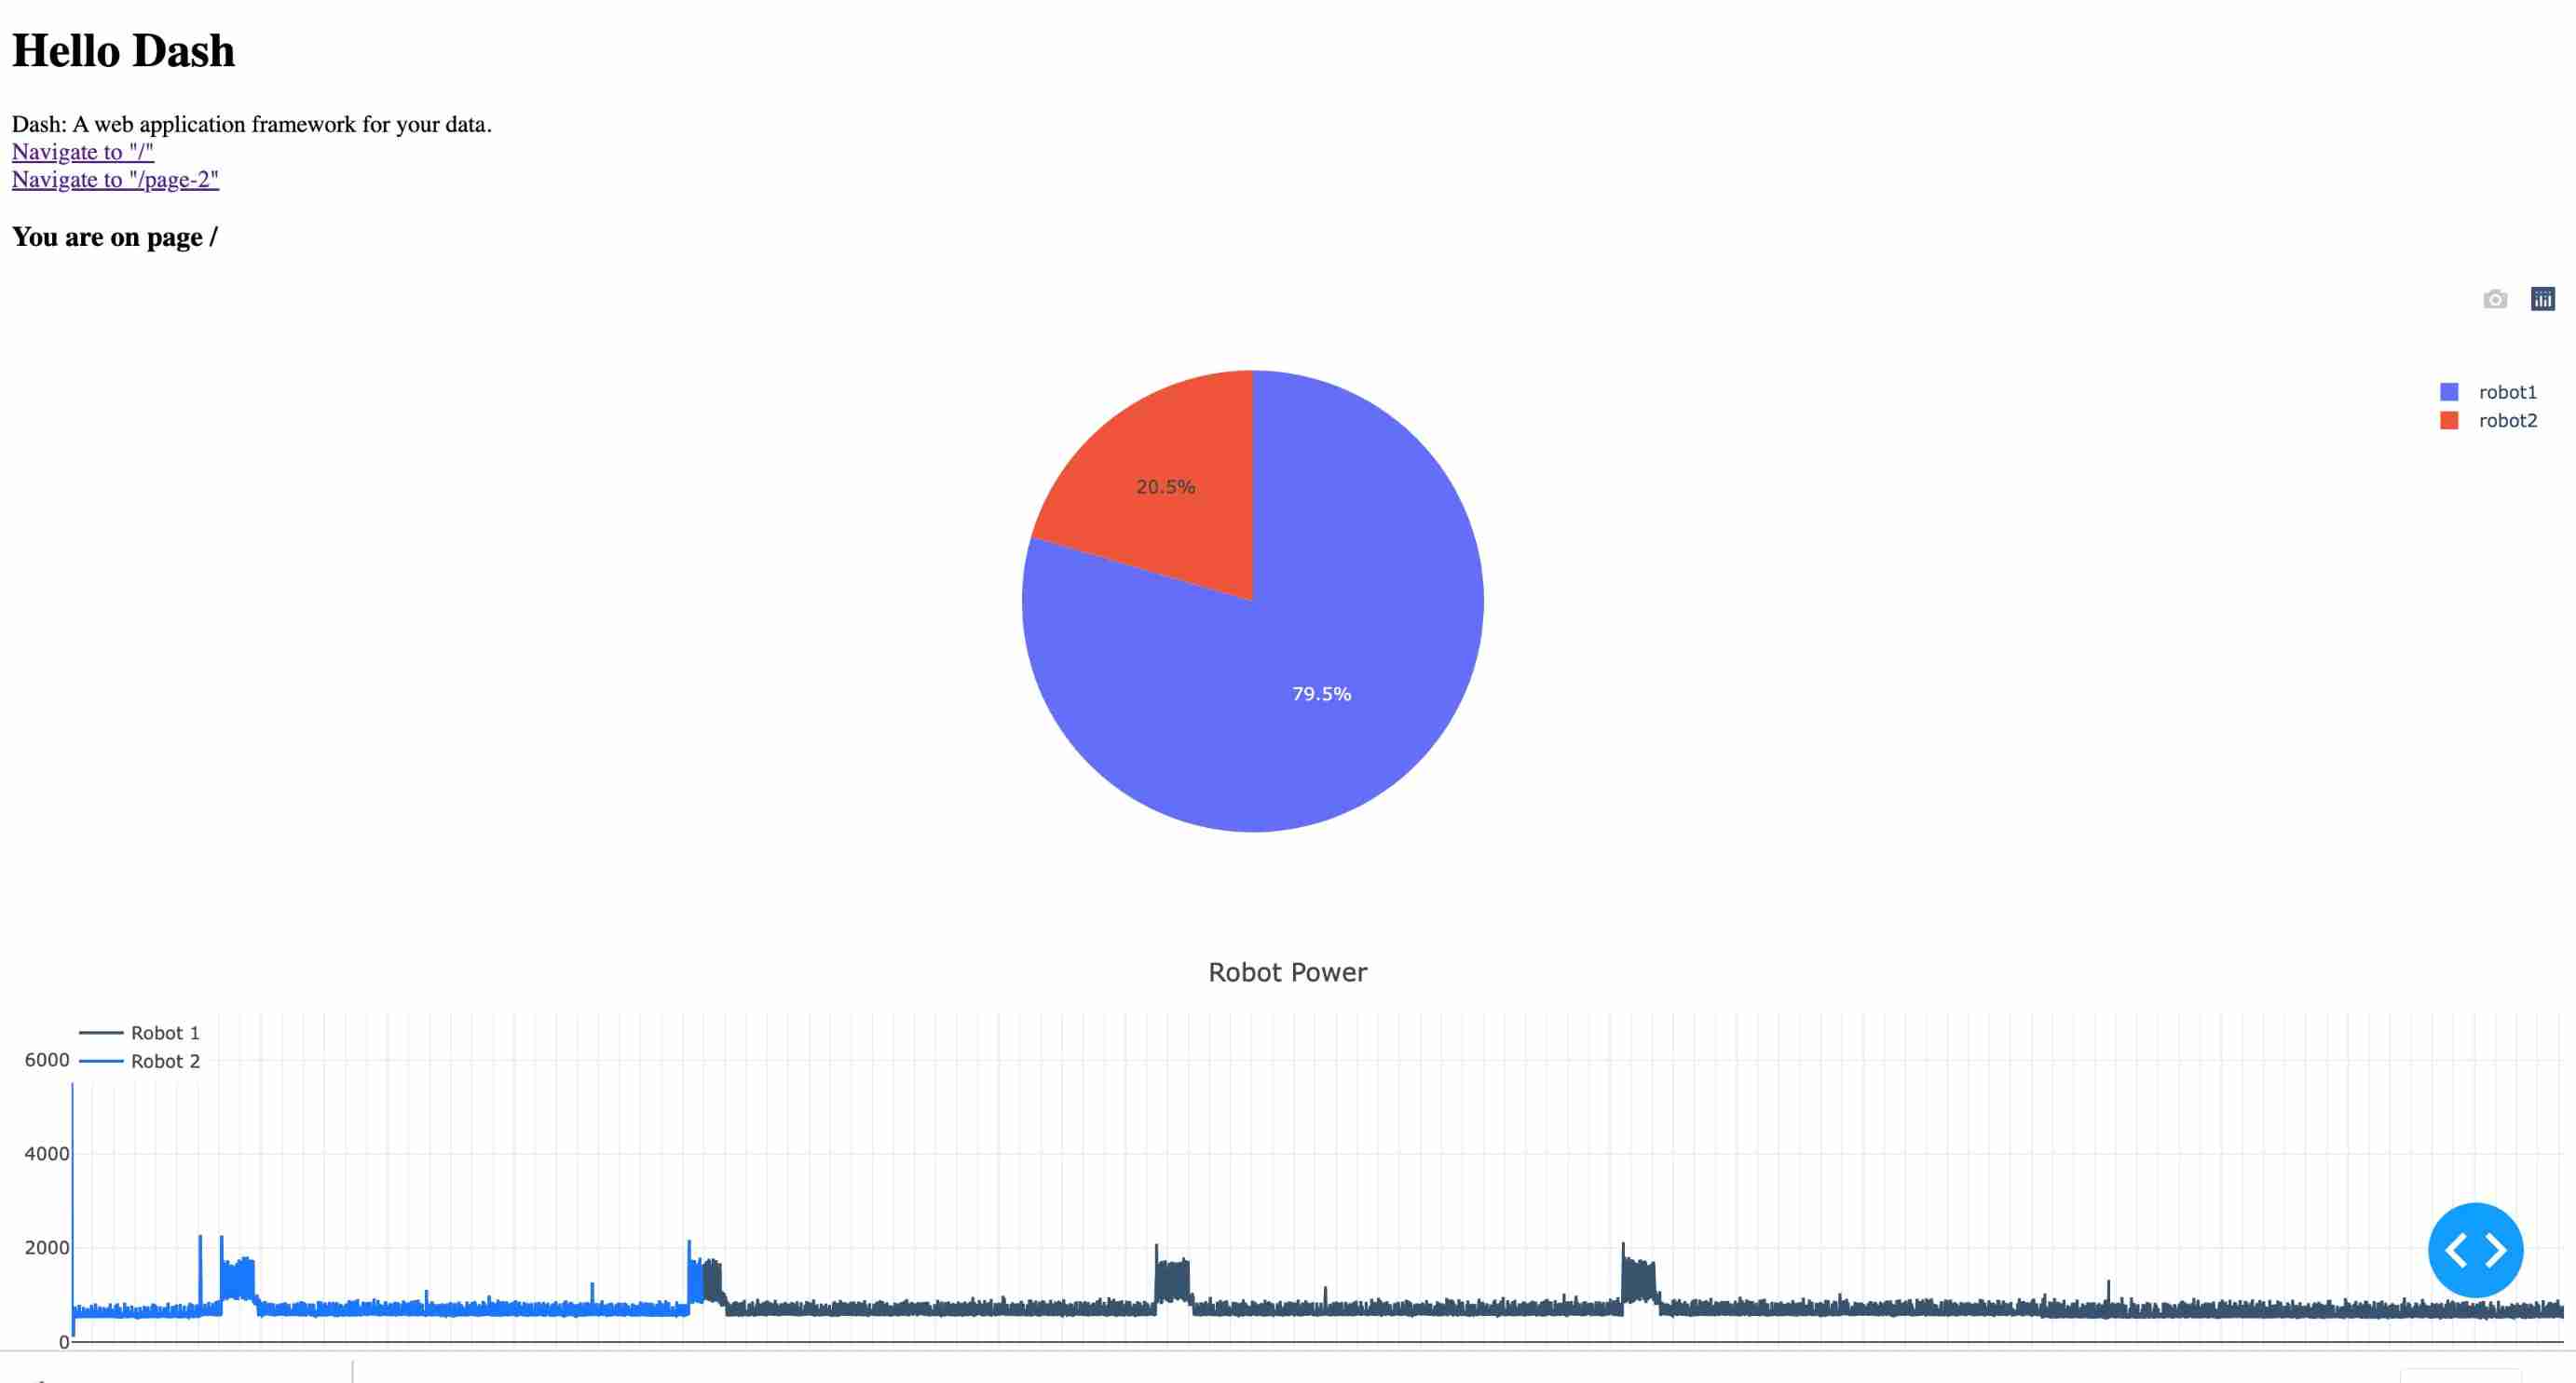
Page nav, PIE, and Line chart
from dash import Dash, dcc, html,callback, Input, Output
import pandas as pd
import plotly.express as px
app = Dash(__name__)
#
df = pd.read_csv ('robot.txt', sep =' ')
#
df2 = df.set_axis(['Time', 'Power', 'Robot'], axis=1, inplace=False)


#df3 = px.data.tips()

# fig = px.pie(df2, values='Power', names='Robot')
# fig.show()
#print(df3)

app.layout = html.Div([
html.H1(children='Hello Dash'),
    html.Div(children='''
      Dash: A web application framework for your data.
  '''),
    dcc.Location(id='url', refresh=False),

    dcc.Link('Navigate to "/"', href='/'),
    html.Br(),
    dcc.Link('Navigate to "/page-2"', href='/page-2'),

    # content will be rendered in this element
    html.Div(id='page-content'),

    dcc.Graph(

        figure = px.pie(df2, values='Power', names='Robot')
    ),
    dcc.Graph(
        figure=dict(
            data=[
                dict(
                    x=df2['Time'],
                    y=df2['Power'].loc[df2['Robot']=='robot1'],#df.loc[df['column_name'] == some_value]
                    name='Robot 1',
                    marker=dict(
                        color='rgb(55, 83, 109)'
                    )
                ),
                dict(
                    x=df2['Time'],
                    y=df2['Power'].loc[df2['Robot']=='robot2'],#df.loc[df['column_name'] == some_value]
                    name='Robot 2',
                    marker=dict(
                        color='rgb(26, 118, 255)'
                    )
                )
            ],
            layout=dict(
                title='Robot Power',
                showlegend=True,
                legend=dict(
                    x=0,
                    y=1.0
                ),
                margin=dict(l=40, r=0, t=40, b=30)
            )
        ),


        style={'height': 300},
        id='my-graph'
    )


])

@callback(Output('page-content', 'children'),
              [Input('url', 'pathname')])
def display_page(pathname):
    return html.Div([
        html.H3(f'You are on page {pathname}')
    ])

if __name__ == '__main__':
    app.run_server(debug=True)
PIE, and Line chart on differnet page


from dash import Dash, dcc, html, Input, Output, callback
import plotly.express as px
app = Dash(__name__, suppress_callback_exceptions=True)
import pandas as pd

df = pd.read_csv ('robot.txt', sep =' ')
#
df2 = df.set_axis(['Time', 'Power', 'Robot'], axis=1, inplace=False)


app.layout = html.Div([
    dcc.Location(id='url', refresh=False),
    html.Div(id='page-content')
])


index_page = html.Div([
    dcc.Link('Pie chart', href='/page-1'),
    html.Br(),
    dcc.Link('Line chart', href='/page-2'),
])

page_1_layout = html.Div([
    html.H1('Page 1'),
    dcc.Graph(

        figure=px.pie(df2, values='Power', names='Robot')
    ),
    html.Div(id='page-1-content'),
    html.Br(),
    dcc.Link('Go to Line chart', href='/page-2'),
    html.Br(),
    dcc.Link('Go back to home', href='/'),
])

@callback(Output('page-1-content', 'children'),
              [Input('page-1-dropdown', 'value')])
def page_1_dropdown(value):
    return f'You have selected {value}'


page_2_layout = html.Div([
    html.H1('Page 2'),
    dcc.Graph(
        figure=dict(
            data=[
                dict(
                    x=df2['Time'],
                    y=df2['Power'].loc[df2['Robot'] == 'robot1'],  # df.loc[df['column_name'] == some_value]
                    name='Robot 1',
                    marker=dict(
                        color='rgb(55, 83, 109)'
                    )
                ),
                dict(
                    x=df2['Time'],
                    y=df2['Power'].loc[df2['Robot'] == 'robot2'],  # df.loc[df['column_name'] == some_value]
                    name='Robot 2',
                    marker=dict(
                        color='rgb(26, 118, 255)'
                    )
                )
            ],
            layout=dict(
                title='Robot Power',
                showlegend=True,
                legend=dict(
                    x=0,
                    y=1.0
                ),
                margin=dict(l=40, r=0, t=40, b=30)
            )
        ),

        style={'height': 300},
        id='my-graph'
    ),
    html.Div(id='page-2-content'),
    html.Br(),
    dcc.Link('Go to Pie Chart', href='/page-1'),
    html.Br(),
    dcc.Link('Go back to home', href='/')
])

@callback(Output('page-2-content', 'children'),
              [Input('page-2-radios', 'value')])
def page_2_radios(value):
    return f'You have selected {value}'


# Update the index
@callback(Output('page-content', 'children'),
              [Input('url', 'pathname')])
def display_page(pathname):
    if pathname == '/page-1':
        return page_1_layout
    elif pathname == '/page-2':
        return page_2_layout
    else:
        return index_page
    # You could also return a 404 "URL not found" page here

if __name__ == '__main__':
    app.run_server(debug=True)
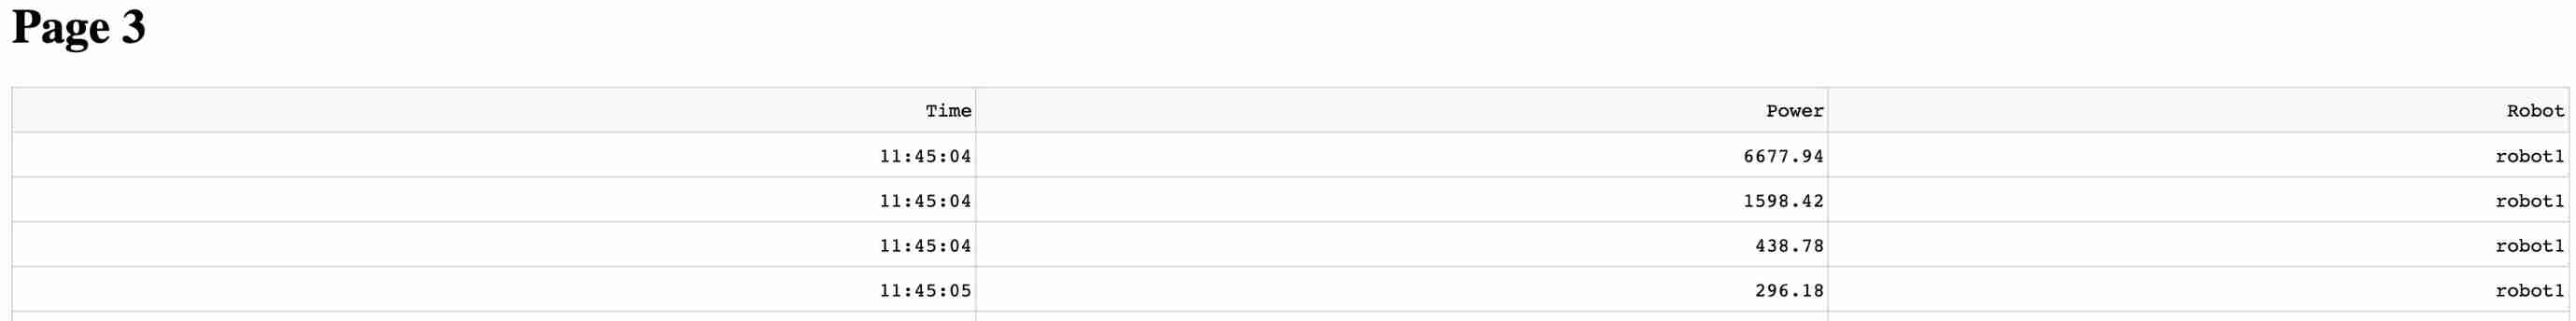
Table
| Energy consumed | Current energy | Current power | Current cost |
|---|---|---|---|
| Robot | End of the column | Dummy |
page_3_layout = html.Div([
    html.H1('Page 3'),
    dash_table.DataTable(df2.to_dict('records'), [{"name": i, "id": i} for i in df2.columns]),
    html.Div(id='page-3-content'),
    html.Br(),
    dcc.Link('Go to Line chart', href='/page-3'),
    html.Br(),
    dcc.Link('Go back to home', href='/'),
])

@callback(Output('page-3-content', 'children'),
              [Input('page-3-dropdown', 'value')])
def page_3_dropdown(value):
    return f'You have selected {value}'
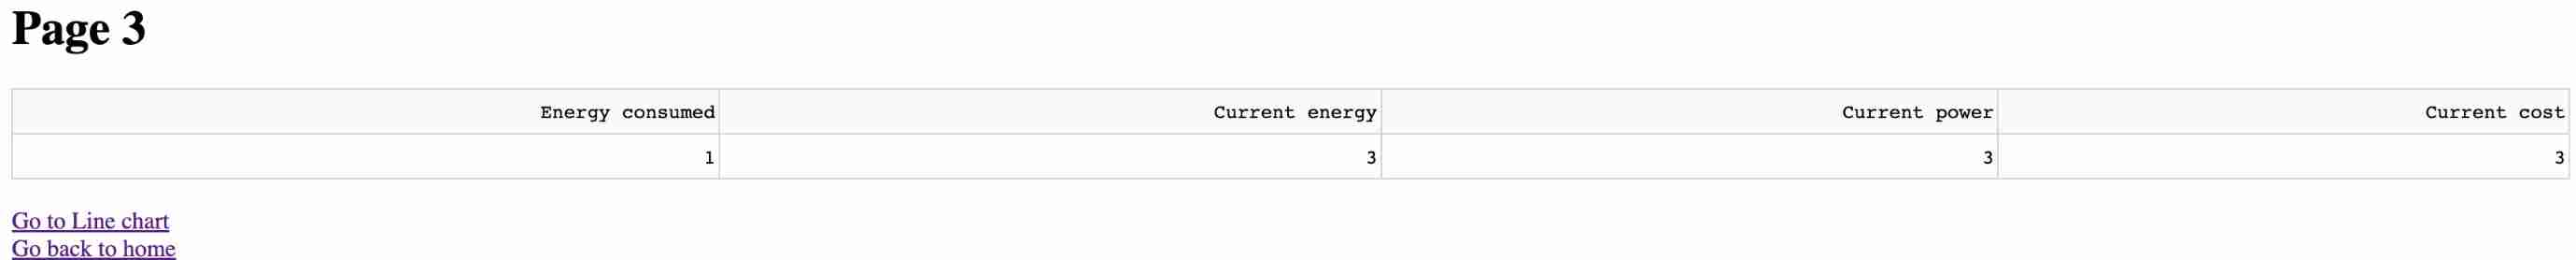
Updated Table
d = {'Energy consumed': [1], 'Current energy': [3],'Current power': [3],'Current cost': [3]}
df3=pd.DataFrame(data=d)

page_3_layout = html.Div([
    html.H1('Page 3'),
    dash_table.DataTable(df3.to_dict('records'), [{"name": i, "id": i} for i in df3.columns]),
    html.Div(id='page-3-content'),
    html.Br(),
    dcc.Link('Go to Line chart', href='/page-3'),
    html.Br(),
    dcc.Link('Go back to home', href='/'),
])

@callback(Output('page-3-content', 'children'),
              [Input('page-3-dropdown', 'value')])
def page_3_dropdown(value):
    return f'You have selected {value}'
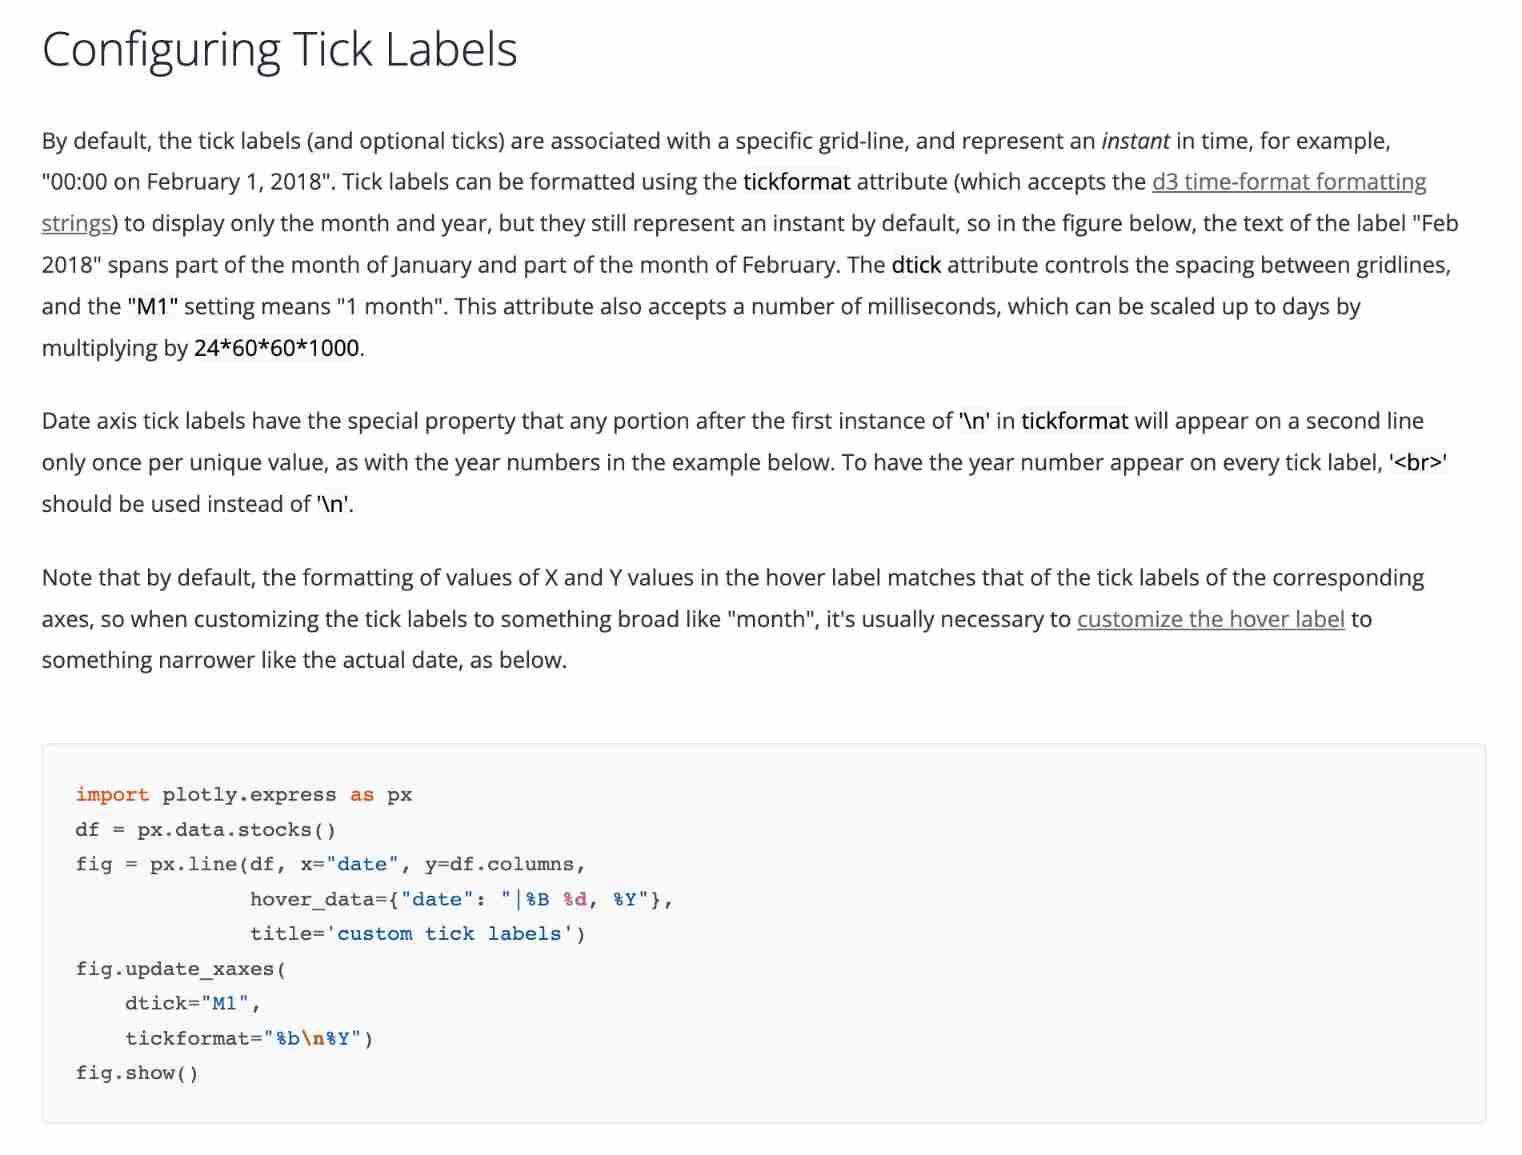
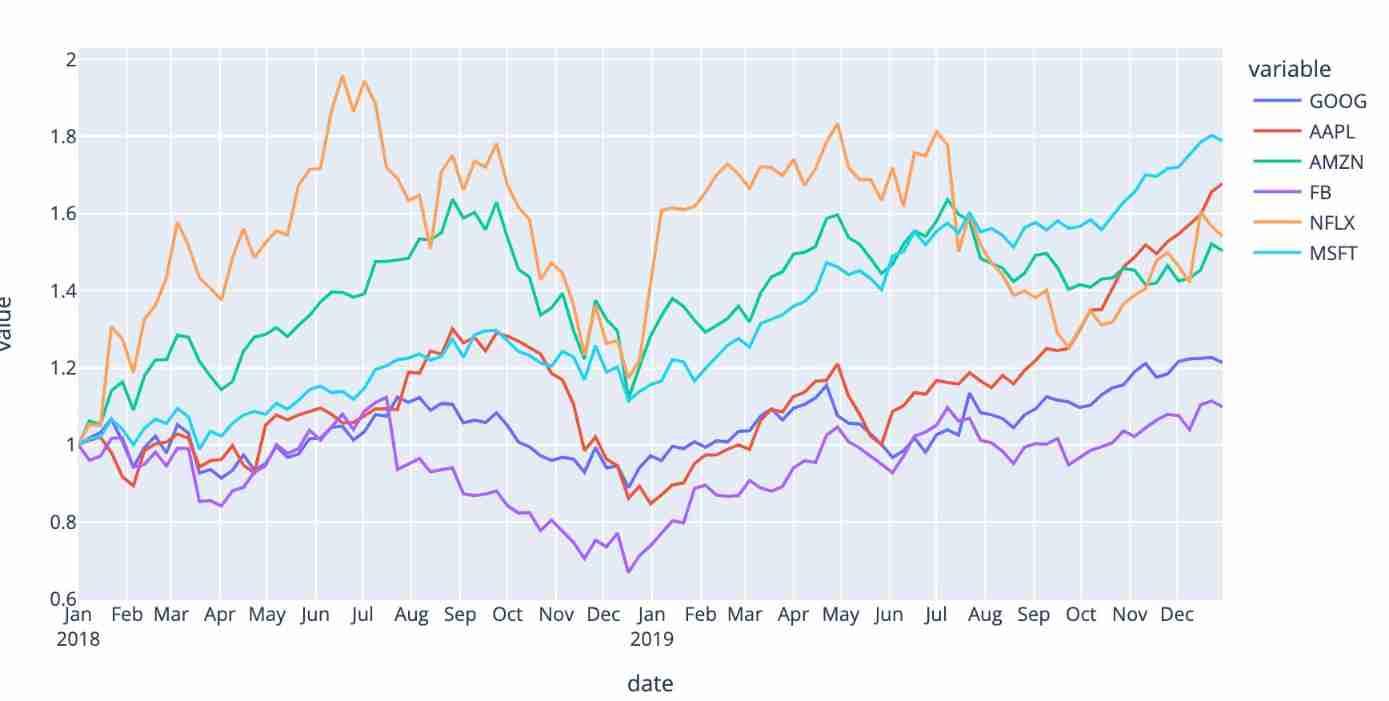
Change the timeseries x axis to hours
official website
import plotly.express as px
df = px.data.stocks()
fig = px.line(df, x="date", y=df.columns,
              hover_data={"date": "|%B %d, %Y"},
              title='custom tick labels')
fig.update_xaxes(
    dtick="M1",
    tickformat="%b\n%Y")
fig.show()
from dash import Dash, dcc, html, Input, Output, callback, dash_table
import plotly.express as px
app = Dash(__name__, suppress_callback_exceptions=True)
import pandas as pd
from example import *

df2 = read_example_csv()

# dataframe for total energy frame df3
d = {'Energy consumed': [1], 'Current energy': [3],'Current power': [3],'Current cost': [3]}
df3=pd.DataFrame(data=d)


# test for period
df_test = pd.read_csv('https://raw.githubusercontent.com/plotly/datasets/master/finance-charts-apple.csv')

fig = px.line(df2, x=df2.index, y='Power', title='Time Series with Range Slider and Selectors')

fig.update_xaxes(
    rangeslider_visible=True,
    rangeselector=dict(
        buttons=list([
            dict(count=1, label="1m", step="month", stepmode="backward"),
            dict(count=6, label="6m", step="month", stepmode="backward"),
            dict(count=1, label="YTD", step="year", stepmode="todate"),
            dict(count=1, label="1y", step="year", stepmode="backward"),
            dict(step="all")
        ])
    )
)


app.layout = html.Div([
    dcc.Location(id='url', refresh=False),
    html.Div(id='page-content')
])


index_page = html.Div([
    dcc.Link('Pie chart', href='/page-1'),
    html.Br(),
    dcc.Link('Line chart', href='/page-2'),
    html.Br(),
    dcc.Link('Table', href='/page-3'),
])

page_1_layout = html.Div([
    html.H1('Page 1'),
    dcc.Graph(

        figure=px.pie(df2, values='Power', names='Machine')
    ),
    html.Div(id='page-1-content'),
    html.Br(),
    dcc.Link('Go to Line chart', href='/page-2'),
    html.Br(),
    dcc.Link('Go back to home', href='/'),
])

@callback(Output('page-1-content', 'children'),
              [Input('page-1-dropdown', 'value')])
def page_1_dropdown(value):
    return f'You have selected {value}'


page_2_layout = html.Div([
    html.H1('Page 2'),

    # dcc.Graph(
    #     figure = px.line(df2, x=df2.index, y='Power', title='Time Series with Range Slider and Selectors')
    # ),
    dcc.Graph(
        figure=dict(
            data=[
                dict(
                    x=df2.index,
                    y=df2['Power'].loc[df2['Machine'] == 'robot1'],  # df.loc[df['column_name'] == some_value]
                    name='Robot 1',
                    marker=dict(
                        color='rgb(55, 83, 109)'
                    )
                ),
                dict(
                    x=df2.index,
                    y=df2['Power'].loc[df2['Machine'] == 'robot2'],  # df.loc[df['column_name'] == some_value]
                    name='Robot 2',
                    marker=dict(
                        color='rgb(26, 118, 255)'
                    )
                )
            ],
            layout=dict(
                title='Robot Power',
                showlegend=True,
                legend=dict(
                    x=0,
                    y=1.0
                ),
                margin=dict(l=40, r=0, t=40, b=30)
            )
        ),

        style={'height': 300},
        id='my-graph'
    ),


    html.Div(id='page-2-content'),
    html.Br(),
    dcc.Link('Go to Pie Chart', href='/page-1'),
    html.Br(),
    dcc.Link('Go back to home', href='/')
])

@callback(Output('page-2-content', 'children'),
              [Input('page-2-radios', 'value')])
def page_2_radios(value):
    return f'You have selected {value}'


page_3_layout = html.Div([
    html.H1('Page 3'),
    dash_table.DataTable(df3.to_dict('records'), [{"name": i, "id": i} for i in df3.columns]),
    html.Div(id='page-3-content'),
    html.Br(),
    dcc.Link('Go to Line chart', href='/page-3'),
    html.Br(),
    dcc.Link('Go back to home', href='/'),
])

@callback(Output('page-3-content', 'children'),
              [Input('page-3-dropdown', 'value')])
def page_3_dropdown(value):
    return f'You have selected {value}'


# Update the index
@callback(Output('page-content', 'children'),
              [Input('url', 'pathname')])
def display_page(pathname):
    if pathname == '/page-1':
        return page_1_layout
    elif pathname == '/page-2':
        return page_2_layout
    elif pathname == '/page-3':
        return page_3_layout
    else:
        return index_page
    # You could also return a 404 "URL not found" page here

if __name__ == '__main__':
    app.run_server(debug=True)
# Here add all required functions. example.py
import pandas as pd


def cost_function(df, dt=1, start='08:30:00', end='22:30:00', low_price=0.08, high_price=0.121):
    low1 = df.between_time('00:00:00', start)
    high = df.between_time(start, end)
    low2 = df.between_time(end, '23:59:59')
    # Calculate energy consumption(kWh) during different periods
    energy_low = (low1.Power.sum() + low2.Power.sum()) / (36 * 10 ** 5)
    energy_high = (high.Power.sum()) / (36 * 10 ** 5)
    cost_low = energy_low * low_price
    cost_high = energy_high * high_price
    cost = cost_low + cost_high
    return cost


def read_example_csv():
    df = pd.read_csv('example_data.csv', sep=',', index_col=0, parse_dates=True)
    return df


def state(current_power, threshold_dictionary={"off": [0, 200], "idle": [201, 500], "on": [501]}):
    off_upper_limit = threshold_dictionary.get("off")[1]
    idle_lower_limit = off_upper_limit + 1
    idle_upper_limit = threshold_dictionary.get("idle")[1]
    on_lower_limit = idle_upper_limit + 1
    if (current_power >= on_lower_limit):
        return "On"
    elif (current_power >= 201):
        return "Idle"
    else:
        return "Off"


def current_power(df):
    latest_time_df = df.index.max().strftime('%Y-%m-%d %X')
    total_current_power = latest_time_df.Power.sum()
    return total_current_power


def predict_cost(df):
    """need to upate"""
    return cost_function(df)


def summary(dataframe):
    total_energy = dataframe.Power.sum
    total_cost = cost_function(dataframe)
    instantaneous_power = current_power(dataframe)
    expected_cost = predict_cost(dataframe)
    data_dict = {"Total_Energy": total_energy, "Total_cost": total_cost, "Current_Power": instantaneous_power,
                 "Expected_Cost": expected_cost}
    return data_dict
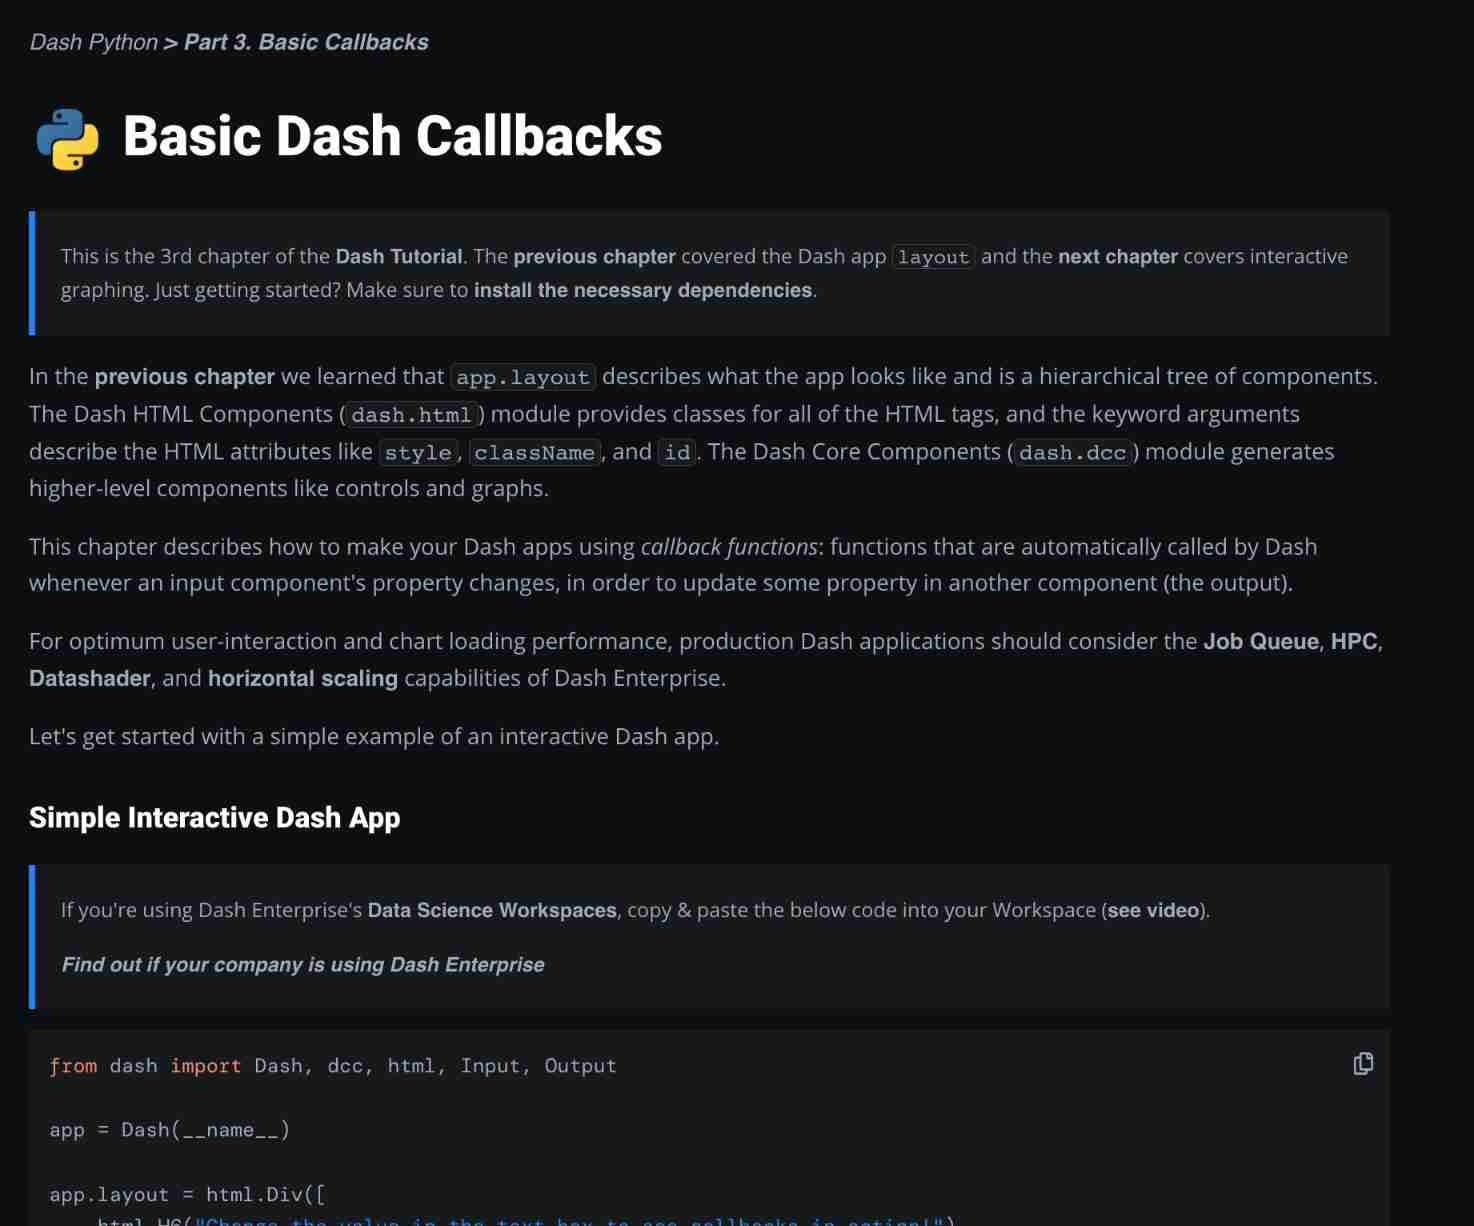
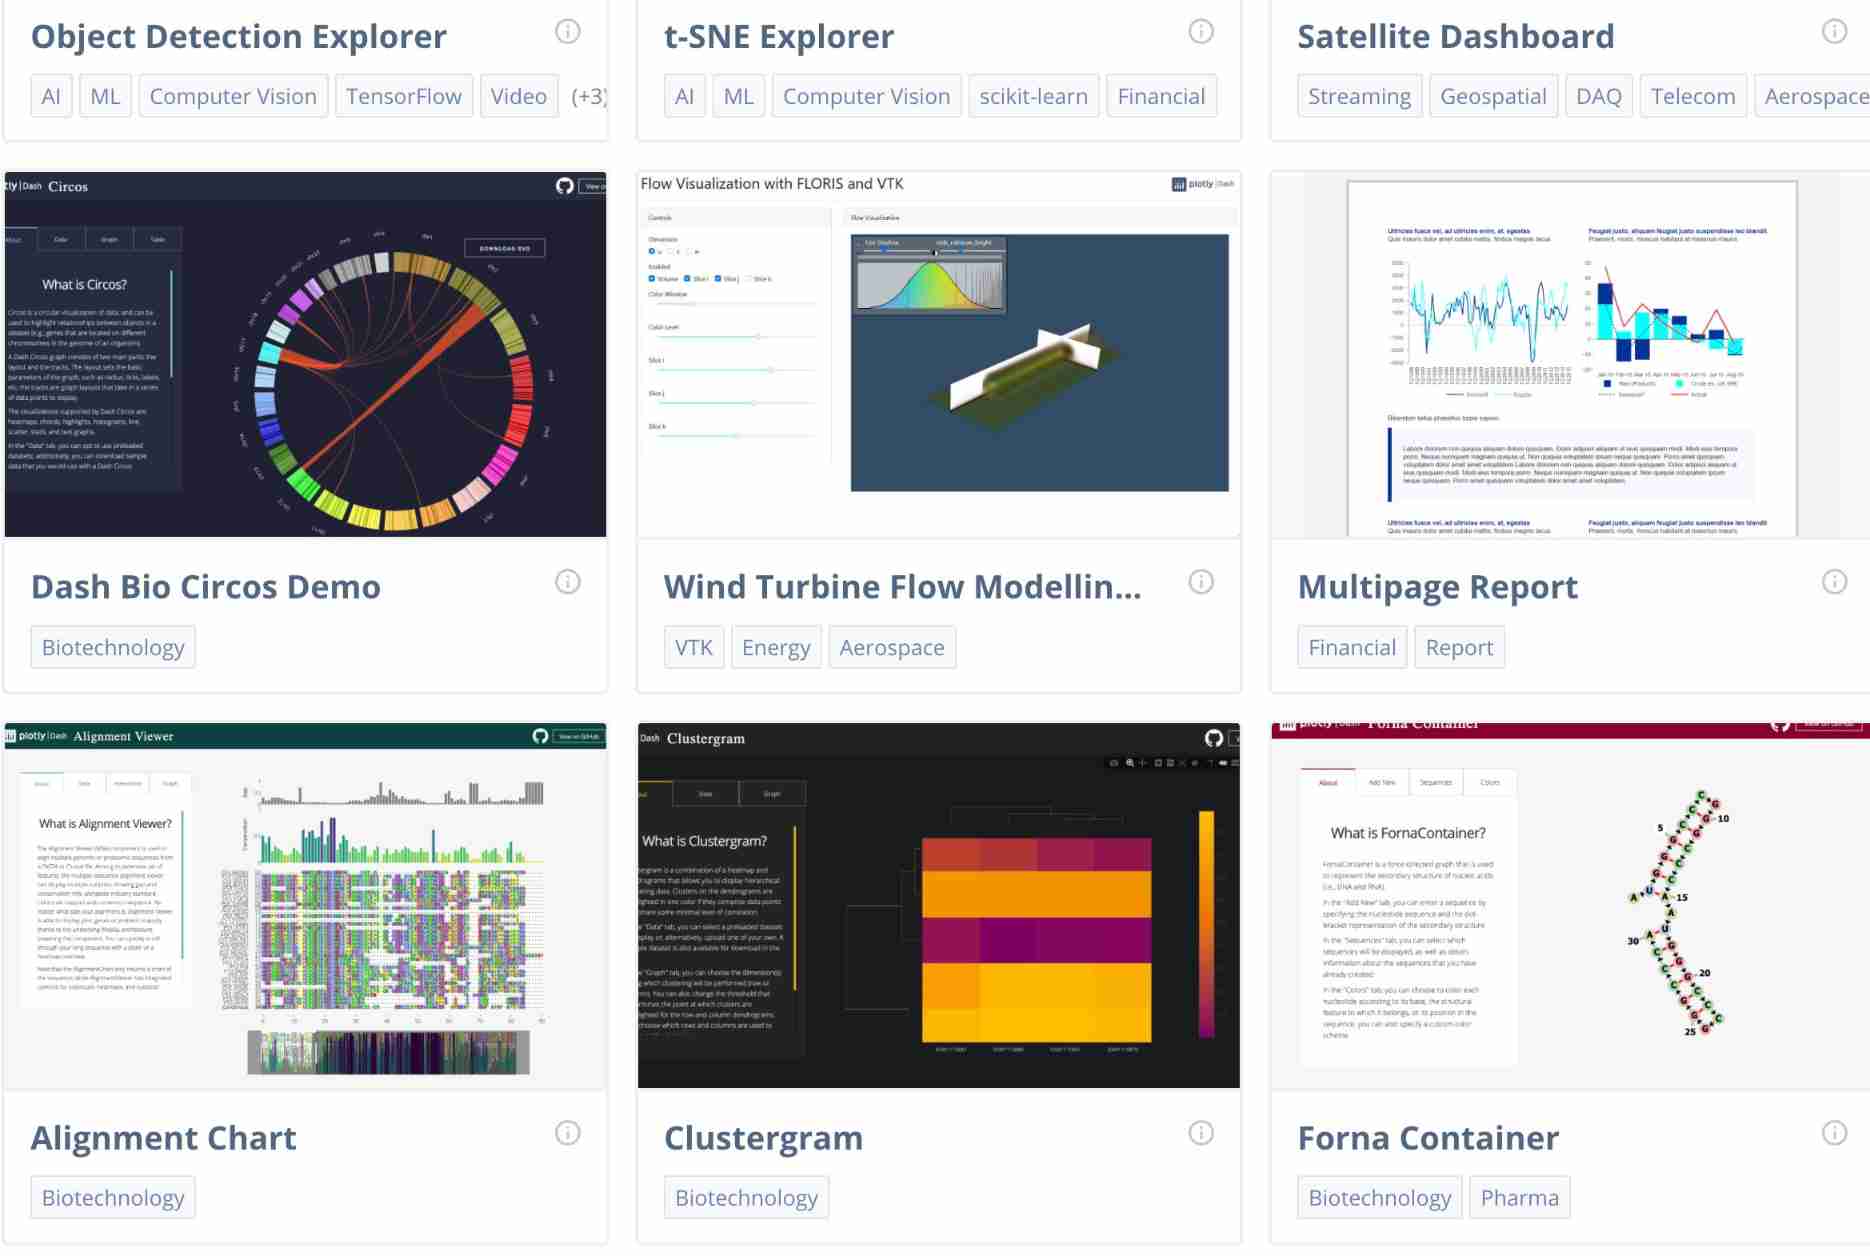
Notes from Python Dash
[ Failed to transfer the external chain picture , The origin station may have anti-theft chain mechanism , It is suggested to save the pictures and upload them directly (img-m3aXUuD6-1644684167119)(…/…/Library/Application%20Support/typora-user-images/image-20220212163814079.png)]
[ Failed to transfer the external chain picture , The origin station may have anti-theft chain mechanism , It is suggested to save the pictures and upload them directly (img-oQ6Y7J95-1644684167119)(…/…/Library/Application%20Support/typora-user-images/image-20220212163835117.png)]
[ Failed to transfer the external chain picture , The origin station may have anti-theft chain mechanism , It is suggested to save the pictures and upload them directly (img-cQpw81KP-1644684167119)(…/…/Library/Application%20Support/typora-user-images/image-20220212163913676.png)]
pd.read_csv('file_name.csv', usecols= ['column_name1','column_name2'])
pd.read_csv(path_to_import,usecols=columns, sep=';').to_csv('selected.csv', index=False)
df.rename({
    'a': 'X', 'b': 'Y'}, axis=1, inplace=True)
df

   X  Y  c  d  e
0  x  x  x  x  x
1  x  x  x  x  x
2  x  x  x  x  x
max(list)
import plotly.express as px
# This dataframe has 244 lines, but 4 distinct values for `day`
df = px.data.tips()
fig = px.pie(df, values='tip', names='day')
fig.show()
Date-Time,Power,Machine
12/02/2022 00:00:00,1321.08,robot1
12/02/2022 00:00:01,28354.84,robot1
12/02/2022 00:00:02,6677.94,robot1
12/02/2022 00:00:03,1598.42,robot1
12/02/2022 00:00:04,438.78,robot1
12/02/2022 00:00:05,296.18,robot1
12/02/2022 00:00:06,269.7,robot1
12/02/2022 00:00:07,160.68,robot1
12/02/2022 00:00:08,270.38,robot1
12/02/2022 00:00:09,274.82,robot1
12/02/2022 00:00:10,271.99,robot1
12/02/2022 00:00:11,273.28,robot1
12/02/2022 00:00:12,121.88,robot1
12/02/2022 00:00:13,261.44,robot1
12/02/2022 00:00:14,252.33,robot1
from dash import Dash, dcc, html, Input, Output
import plotly.express as px
import pandas as pd
df = pd.read_csv(‘https://raw.githubusercontent.com/plotly/datasets/master/gapminderDataFiveYear.csv’)
app = Dash(name)
app.layout = html.Div([
dcc.Graph(id=‘graph-with-slider’),
dcc.Slider(
df[‘year’].min(),
df[‘year’].max(),
step=None,
value=df[‘year’].min(),
marks={str(year): str(year) for year in df[‘year’].unique()},
id=‘year-slider’
)
])
@app.callback(
Output(‘graph-with-slider’, ‘figure’),
Input(‘year-slider’, ‘value’))
def update_figure(selected_year):
filtered_df = df[df.year == selected_year]
fig = px.scatter(filtered_df, x="gdpPercap", y="lifeExp",
                 size="pop", color="continent", hover_name="country",
                 log_x=True, size_max=55)

fig.update_layout(transition_duration=500)

return fig
if name == ‘main’:
app.run_server(debug=True)
from dash import Dash, dash_table
import pandas as pd
df = pd.read_csv(‘https://raw.githubusercontent.com/plotly/datasets/master/solar.csv’)
app = Dash(name)
app.layout = dash_table.DataTable(df.to_dict(‘records’), [{“name”: i, “id”: i} for i in df.columns])
if name == ‘main’:
app.run_server(debug=True)
d = {'col1': [1, 2], 'col2': [3, 4]}
df = pd.DataFrame(data=d)
df
   col1  col2
0     1     3
1     2     4
边栏推荐
- 1140_ SiCp learning notes_ Use Newton's method to solve the square root
- nacos
- 按键精灵采集学习-矿药采集及跑图
- 【经验分享】如何为visio扩展云服务图标
- What is the difference between TCP and UDP?
- 1142_ SiCp learning notes_ Functions and processes created by functions_ Linear recursion and iteration
- MobaXterm
- 探索Cassandra的去中心化分布式架构
- 【斯坦福计网CS144项目】Lab3: TCPSender
- Resource create package method
猜你喜欢

![[mathematical notes] radian](/img/43/2af510adb24fe46fc0033d11d60488.jpg)
![[unity] several ideas about circular motion of objects](/img/84/e70c6696629dbe17ace011553f43ff.png)

![[webrtc] m98 Screen and Window Collection](/img/b1/1ca13b6d3fdbf18ff5205ed5584eef.png)
随机推荐
测试周期被压缩?教你9个方法去应对
Leetcode sword finger offer brush questions - day 20
MobaXterm
2022-07-06:以下go语言代码是否会panic?A:会;B:不会。 package main import “C“ func main() { var ch chan struct
misc ez_ usb
[performance pressure test] how to do a good job of performance pressure test?
Hands on deep learning (IV) -- convolutional neural network CNN
Wechat applet data binding multiple data
mysql多列索引(组合索引)特点和使用场景
Sign up now | oar hacker marathon phase III, waiting for your challenge
Pytorch parameter initialization
探索Cassandra的去中心化分布式架构
Is the test cycle compressed? Teach you 9 ways to deal with it
2022-07-06: will the following go language codes be panic? A: Meeting; B: No. package main import “C“ func main() { var ch chan struct
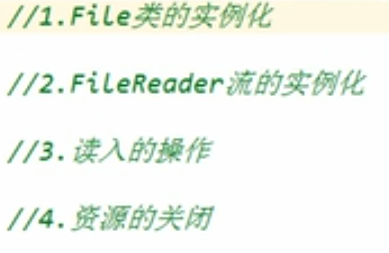
IO流 file
gslx680触摸屏驱动源码码分析(gslX680.c)
【斯坦福计网CS144项目】Lab3: TCPSender
About some details of final, I have something to say - learn about final CSDN creation clock out from the memory model
Detailed explanation of Kalman filter for motion state estimation
Leanote private cloud note building