当前位置:网站首页>5. Logistic regression
5. Logistic regression
2022-07-05 23:38:00 【CGOMG】
What is logical regression

Application scenarios

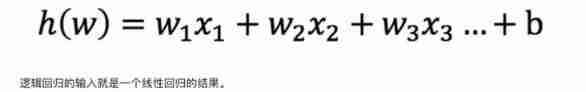
The principle of logical regression
Master logistic regression , You must master the following two points
- In logical regression , What is the input value
- How to judge the output of logistic regression
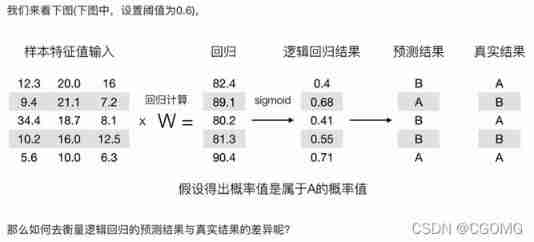
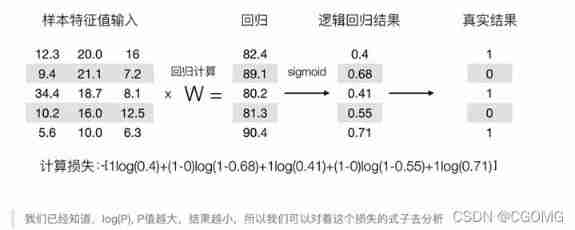
Input
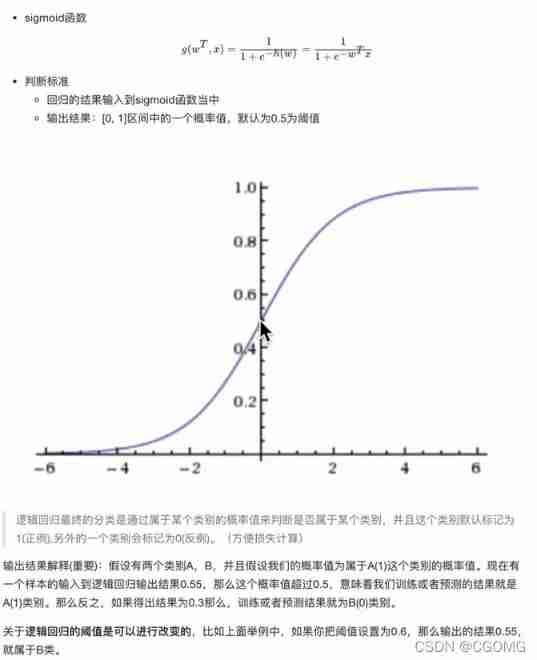
Activation function
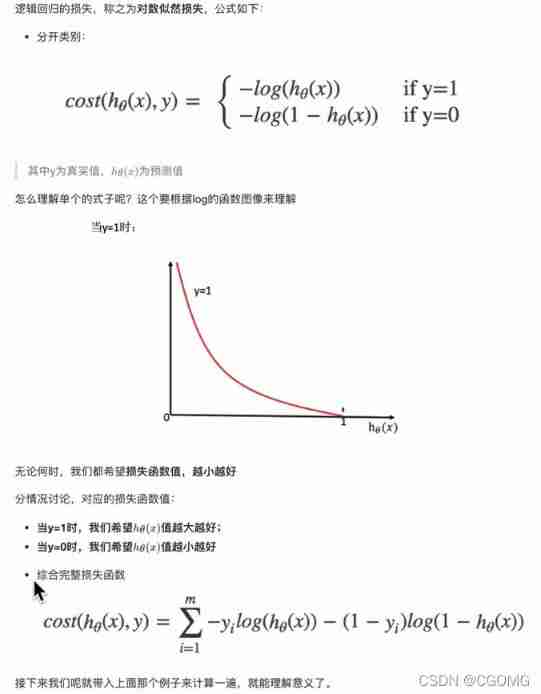
Measure losses
Loss
Optimize

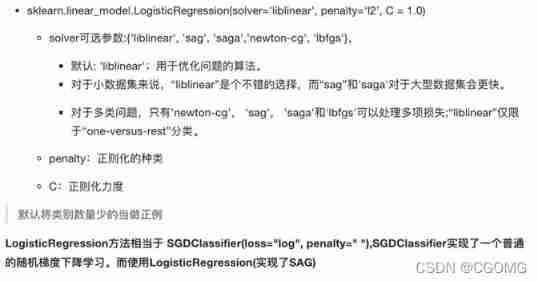
API
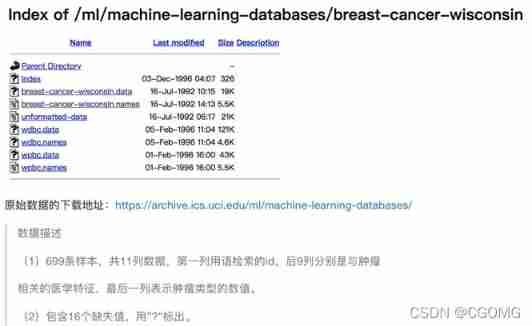
Tumor prediction cases
Data is introduced
Code implementation
import pandas as pd
import numpy as np
from sklearn.model_selection import train_test_split
from sklearn.preprocessing import StandardScaler
from sklearn.linear_model import LogisticRegression
# get data
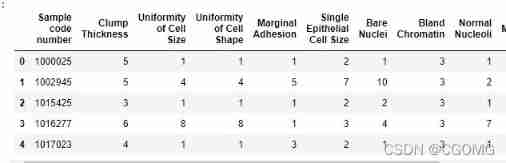
names = ['Sample code number', 'Clump Thickness', 'Uniformity of Cell Size', 'Uniformity of Cell Shape','Marginal Adhesion', 'Single Epithelial Cell Size', 'Bare Nuclei', 'Bland Chromatin','Normal Nucleoli', 'Mitoses', 'Class']
data = pd.read_csv("https://archive.ics.uci.edu/ml/machine-learning-databases/breast-cancer-wisconsin/breast-cancer-wisconsin.data",names=names)
data.head()
# Basic data processing
# Missing value processing
data = data.replace(to_replace="?",value=np.nan)
data = data.dropna()
# Determine eigenvalue , The target
x = data.iloc[:,1:-1]
y = data["Class"]
# Split data
x_train,x_test,y_train,y_test = train_test_split(x,y,random_state=22,test_size=0.2)
# Feature Engineering Standardization
transfer = StandardScaler()
x_train = transfer.fit_transform(x_train)
x_test = transfer.transform(x_test)
# machine learning
estmator = LogisticRegression()
estmator.fit(x_train,y_train)
# Model to evaluate
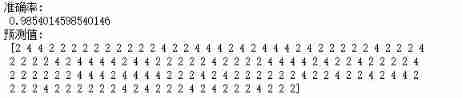
print(" Accuracy rate :\n",estmator.score(x_test,y_test))
print(" Predictive value :\n",estmator.predict(x_test))
Evaluation method
Accuracy and recall rate
Confusion matrix
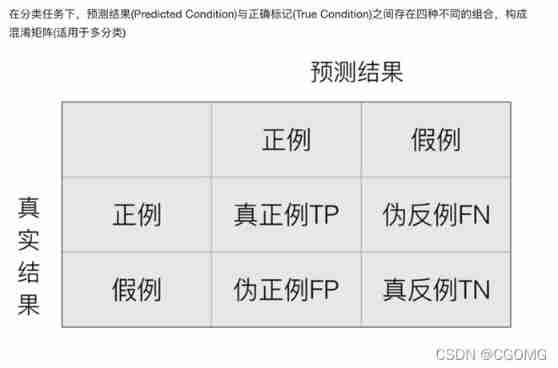
The accuracy formula we used before is :(TP+TN)/(TP+Fn+FP+TN)
Accuracy (Precision) And recall rate (Recall)
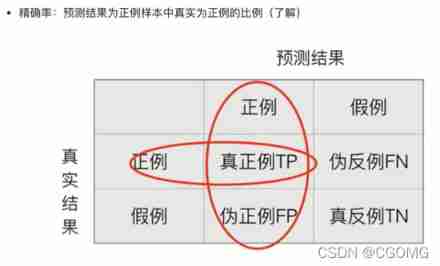
Accuracy :(TP)/(TP+FP)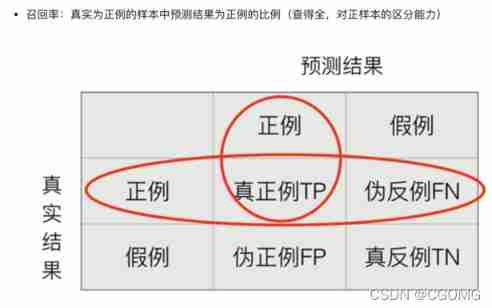
Recall rate :(TP)/(TP+FN)
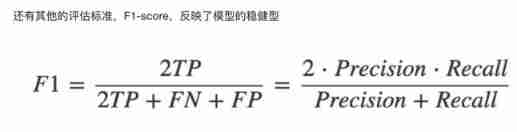
F1-score
Classification assessment report api
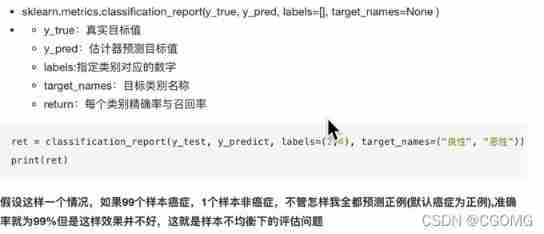
from sklearn.metrics import classification_report
y_pre = estmator.predict(x_test)
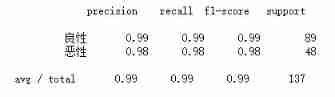
ret = classification_report(y_test,y_pre,labels=(2,4),target_names=(" Benign "," Malignant "))
print(ret)
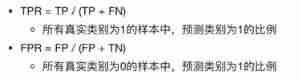
ROC Curve and AUC indicators
TPR And FPR
ROC curve
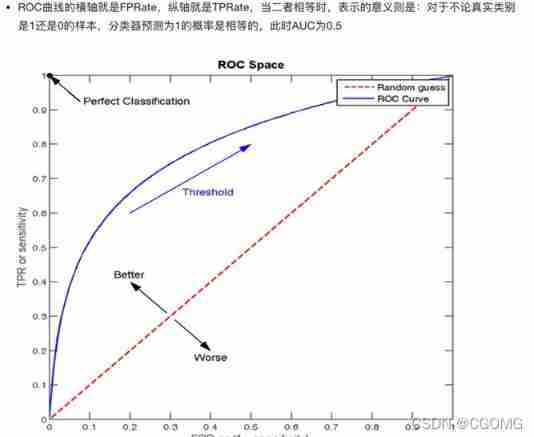
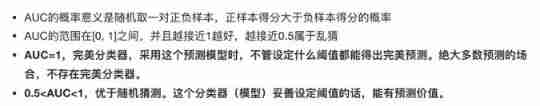
AUC indicators
AUC Calculation API
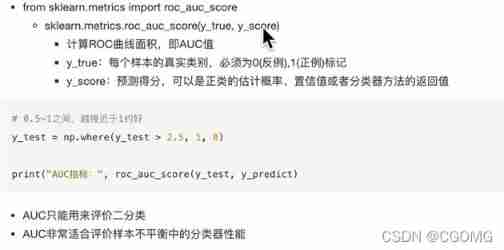
from sklearn.metrics import roc_auc_score
y_test = np.where(y_test>3,1,0)
roc_auc_score(y_test,y_pre)

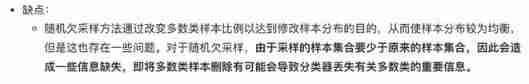
Solve the problem of category imbalance
pip3 install imbalanced-learn
Prepare category imbalance data
from sklearn.datasets import make_classification
import matplotlib.pylab as plt
from collections import Counter
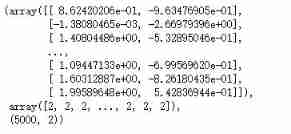
X,Y = make_classification(n_samples=5000,
n_features=2, # The number of features = n_informative()+ n_redundant()+ n_repeated()
n_informative=2,# Number of multi-information features
n_redundant=0,# Redundant information ,informative Random linear combination of features
n_repeated=0,# Duplicate information , Random extraction n_informative and n_redundant features
n_classes=3,# Classification categories
n_clusters_per_class=1,# A certain category is composed of several cluster Composed of
weights=[0.01,0.05,0.94],# List the type , Weight ratio
random_state=0)
X,Y,X.shape
Counter(y)

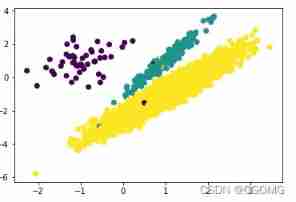
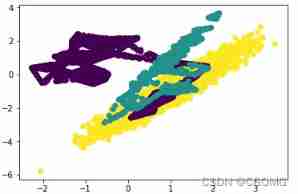
#  Data visualization
plt.scatter(X[:,0],X[:,1],c=Y)
plt.show()
terms of settlement
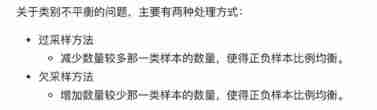
Oversampling method

Random oversampling method

from imblearn.over_sampling import RandomOverSampler
ros = RandomOverSampler(random_state=0)
X_resampled,Y_resampled = ros.fit_resample(X,Y)
Counter(Y_resampled)
#  Data visualization
plt.scatter(X_resampled[:,0],X_resampled[:,1],c=Y_resampled)
plt.show()
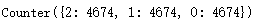
Oversampling representative algorithm -SMOTE
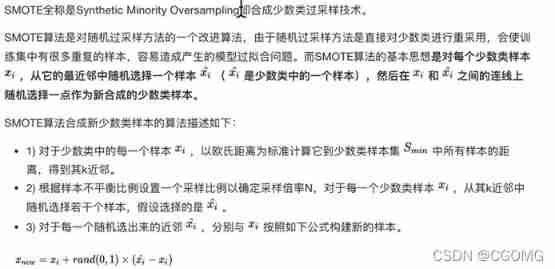
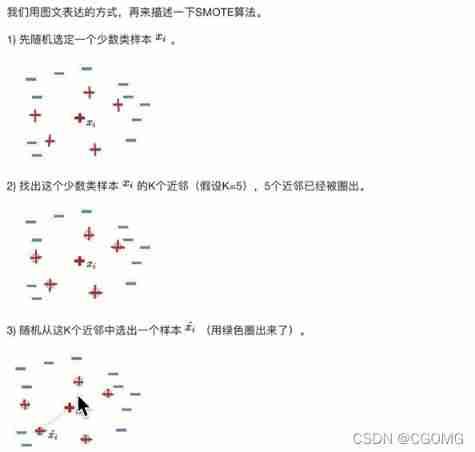

from imblearn.over_sampling import SMOTE

X_resampled,Y_resampled = SMOTE().fit_resample(X,Y)
Counter(Y_resampled)
#  Data visualization
plt.scatter(X_resampled[:,0],X_resampled[:,1],c=Y_resampled)
plt.show()
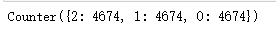
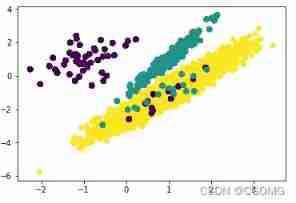
Under sampling method

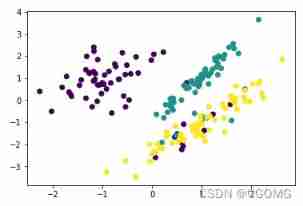
Random undersampling method

from imblearn.under_sampling import RandomUnderSampler
rus = RandomUnderSampler(random_state=0)
X_resampled,Y_resampled = rus.fit_resample(X,Y)
Counter(Y_resampled)

#  Data visualization
plt.scatter(X_resampled[:,0],X_resampled[:,1],c=Y_resampled)
plt.show()
边栏推荐
- 秒杀系统的设计与实现思路
- GFS分布式文件系统
- (4)UART应用设计及仿真验证2 —— TX模块设计(无状态机)
- Objective C message dispatch mechanism
- 做自媒体影视短视频剪辑号,在哪儿下载素材?
- 21. PWM application programming
- 开关电源Buck电路CCM及DCM工作模式
- CIS benchmark tool Kube bench
- Hcip course notes-16 VLAN, three-tier architecture, MPLS virtual private line configuration
- GFS distributed file system
猜你喜欢
GFS分布式文件系統
【经典控制理论】自控实验总结
From the perspective of quantitative genetics, why do you get the bride price when you get married
Object detection based on impulse neural network
2: Chapter 1: understanding JVM specification 1: introduction to JVM;
20.移植Freetype字体库
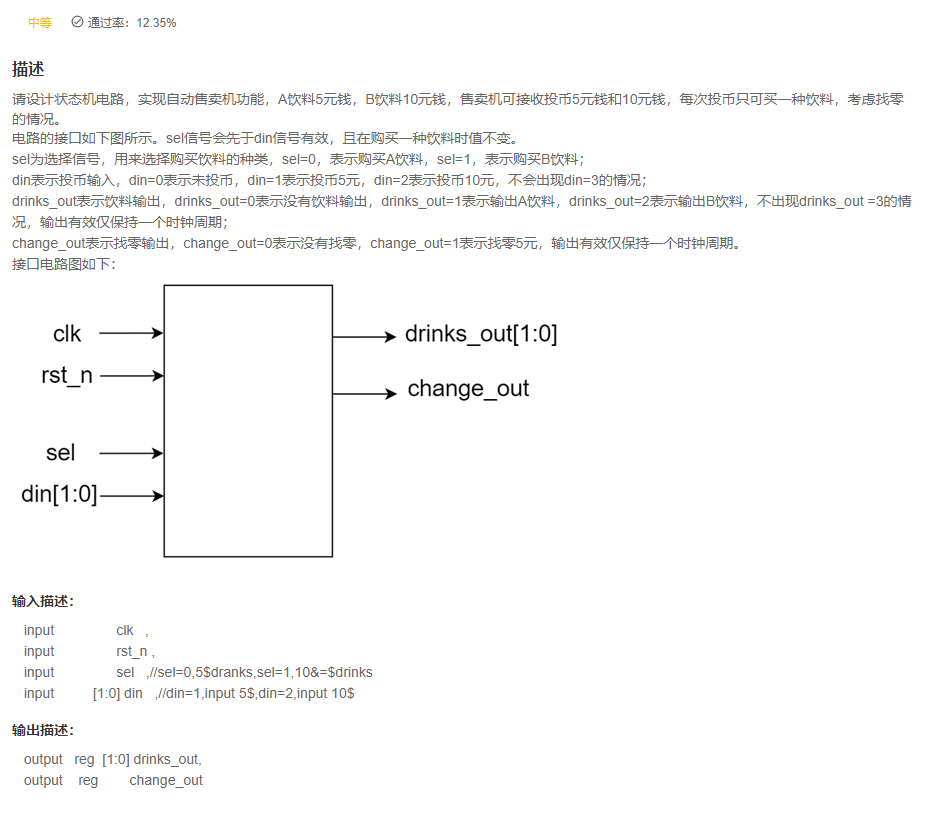
Part III Verilog enterprise real topic of "Niuke brush Verilog"
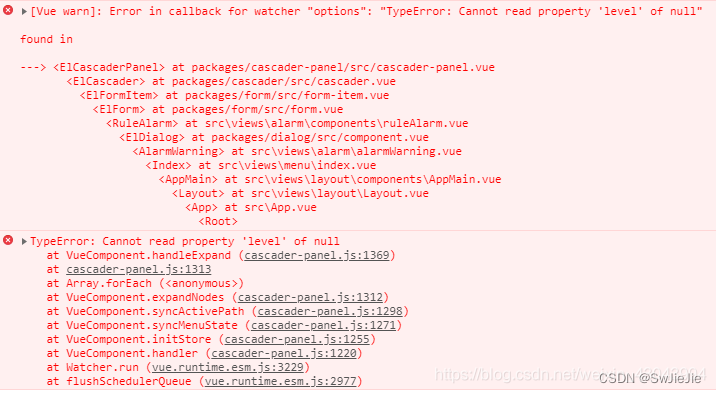
el-cascader的使用以及报错解决

CIS benchmark tool Kube bench
Fiddler Everywhere 3.2.1 Crack
随机推荐
Dynamic planning: robbing families and houses
Différence entre hors bande et en bande
Redis高可用——主从复制、哨兵模式、集群
芯源&立创EDA训练营——无刷电机驱动
Data analysis - Thinking foreshadowing
MySQL replace primary key delete primary key add primary key
无刷驱动设计——浅谈MOS驱动电路
11gR2 Database Services for " Policy" and " Administrator" Managed databases (file I
《牛客刷verilog》Part III Verilog企业真题
golang代码检查工具
Naoqi robot summary 26
Why use weak pointers for delegation- Why use weak pointer for delegation?
In C#, why can't I modify the member of a value type instance in a foreach loop?
The PostgreSQL column reference 'ID' is ambiguous - PostgreSQL column reference'id'is ambiguous
(4)UART应用设计及仿真验证2 —— RX模块设计(无状态机)
JVM的简介
asp.net弹出层实例
Practice of concurrent search
Xinyuan & Lichuang EDA training camp - brushless motor drive
Golang code checking tool