当前位置:网站首页>Shutter - canvas custom graph
Shutter - canvas custom graph
2022-07-02 10:35:00 【Huaijun】
Development background
Company functional requirements development ; Ask to pass Flutter Control Canvas Realize the graph , Scale track, etc UI;
design sketch 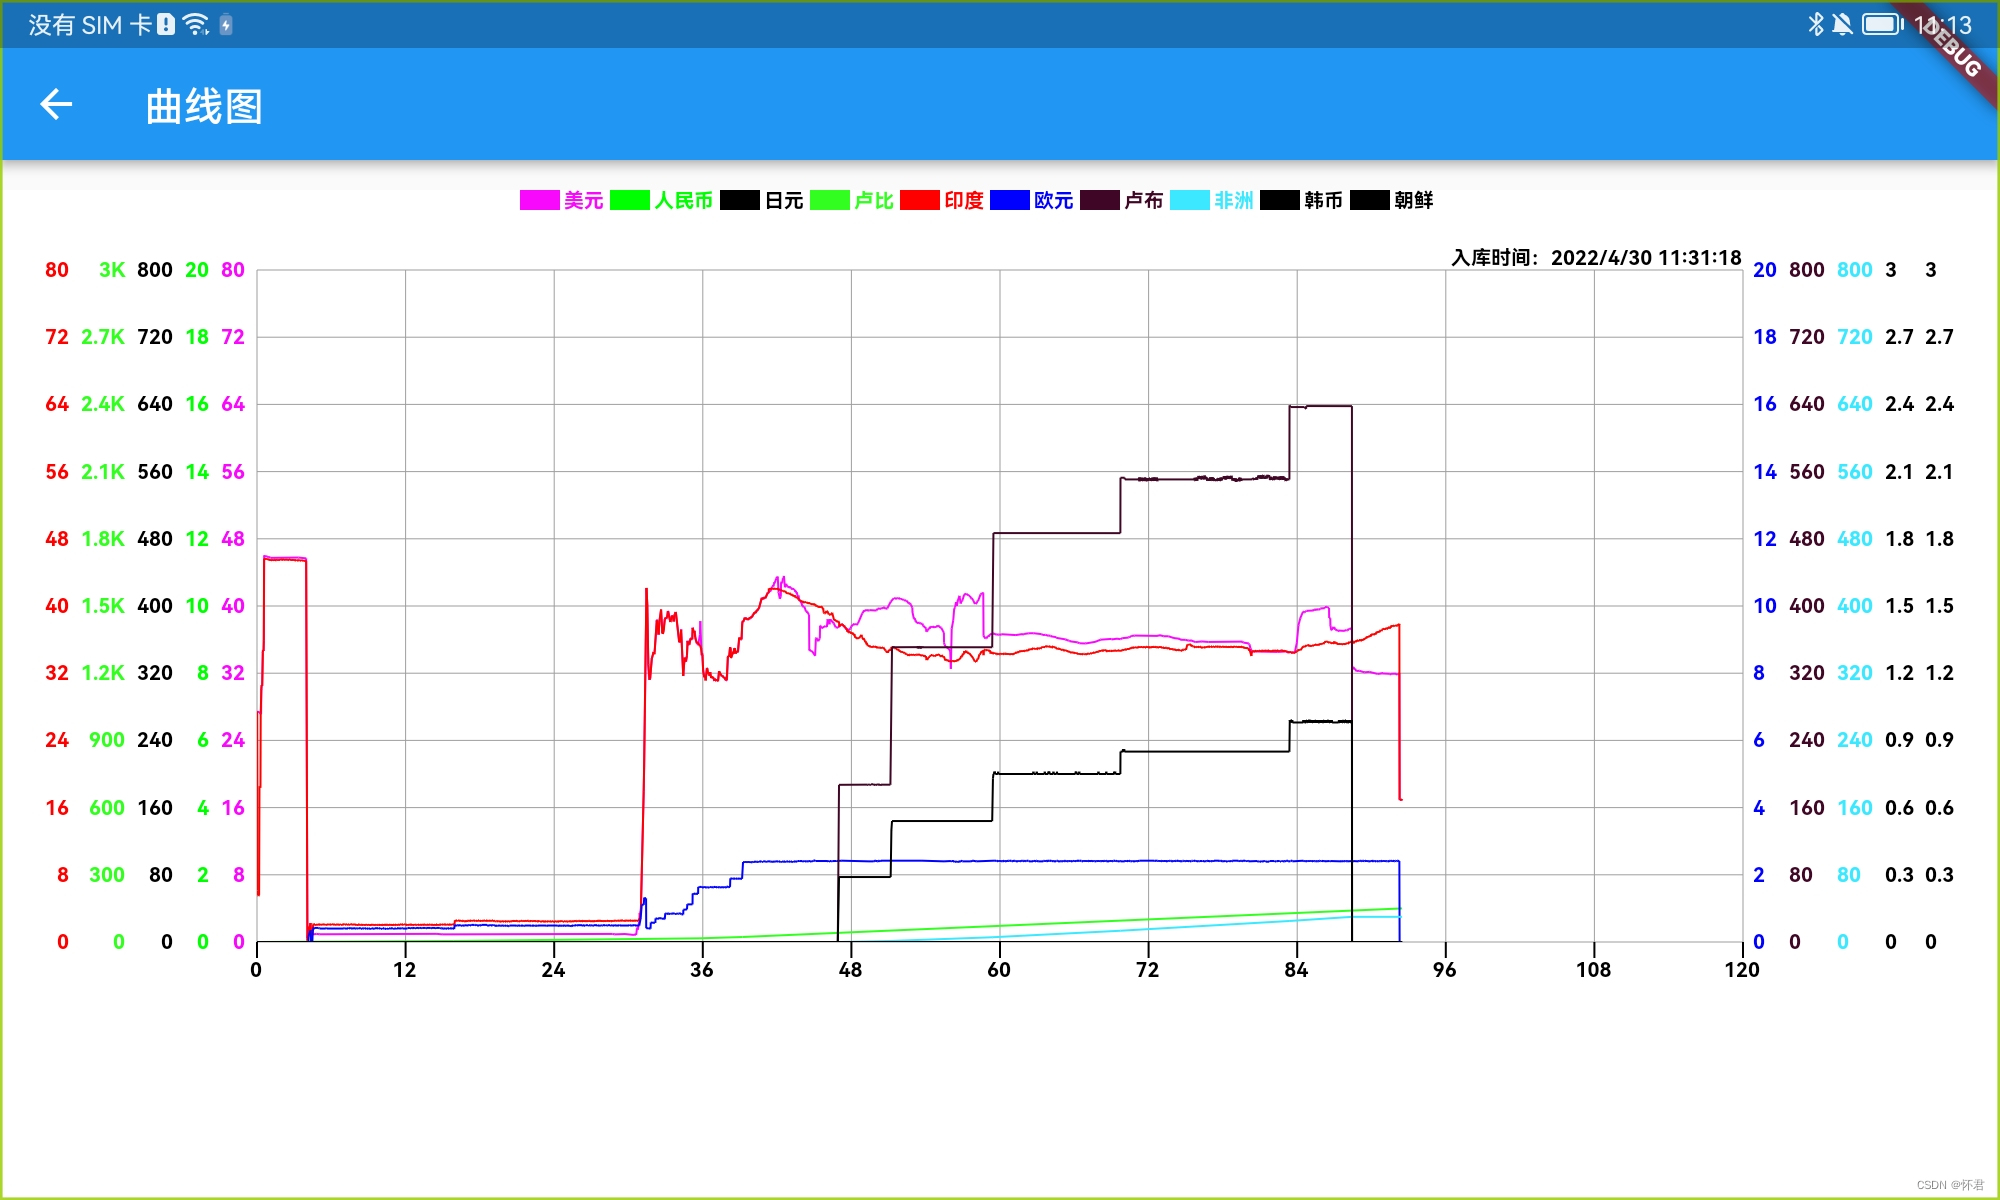
- The first step is to realize the coordinate system ;
Realize the coordinate system , Four points from the top left to the bottom right ;
  /// Origin coordinates
  Offset? pointOrigin;

  /// The left coordinate of the top of the origin
  Offset? pointTopLeft;

  /// Coordinates on the right of the top of the origin
  Offset? pointTopRight;

  /// Coordinates on the right of the bottom of the origin
  Offset? pointBottomRight;

  /// Coordinate system of canvas Rect
  Rect? paintRect;

  ///1、 Initialize the four points on the canvas
  initPoint() {
    pointOrigin = fracturingModel.pointOrigin;
    pointTopLeft = fracturingModel.pointTopLeft;
    pointTopRight = fracturingModel.pointTopRight;
    pointBottomRight = fracturingModel.pointBottomRight;
    paintRect = fracturingModel.paintRect;
  }
- The second step is to realize the top type identification UI;
design sketch
What needs to be noted here is **drawText()** Method , The implementation method will be posted later ;

  ///2、 Top type style
  void initDrawTopText() {
    ///1. Get JSON data
    var fracturingMaxList = fracturingModel.fracturingsInfoList;
    var fontWidth = 0.0;
    var length = fracturingMaxList.length;

    ///2. Calculate the width of the text
    for (var i = 0; i < length; i++) {
      var info = fracturingMaxList[i];
      Size textSize = drawTextBoxSize(info.paramName, 10.0, 'typeface');
      fontWidth += (textSize.width + space + rectWidth + 2);
    }

    ///3. Calculate the center point of the total text width , And draw text and color marks from this point
    var startX = (width - fontWidth) / 2;
    for (var i = 0; i < length; i++) {
      paints.style = PaintingStyle.fill;
      var info = fracturingMaxList[i];

      ///3.1 Click Select , Whether to display this curve
      if (info.isShow) {
        paints.color = ColorsUtils.hexToColor(info.curveColorPlus!);
      } else {
        paints.color = Colors.grey;
      }

      ///3.2 Calculate the rectangle width of the color identification
      var rect = Rect.fromLTWH(startX, 0, rectWidth, rectHeight);
      ctx.drawRect(rect, paints);

      ///3.3 Calculate the starting point of the text
      startX += rectWidth;

      ///3.4 Draw text
      Size drawSize = drawText(info.paramName, startX + 2, 5.0, 'typeface',
          10.0, paints.color, 'left', 'middle');

      ///3.5 Calculate the drawing rectangle of color identification and text , Post click event function
      var rects = Rect.fromLTWH(
          startX - rectWidth, 0, rectWidth + drawSize.width, rectHeight);
      listRect.add(rects);
      startX += drawSize.width + space;
    }
  }
- Draw a mesh based on four points
design sketch
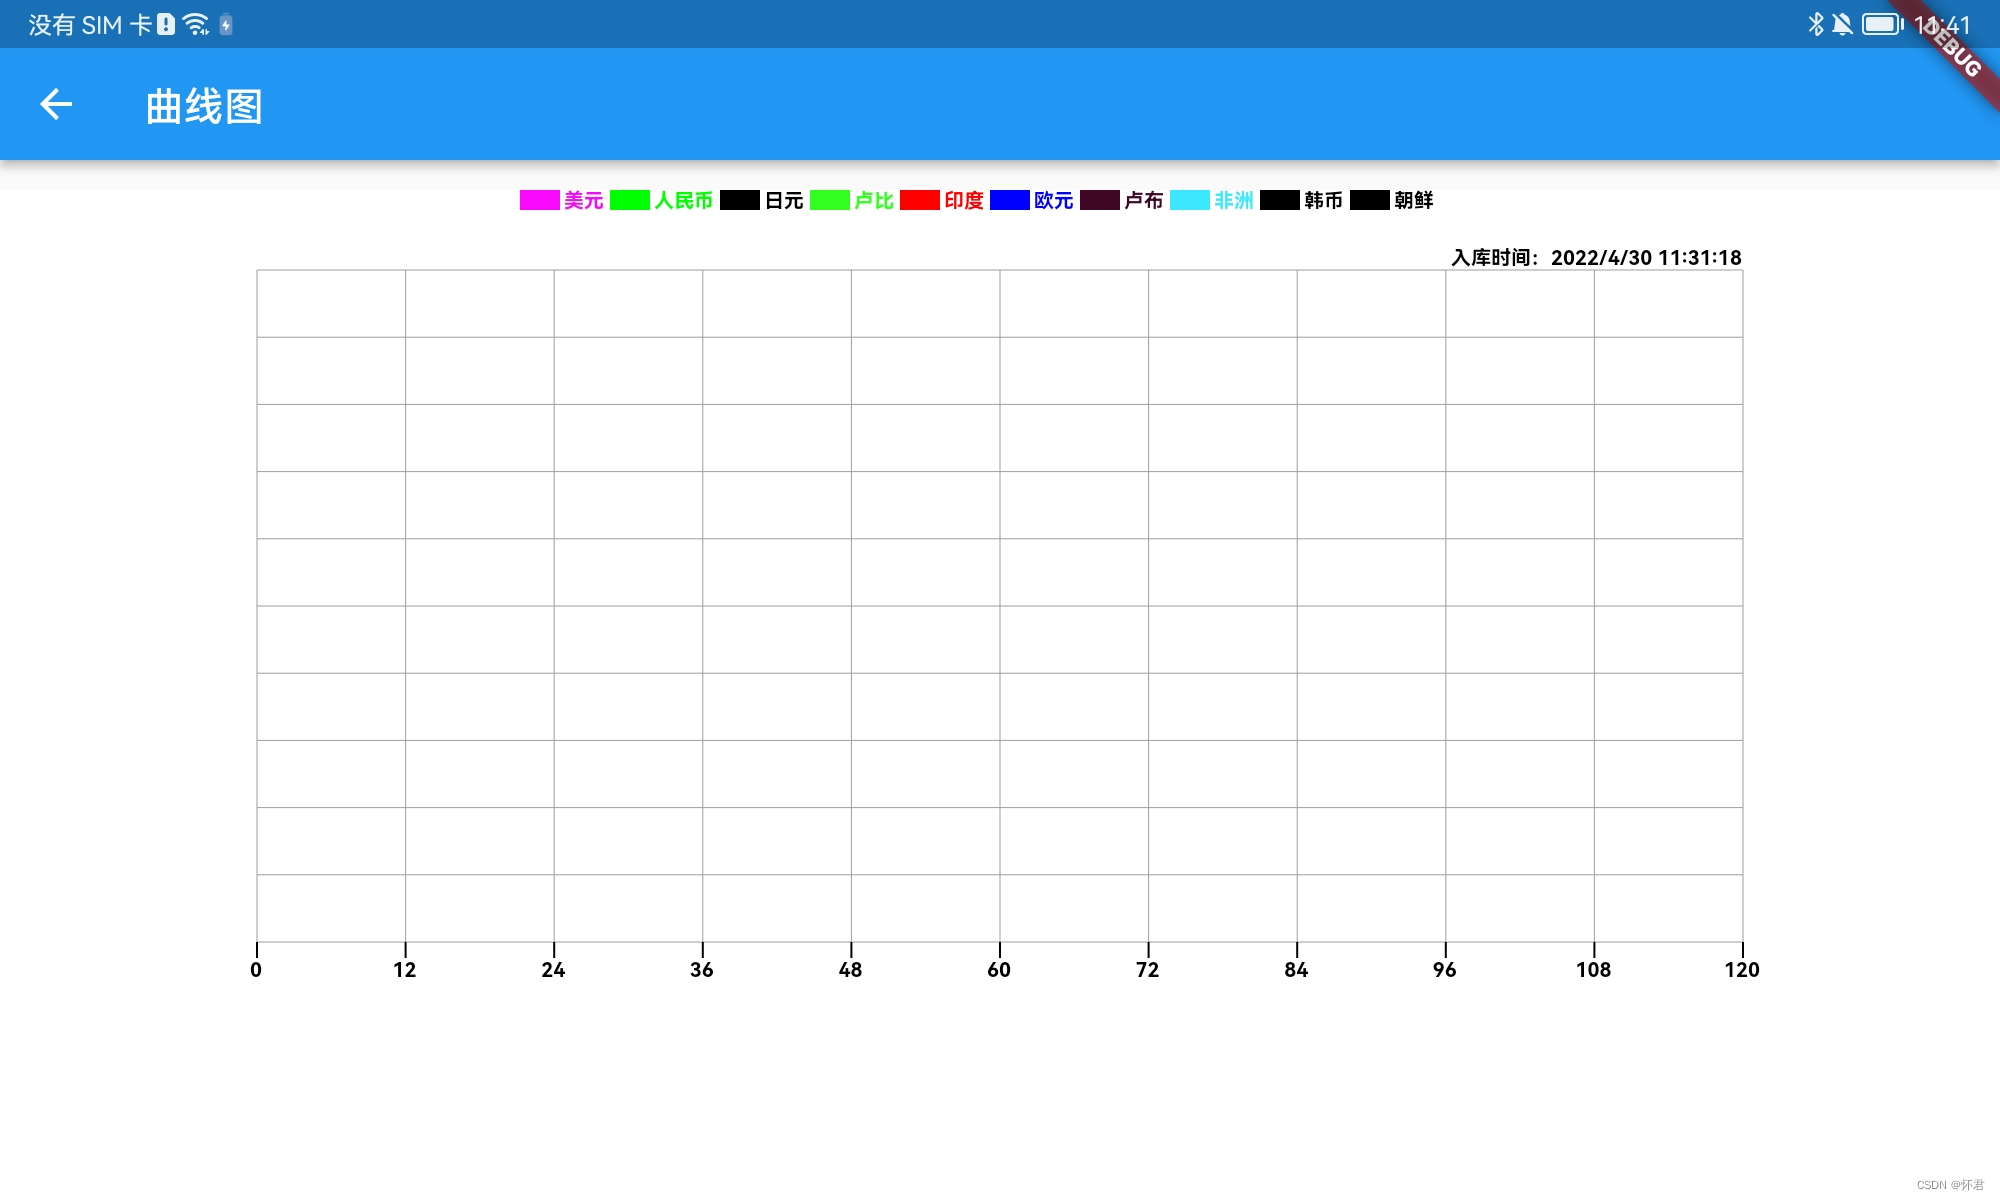
  ///3、 Draw mesh
  void initDrawLine() {
    paints.color = Colors.grey;
    /// Top left y value ;
    var y = pointTopLeft!.dy;
    /// Top left x value ;
    var x = pointTopLeft!.dx;
    for (var i = 0; i < 11; i++) {
      ctx.drawLine(Offset(x, pointTopRight!.dy),
          Offset(x, height - marginBottom + 10.0), paints);
      ctx.drawLine(
          Offset(marginLeft, y), Offset(width - marginRight, y), paints);
      y += averageHeight;
      x += averageWidth;
    }
  }
- Draw the bottom scale trace
See the third step in the rendering
  ///5、 Bottom scale
  initDrawBottomScale() {
    paints.strokeWidth = 1.0;
    var scaleHeight = 8;
    var paintWidth = width - marginRight - marginLeft;
    var space = paintWidth / 10;
    var y = pointOrigin!.dy;
    var x = marginLeft;
    for (var i = 0; i < fracturingModel.bottomScaleList.length; i++) {
      drawScale(x, y, x, y + scaleHeight);
      drawText(fracturingModel.bottomScaleList[i].toStringAsFixed(0), x,
          y + scaleHeight, 's', 10.0, null, 'center', 'top');
      x = x + space;
    }
  }
- Draw left and right scale tracks
design sketch

  ///6、 Draw the left scale track
  initDrawLeftRightScale() {
    var fracturingMaxList = fracturingModel.fracturingsInfoList;
    /// On the left x The axis draws the start point
    var leftX = pointOrigin!.dx - space;
    /// On the right x The axis draws the start point
    var rightX = width - marginRight + space;
    /// How many scales are there in total
    var length = fracturingMaxList.length;
    var even = (length / 2).round();
    /// Judge odd even number , According to it, we can judge the number of scale columns that need to be painted on the left and right
    if (!MathUtil.isEven(length)) {
      even -= 1;
    }
    for (var i = 0; i < length; i++) {
      var maxData = fracturingMaxList[i];
      if (i < even) {
        var y = pointOrigin!.dy;
        var yyText = 0.0;
        Size? textSize;
        var textWidth = 0.0;
        for (var j = 0; j < 11; j++) {
          textSize = drawText(
              Utils().formatNumber(yyText),
              leftX,
              y,
              's',
              10.0,
              ColorsUtils.hexToColor(maxData.curveColorPlus!),
              'right',
              'middle');
          y -= averageHeight;
          yyText += (maxData.maxValue! / 10);
          if (textWidth < textSize!.width) {
            textWidth = textSize.width;
          }
        }
        leftX -= (textWidth + space);
      } else {
        var y = pointOrigin!.dy;
        var yyText = 0.0;
        Size? textSize;
        var textWidth = 0.0;
        for (var j = 0; j < 11; j++) {
          textSize = drawText(
              Utils().formatNumber(yyText),
              rightX,
              y,
              's',
              10.0,
              ColorsUtils.hexToColor(maxData.curveColorPlus!),
              'left',
              'middle');
          y -= averageHeight;
          yyText += (maxData.maxValue! / 10);
          if (textWidth < textSize!.width) {
            textWidth = textSize.width;
          }
        }
        rightX += (textWidth + space);
      }
    }
  }
- Draw a curve
design sketch

  void initDrawYYPointLine() {
    ctx.save();
    /// Draw the area first
    Rect rect = Rect.fromLTWH(
        pointOrigin!.dx,
        pointTopLeft!.dy,
        pointTopRight!.dx - pointTopLeft!.dx,
        pointBottomRight!.dy - pointTopRight!.dy);
    /// Parts outside the crop region
    ctx.clipRect(rect);
    /// Draw each curve
    for (var points in fracturingModel.listPoints) {
      drawLinePoints(points);
    }
    ctx.restore();
  }

  drawLinePoints(ListPoints points) {
    if (points.isShow) {
      paints.strokeWidth = 1.0;
      paints.style = PaintingStyle.stroke;
      paints.strokeCap = StrokeCap.butt;
      paints.strokeJoin = StrokeJoin.round;
      paints.color = points.color ?? Colors.black;
      ctx.drawPoints(PointMode.polygon, points.offsetZommScaleList, paints);
    }
  }
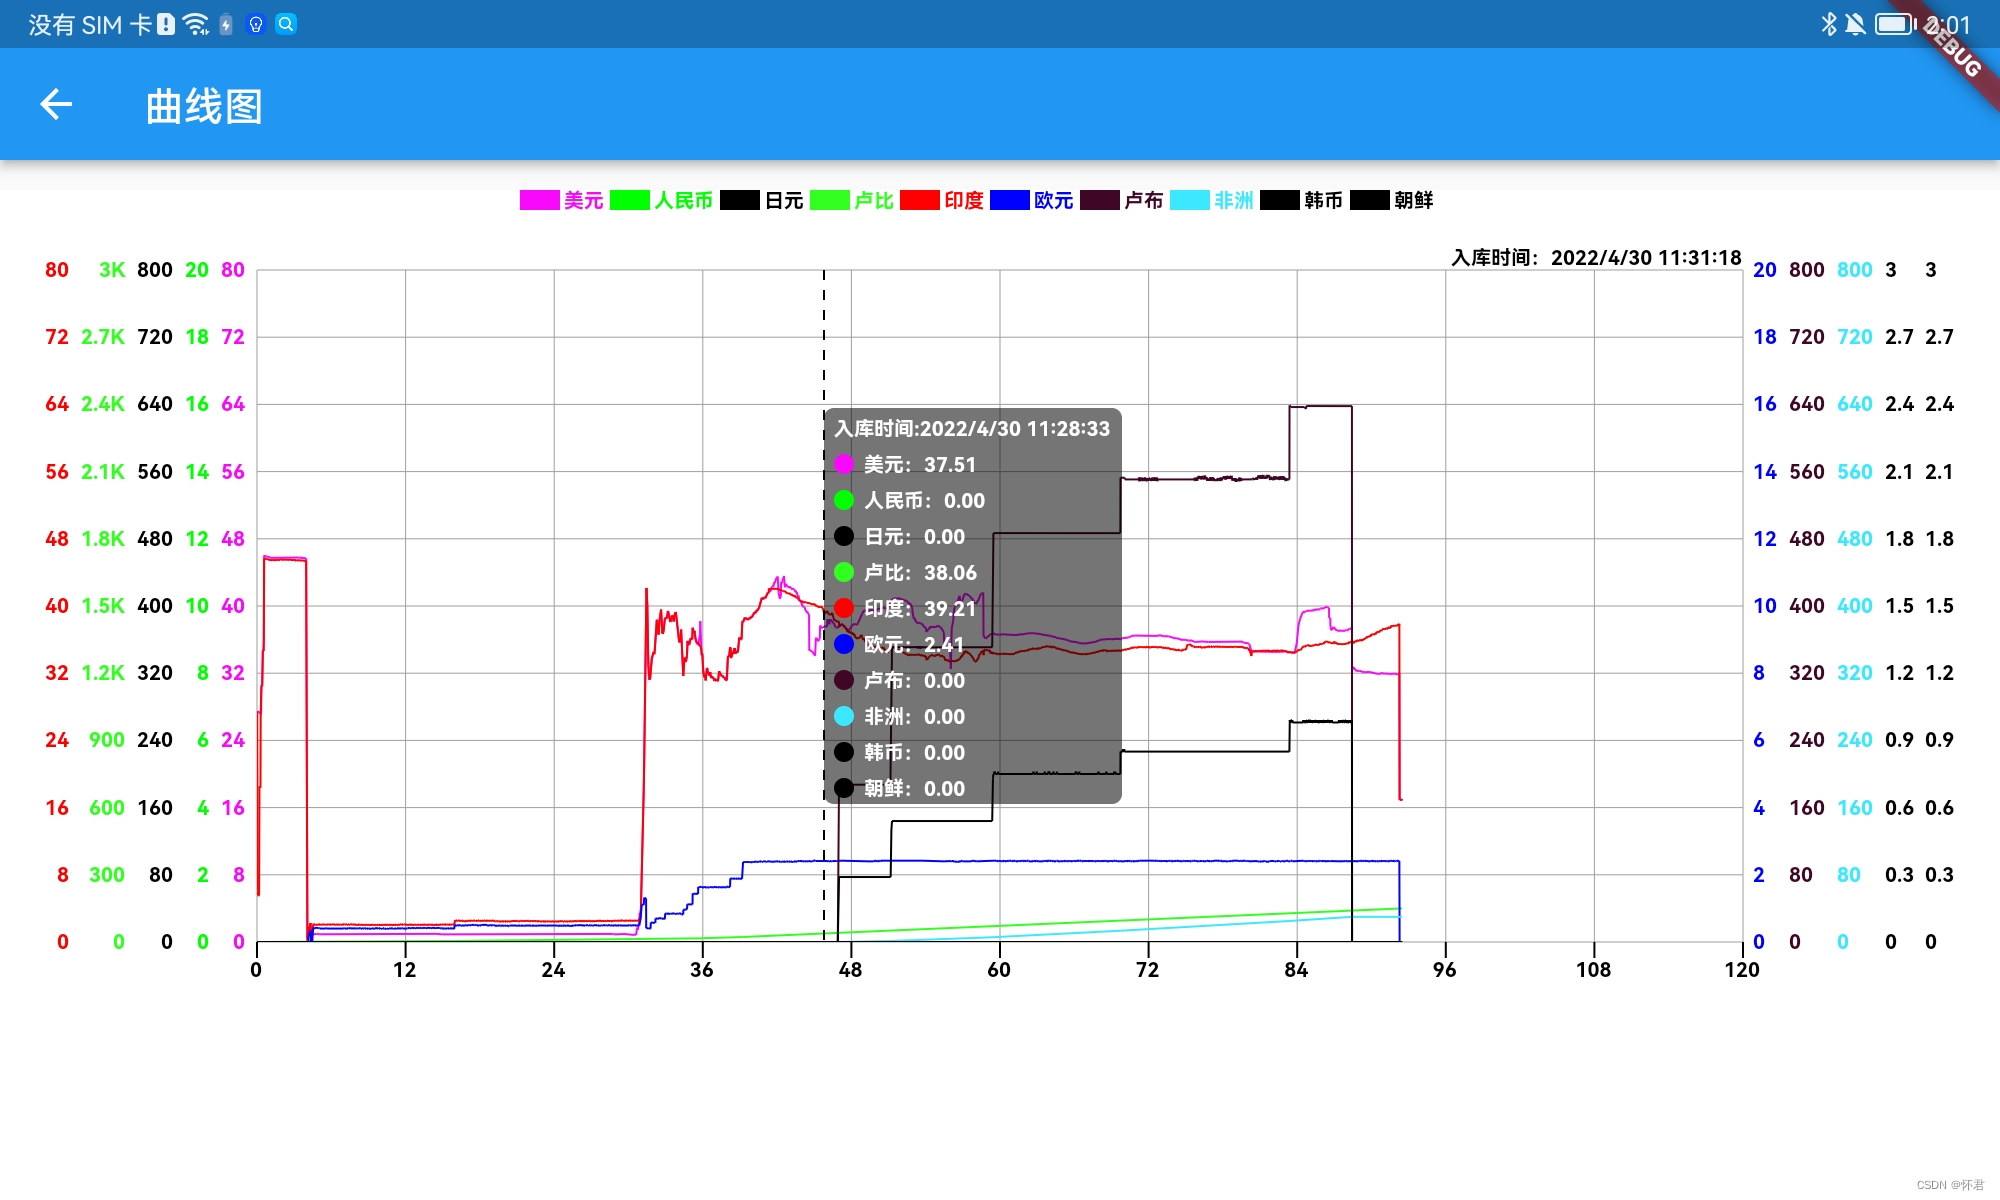
- Click to view the detailed data of this point
design sketch
  drawDashLine([fromX, fromY, toX, toY, gap]) {
    var path = Path();
    path.reset();
    path.moveTo(fromX, fromY);
    path.lineTo(toX, toY);
    paints.strokeWidth = 1.0;
    var paint = Paint()
      ..strokeWidth = 1.0
      ..color = Colors.black
      ..style = PaintingStyle.stroke;
    ctx.drawPath(getDashLine(path, gap, 5.0), paint);
    drawPointTextInfo(fromX, toX);
  }

  Path getDashLine([path, dottedLength, dottedGap]) {
    Path targetPath = Path(); // Dotted line Path
    for (PathMetric metrice in path.computeMetrics()) {
      double distance = 0;
      bool isDrawDotted = true;
      while (distance < metrice.length) {
        if (isDrawDotted) {
          Path extractPath =
              metrice.extractPath(distance, distance + dottedLength);
          targetPath.addPath(extractPath, Offset.zero);
          distance += dottedLength;
        } else {
          distance += dottedGap;
        }
        isDrawDotted = !isDrawDotted;
      }
    }
    return targetPath;
  }

  /// Draw the details of each point after clicking
  drawPointTextInfo(fromX, toX) {
    var textWidth = 0.0;
    var textHeight = 0.0;
    for (var i = 0; i < fracturingModel.fracturingsInfoList.length; i++) {
      var itemInfo = fracturingModel.fracturingsInfoList[i];
      Size textSize;
      if (i == 0) {
        textSize = drawTextBoxSize(
            ' Storage time :${itemInfo.warehousingTime}  ', 10.0, 'typeface');
        textHeight += textSize.height + 5;
      } else {
        textSize = drawTextBoxSize(
            '${itemInfo.paramName}:${itemInfo.detailValues}  ',
            10.0,
            'typeface');
      }
      textHeight += textSize.height + 5;
      if (textWidth < textSize.width) {
        textWidth = textSize.width;
      }
    }
    textWidth += 10;
    var pointHeight = pointBottomRight!.dy - pointTopRight!.dy;
    var bottom = (pointHeight - textHeight) / 2;
    var top = bottom + textHeight;
    var paint = Paint();
    paint.color = Colors.black54;
    paint.style = PaintingStyle.fill;

    var l = 0.0;
    var t = 0.0;
    var r = 0.0;
    var b = 0.0;

    ///1. It means that the distance on the right is not enough
    if (pointTopRight!.dx - fromX < textWidth) {
      l = fromX - textWidth;
      r = fromX;
    } else {
      l = fromX;
      r = fromX + textWidth;
    }
    t = getY(top);
    b = getY(bottom);

    RRect rrect = RRect.fromLTRBR(l, t, r, b, const Radius.circular(5.0));
    ctx.drawRRect(rrect, paint);
    var y = getY(top - 10);
    for (var i = 0; i < fracturingModel.fracturingsInfoList.length; i++) {
      var itemInfo = fracturingModel.fracturingsInfoList[i];
      if (i == 0) {
        Size size = drawText(' Storage time :${itemInfo.warehousingTime}', rrect.left + 5,
            y, 'typeface', 10.0, Colors.white, 'left', 'middle');
        y += size.height + 5;
      }
      paint.color = ColorsUtils.hexToColor(itemInfo.curveColorPlus!);
      ctx.drawCircle(Offset(rrect.left + 10, y), 5, paint);
      Size textSize = drawText('${itemInfo.paramName}:${itemInfo.detailValues}',
          rrect.left + 20, y, 'typeface', 10.0, Colors.white, 'left', 'middle');
      y += textSize.height + 5;
    }
  }

  getX(x) {
    return pointOrigin!.dx + x;
  }

  getY(y) {
    return pointOrigin!.dy - y;
  }
When dealing with click events , We need to pay attention to . According to the click coordinates Offset adopt paintRect!.contains(localPosition) Method to determine whether it is within this range , And then do the corresponding UI Draw operation ;
  /// Return to click type  1 Click the graph  2. Click on the top logo
  onHitTest(Offset localPosition) {
    /// Canvas type
    if (paintRect != null && paintRect!.contains(localPosition)) {
      return {'type': 'curveGraph', 'position': ''};
    } else {
    /// Top identification type
      for (var i = 0; i < listRect.length; i++) {
        Rect rect = listRect[i];
        if (rect.contains(localPosition)) {
          return {'type': 'topTypeGraph', 'position': i};
        }
      }
    }
    return {'type': 'cancel', 'position': ''};
  }
After clicking , Get the type data , Do a series of logical operations
  void onTapDown(detail, map) {
    if (detail != null) {
      var type = map['type'];
      if (type == 'curveGraph') {
        /// Click the graph
        localPosition = detail;
        var listPoint = listPoints[0];
        var length = listPoint.offsetList.length;
        var startOffset = listPoint.offsetList[0];
        var endOffset = listPoint.offsetList[length - 1];
        if (detail.dx > startOffset.dx || detail.dx < endOffset.dx) {
          /// Click on x spot
          var x = double.parse(getTimeX(detail.dx).toStringAsFixed(4));
          var fracturingList = fracturingsInfoList;
          for (var i = 0; i < fracturingList.length; i++) {
            var fracturingMaxList = fracturingsInfoList[i];
            var itemList = fracturingList[i].listFracturing;
            var info = 0.0;
            var sjList = sjMaxList;
            var time = '';
                 /// Find the corresponding index through bisection , Get detailed data information , To display
            var index =
                MathUtil.binarySearchNums(sjList, 0, sjList.length - 1, x);
            if (index == -1) {
              info = 0.0;
              time = '';
            } else if (index == 0 || index == fracturingList.length - 1) {
              info = itemList[index];
              time = cjsjList[index];
            } else {
              time = cjsjList[index];
              var x0 = sjList[index];
              var x1 = sjList[index + 1];
              var y0 = itemList[index];
              var y1 = itemList[index + 1];
              var k = (x - x0) / (x1 - x0);
              var y = y0 + (y1 - y0) * k;
              info = y;
            }
            fracturingMaxList.warehousingTime = time;
            fracturingMaxList.detailValues = info.toStringAsFixed(2);
          }
        }
      } else if (type == 'topTypeGraph') {
      /// Change the data source and re render , Whether to draw the corresponding curve
        var position = map['position'];
        fracturingsInfoList[position].isShow =
            !fracturingsInfoList[position].isShow;
        listPoints[position].isShow = !listPoints[position].isShow;
      }
    }
  }
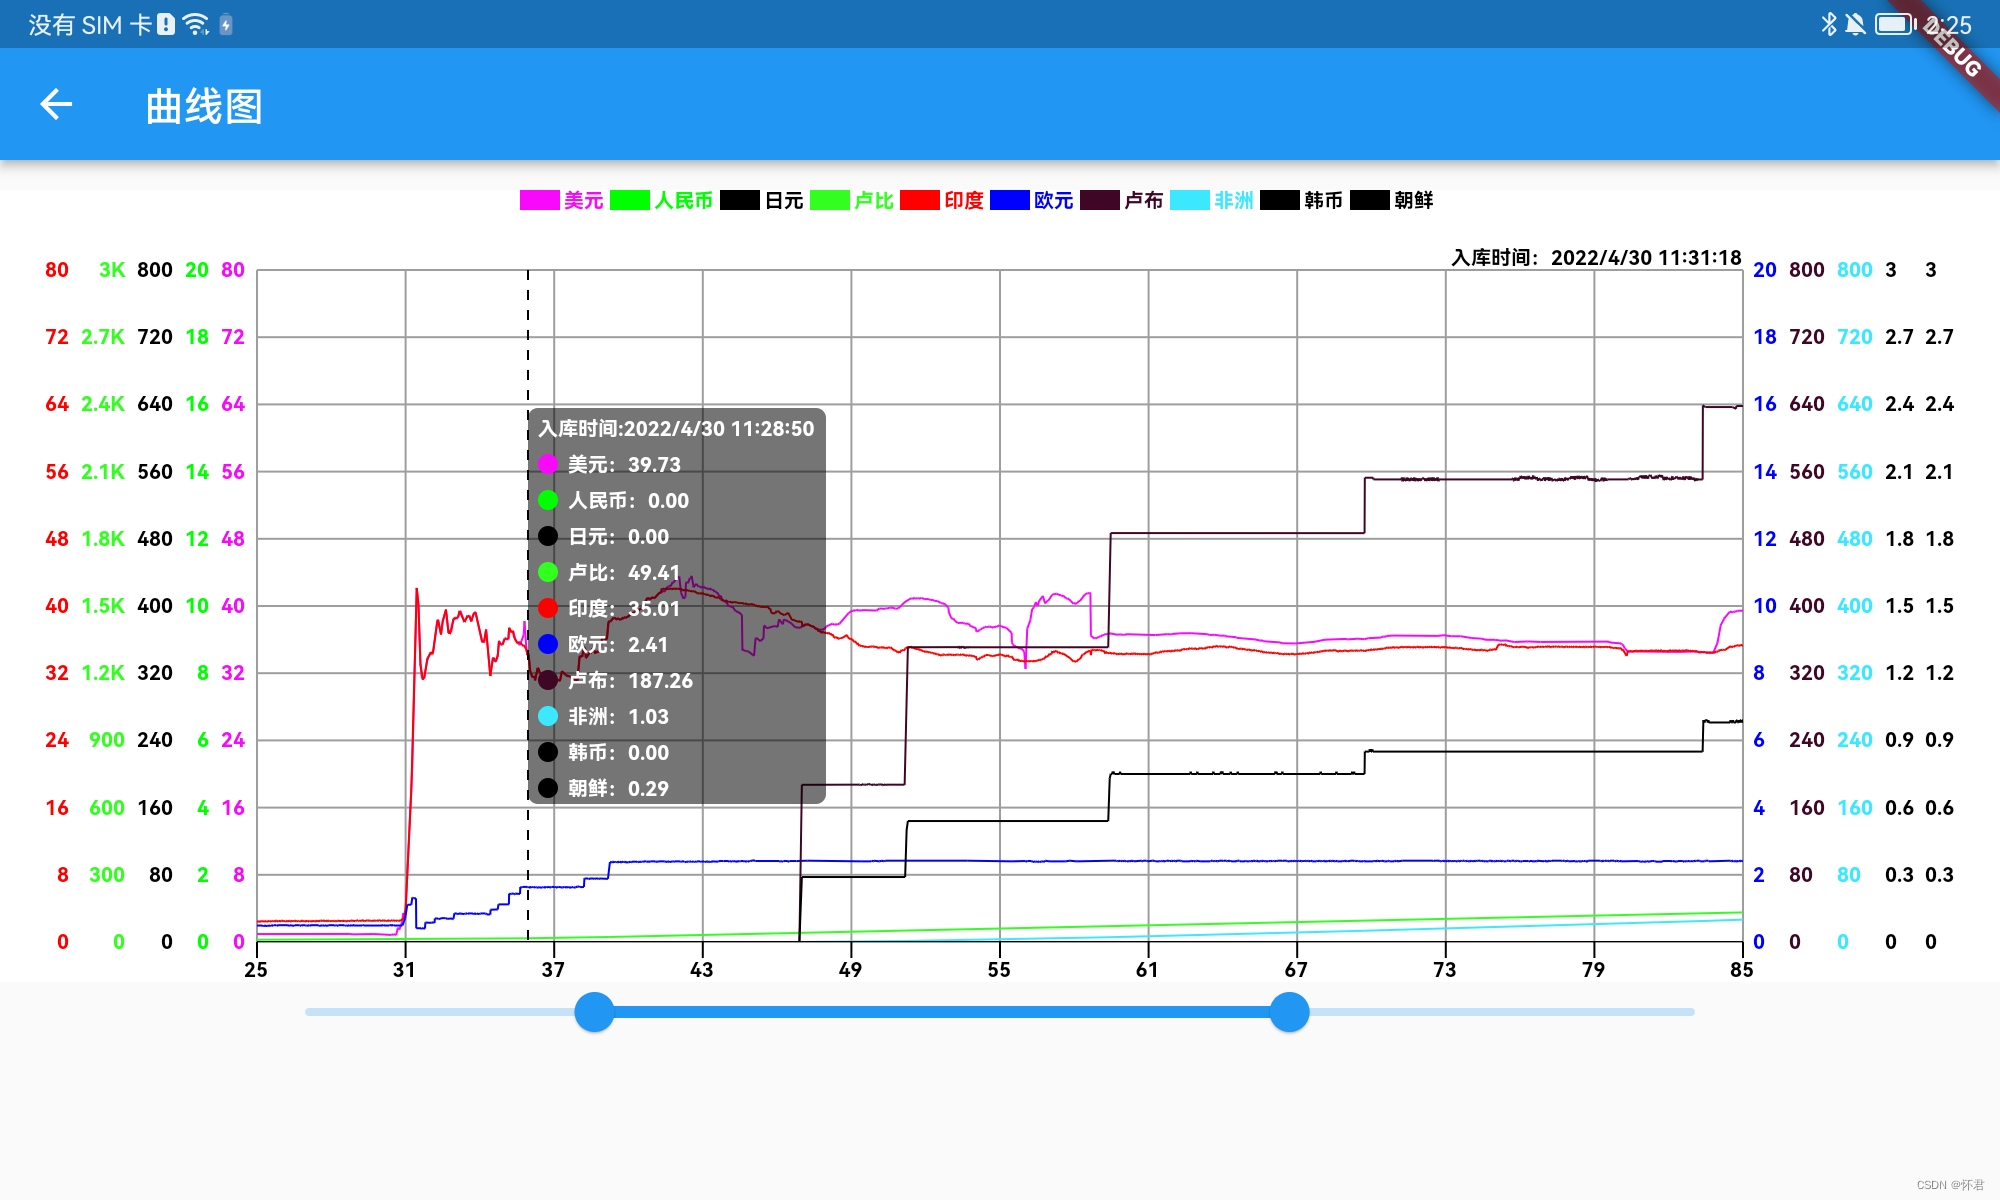
- Curve scaling function
It belongs to expansion function ;
Need to quote stay In file pubspec.yaml , add to syncfusion_flutter_sliders: ^20.1.57
Pay attention to three states ,
1. When dragging the starting point , You need to convert the zoom ratio to x The proportion of the shaft ;
2. When dragging the end point , We need to convert x The displacement ratio of the shaft ;
3. When dragging the interval , You need to convert the zoom ratio to x The proportion of the shaft ;
  SfRangeValues onChangedSlide(SfRangeValues values, SfRangeValues oldSfRange) {
    bottomScaleList.clear();

    /// Total width of scale
    var totalWidth = values.end - values.start;
    var equalParts = totalWidth ~/ 10;

    /// The starting position
    var start = values.start;

    /// End position
    var end = values.end;
    zommScale = sjMax / totalWidth;
    var newMax = sjMax / zommScale;
    equalParts = newMax / 10;

    /// Reconvert x Axis scale
    ratioX = getRatioX(newMax);
    var oldWith = (width - marginLeft - marginRight);
    var newWidth = oldWith * zommScale;
    bottomScaleList.add(start);
    for (var i = 0; i < 10; i++) {
      start += equalParts;
      bottomScaleList.add(start);
    }
    if (oldSfRange.start == values.start) {
      /// Description is the end point of dragging
      if (values.start != 0) {
        translateX = values.start / sjMax * newWidth;
      } else {
        translateX = 0;
      }
      for (var points in listPoints) {
        points.offsetZommScaleList = List.from(points.offsetList);
        for (var i = 0; i < points.offsetZommScaleList.length; i++) {
          var d = (points.offsetZommScaleList[i].dx - marginLeft) * zommScale +
              marginLeft;
          points.offsetZommScaleList[i] =
              Offset(d, points.offsetZommScaleList[i].dy);
          points.offsetZommScaleList[i] =
              points.offsetZommScaleList[i].translate(-translateX, 0.0);
        }
      }
    } else if (oldSfRange.end == values.end) {
      ///  Description is the starting point of dragging
      if (values.end != 0) {
        translateX = values.start / sjMax * newWidth;
      } else {
        translateX = (sjMax - totalWidth) / sjMax * newWidth;
      }
      for (var points in listPoints) {
        points.offsetZommScaleList = List.from(points.offsetList);
        for (var i = 0; i < points.offsetZommScaleList.length; i++) {
          var d = (points.offsetZommScaleList[i].dx - marginLeft) * zommScale +
              marginLeft;
          points.offsetZommScaleList[i] =
              Offset(d, points.offsetZommScaleList[i].dy);
          points.offsetZommScaleList[i] =
              points.offsetZommScaleList[i].translate(-translateX, 0.0);
        }
      }
    } else if (oldSfRange.start != values.start &&
        oldSfRange.end != values.end) {
      print(' Description is the whole line dragged ');
      translateX = values.start / sjMax * newWidth;
      for (var points in listPoints) {
        points.offsetZommScaleList = List.from(points.offsetList);
        for (var i = 0; i < points.offsetZommScaleList.length; i++) {
          var d = (points.offsetZommScaleList[i].dx - marginLeft) * zommScale +
              marginLeft;
          points.offsetZommScaleList[i] =
              Offset(d, points.offsetZommScaleList[i].dy);
          points.offsetZommScaleList[i] =
              points.offsetZommScaleList[i].translate(-translateX, 0.0);
        }
      }
    }
    return values;
  }
design sketch
project demo Address :https://github.com/z244370114/flutter_demo
边栏推荐
- [Fantasy 4] introduction and use of UMG components (under update...)
- Postman -- use
- Vscode set JSON file to format automatically after saving
- 合并有序数列
- flume 190 INSTALL
- [Lua] summary of common knowledge points (including common interview sites)
- Zlib download and use
- Message mechanism -- getting to know messages and message queues for the first time
- stm32和电机开发(上位系统)
- 【MySQL】连接MySQL时出现异常:Connection must be valid and open
猜你喜欢
虚幻AI蓝图基础笔记(万字整理)
Configuration programmée du générateur de plantes du moteur illusoire UE - - Comment générer rapidement une grande forêt
数据库字典Navicat自动生成版本

Beautiful and intelligent, Haval H6 supreme+ makes Yuanxiao travel safer
Rapid prototyping

虚幻材质编辑器基础——如何连接一个最基本的材质
Notes de base sur les plans illusoires d'IA (triés en 10 000 mots)
Delivery mode design of Spartacus UI of SAP e-commerce cloud
SAP Spartacus express checkout design
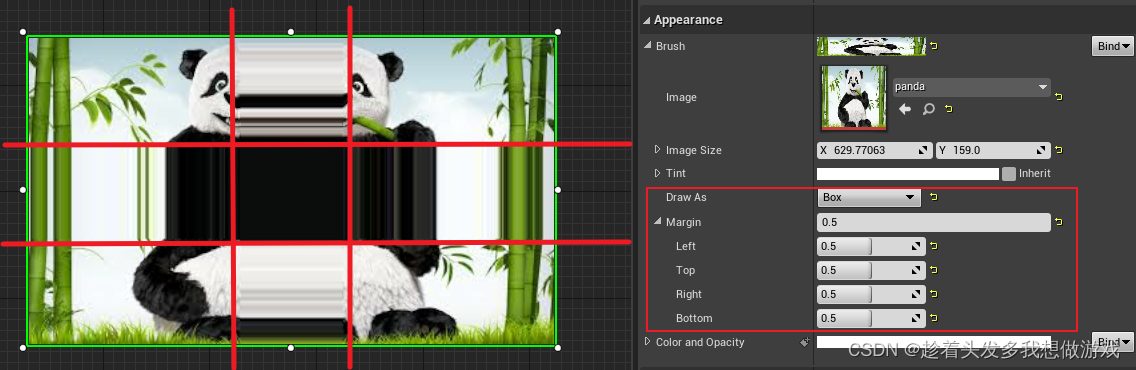
【虚幻4】UMG组件的简介与使用(更新中...)
随机推荐
webUI自动化学习
Ctrip starts mixed office. How can small and medium-sized enterprises achieve mixed office?
ERROR 1118 (42000): Row size too large (&gt; 8126)
Allure -- common configuration items
Following nym, the new project Galaxy token announced by coinlist is gal
[ue5] two implementation methods of AI random roaming blueprint (role blueprint and behavior tree)
Vscode set JSON file to format automatically after saving
【MySQL】连接MySQL时出现异常:Connection must be valid and open
AttributeError: type object ‘Image‘ has no attribute ‘fromarray‘
2021-10-02
Solutions to a series of problems in sqoop job creation
测试--面试题总结
SQOOP 1.4.6 INSTALL
sqoop的表的导入
合并有序数列
Nonlinear optimization: establishment of slam model
Mock Server基本使用方法
Project practice, redis cluster technology learning (11)
[ue5] blueprint making simple mine tutorial
stm32和電機開發(上比特系統)