当前位置:网站首页>JVM command - jmap: export memory image file & memory usage
JVM command - jmap: export memory image file & memory usage
2022-07-07 06:08:00 【Zhang Junjie 1994】
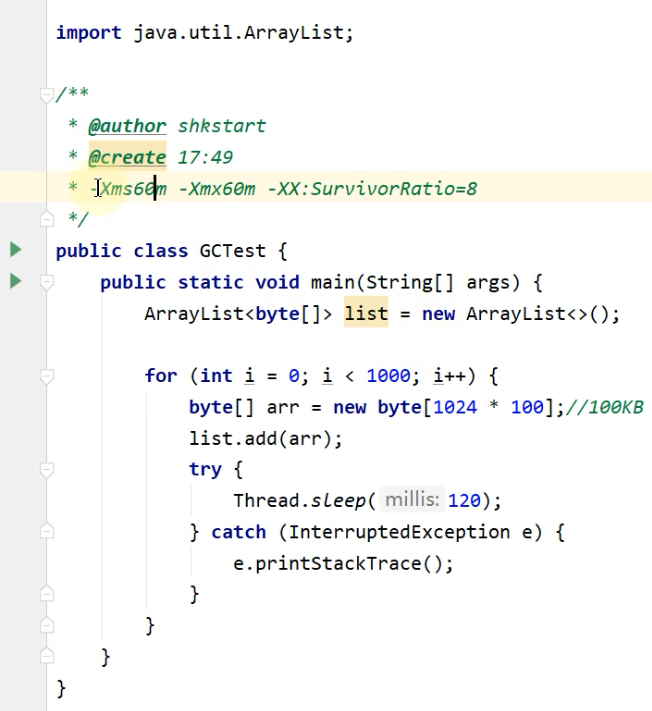
Study Silicon Valley Song Hongkang JVM From entry to mastery Learning notes of
summary
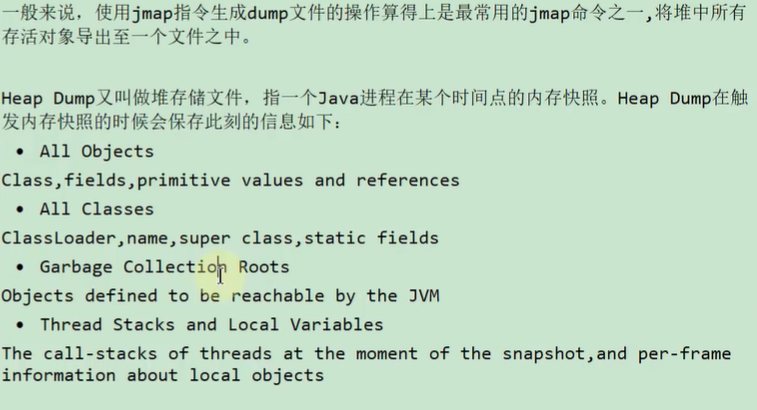
jmap Full name JVM Memory Map. One of its functions is to obtain dump file ( Heap dump snapshot file , Binary ), You can also get the target Java Process memory related information , Include Java The usage of each area of the reactor 、 Statistics of objects in the heap , Class loading information and so on .
dump file ( Heap dump snapshot file , Binary ) It is a record of the size of memory occupied by some objects and data in memory at the current time , Is a binary file , Special tools are needed to open .
Basic grammar
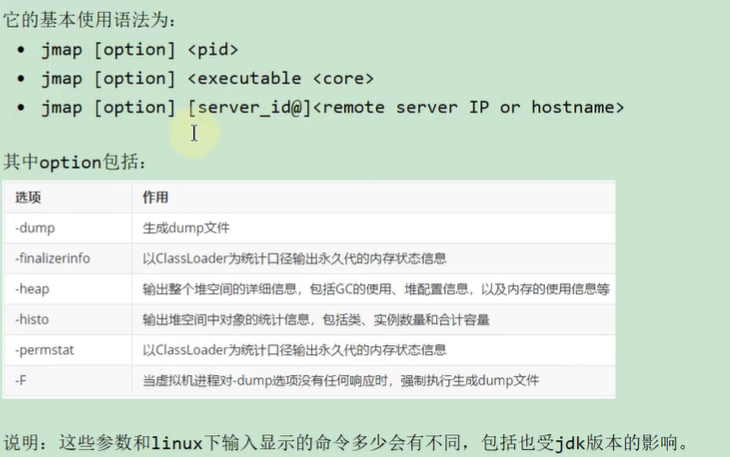
1. Using grammar can be done in DOS Use... In the window jmap/jmap -h/jmap -help see
2.<executable Represents executable code , For example, use > File name to specify the generated dump Where the file was generated
3.[[email protected]]<……> It is prepared for remote connection
Basic grammar
-dump
Generate Java Heap dump snapshot :dump file
Special :-dump:live Save only live objects in the heap
-heap
Output details of the entire heap space , Include GC Use 、 Heap configuration information , And memory usage information, etc
-histo
Output peer information of objects in the heap , Including class 、 Number of instances and total capacity
Special :-histo:live Count only the live objects in the heap
-permstat
With ClassLoader Output permanent memory state information for statistical aperture
only linux/solaris The platform works
-finalizerinfo
Displayed in the F-Queue Waiting in the Finalizer Threads execute finalize Object of method
only linux/solaris The platform works
-F
When a virtual machine process pair -dump When the option has no response , You can use this option to force a build dump file
-h | -help
jamp Help commands used by tools
-J
Pass parameters to jmap Starting up jvm
demonstration
Use 1: Export memory image file (dump file )
Be careful :
- For section 1 This is only done in automatic mode , Manual operation will not be in Full GC Then generate Dump
- Manually generate dump file , Generally, after the instruction is executed, it will generate , Don't wait for it to appear OOM When
- Use automatic method to generate dump file , When there is a OOM Before, Mr. Cheng dump file
- If manual mode is used , Generally, the second 2 Kind of , After all, the living objects in the pile dump The file is relatively small , Convenient for transmission and analysis
Manual way
jmap -dump:format=b,file=<filename.hprof> <pid>
jmap -dump:live,format=b,file=<filename.hprof> <pid>
production dump file 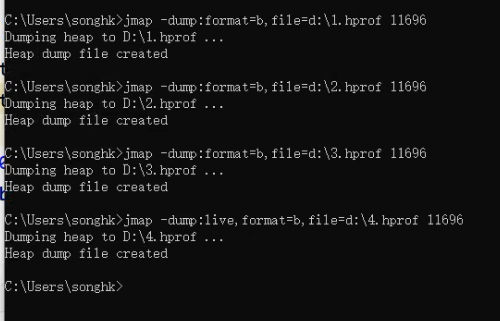
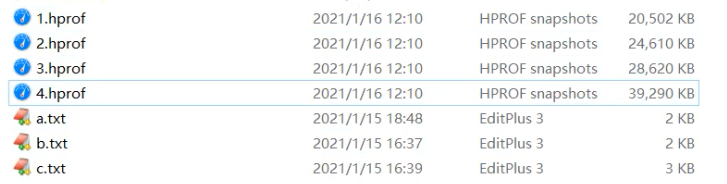
You will find the exported hprof The file will get bigger and bigger , Because with the implementation of the application , There will also be more and more relevant data , Of course, if your parameter configuration has -dump:live Parameter words , representative hprof Save only objects in the heap . , So you generated hprof The file may also become smaller .
In the actual production environment , You made hprof There may be hundreds of files mb size , So the file is a little big ,dump If the instruction has live after , such hprof The file may not be that big , On the ground oom Most of the reasons for the situation are gc It is caused by the survival of objects that cannot be recycled , So the actual production environment , Most of them use -dump:live Instructions
Automatic way
When the program happens oom When you quit the app , Some homeopathic information will disappear with the termination of the program , So reproduce oom The problem is more difficult , If it can happen oom When , Auto export dump Documents are better .
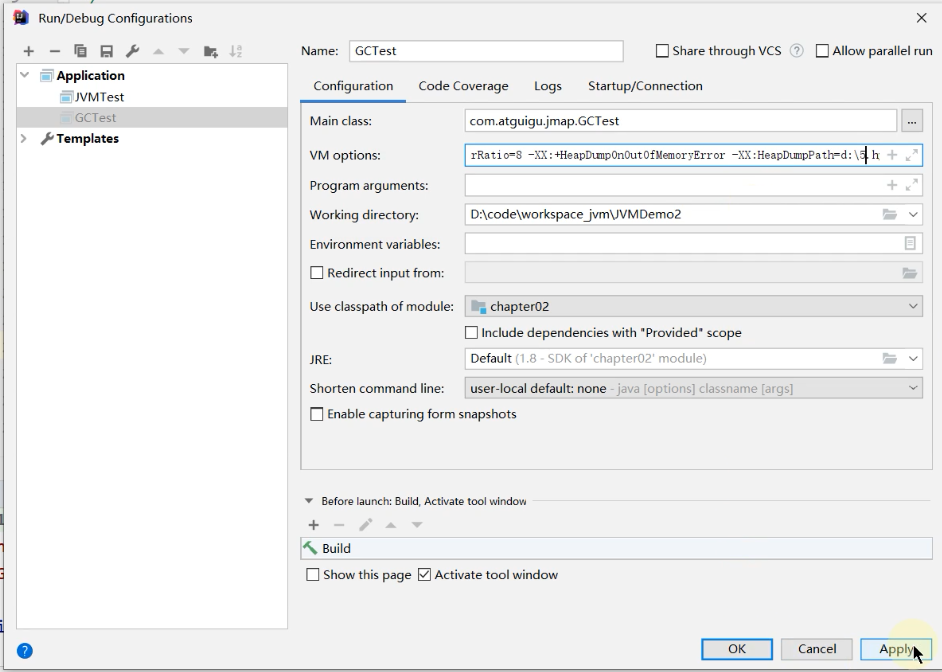
-XX:+HeapDumpOnOutOfMemoryError: When the program happens oom When , Export the current... Of the application dump file .
-XX:HeapDumpPath=<filename.hprof>  Specify where to save the heap snapshot ..
such as :
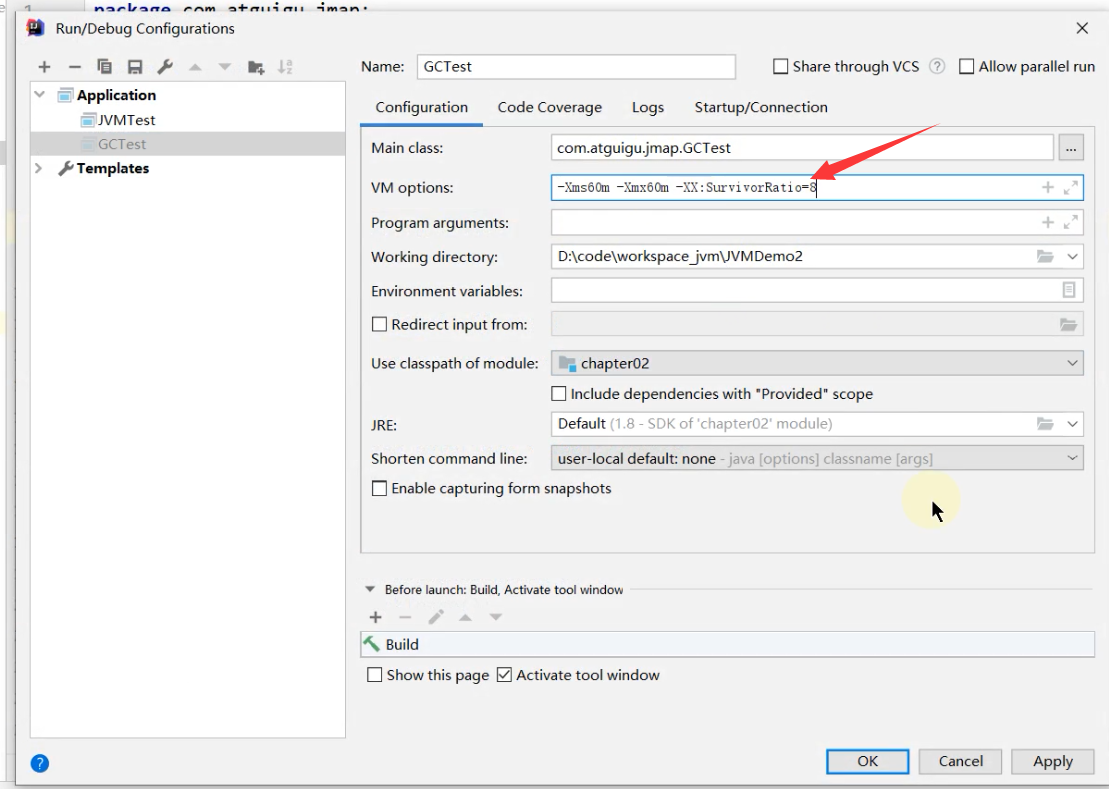
-Xmx100m -XX:+HeapDumpOnOutOfMemoryError -XX:HeapDumpPath=D:\m.hprof
The specific use is as follows :
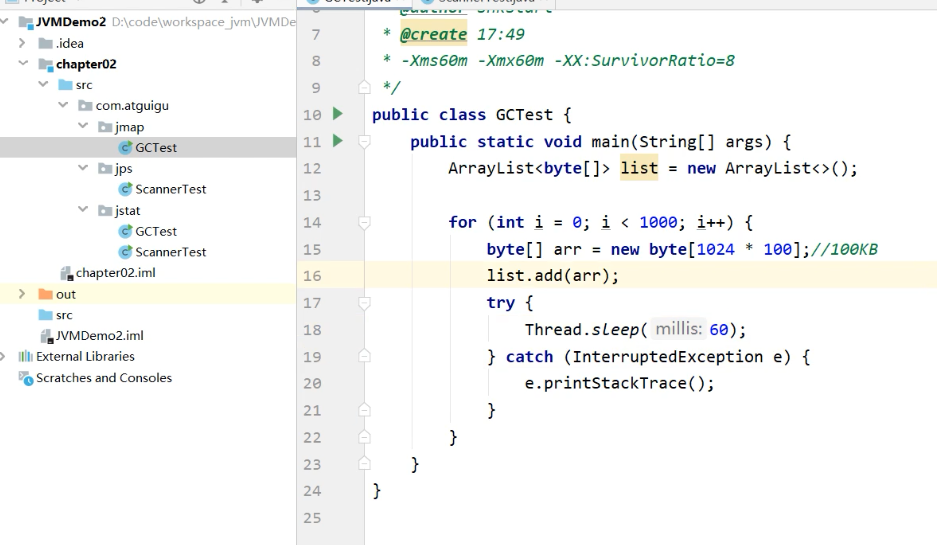
Wait after starting the program
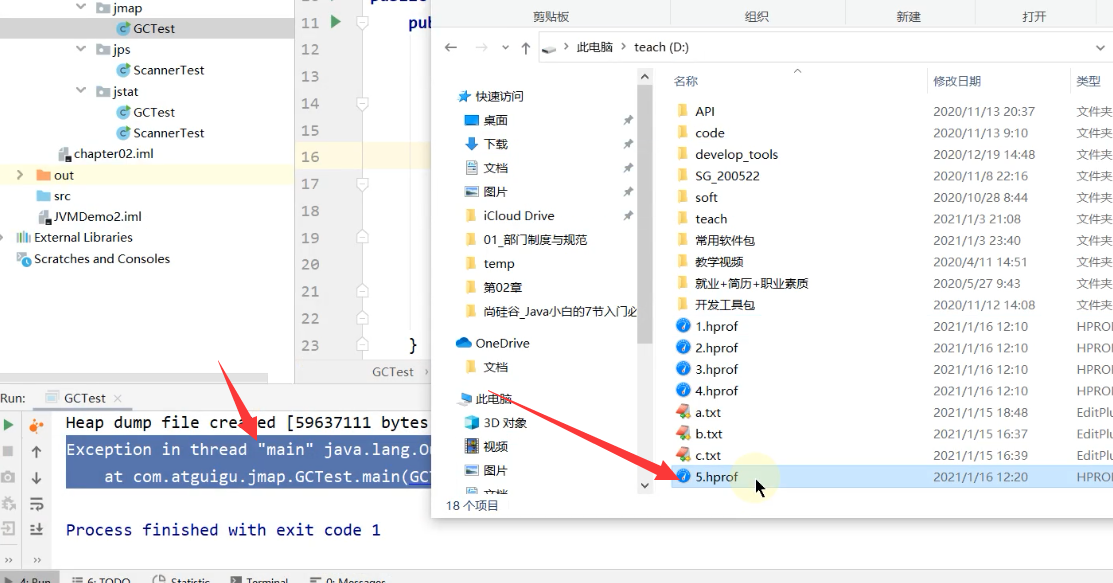
Happen when oom For a moment , Immediately, a hprof File out
Use 2: Display heap memory information
jmap -heap process id
jmap -heap process id It's just a heap of information at a point in time , and jstat You can add parameters later , You can specify time to dynamically observe data changes , And graphical interface tools , for example jvisualvm etc. , They can dynamically display relevant information in the form of charts , More intuitive
Examples are as follows :

The contents of the document :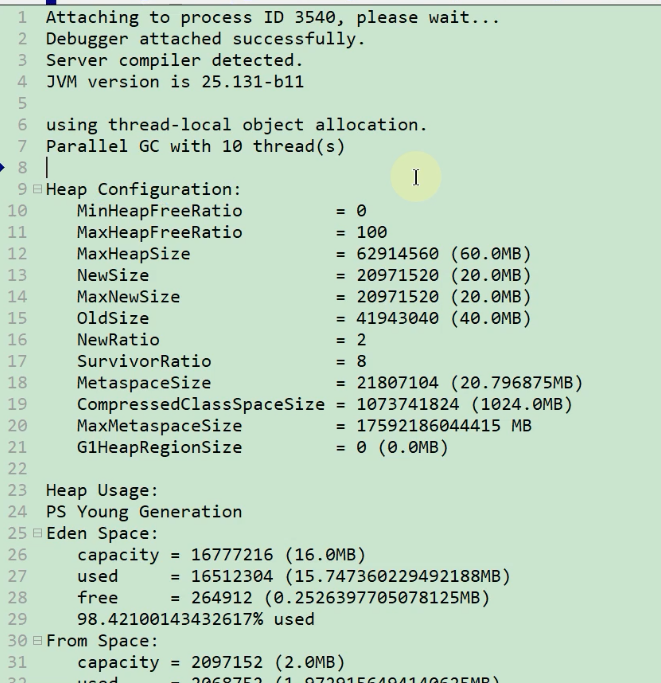
The file contains configuration information of heap space , Occupation of new and old generations ,
jmap -histo process id
Output peer information of objects in the heap , Including class 、 Number of instances and total capacity , It is also the object information in memory at this moment
Examples are as follows :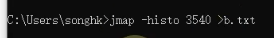
边栏推荐
- Mysql-centos7 install MySQL through yum
- Determine whether the file is a DICOM file
- Cloud acceleration helps you effectively solve attack problems!
- On the difference between FPGA and ASIC
- Reptile exercises (III)
- Deep clustering: joint optimization of depth representation learning and clustering
- Vscode for code completion
- EMMC打印cqhci: timeout for tag 10提示分析与解决
- R language [logic control] [mathematical operation]
- PTA ladder game exercise set l2-004 search tree judgment
猜你喜欢

PowerPivot - DAX (function)

Apple CMS V10 template /mxone Pro adaptive film and television website template

POI excel export, one of my template methods
![[云原生]微服务架构是什么?](/img/84/a0ec68646083f3539aa39ad9d98749.png)
[云原生]微服务架构是什么?
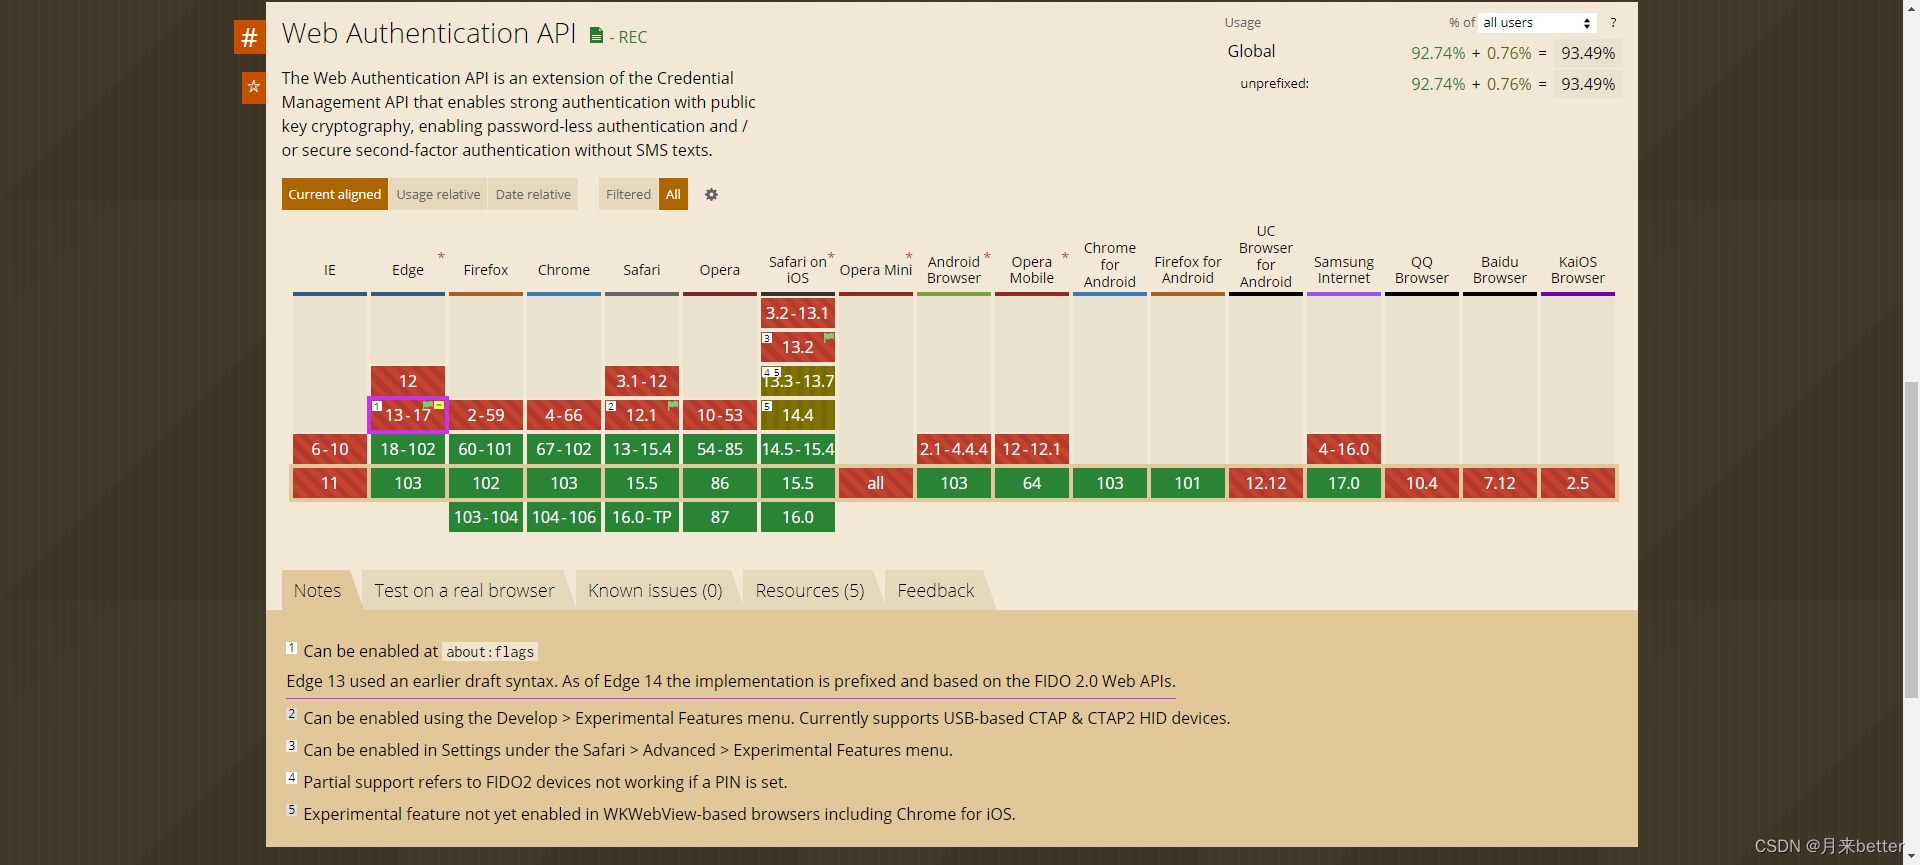
Web authentication API compatible version information
Digital IC interview summary (interview experience sharing of large manufacturers)
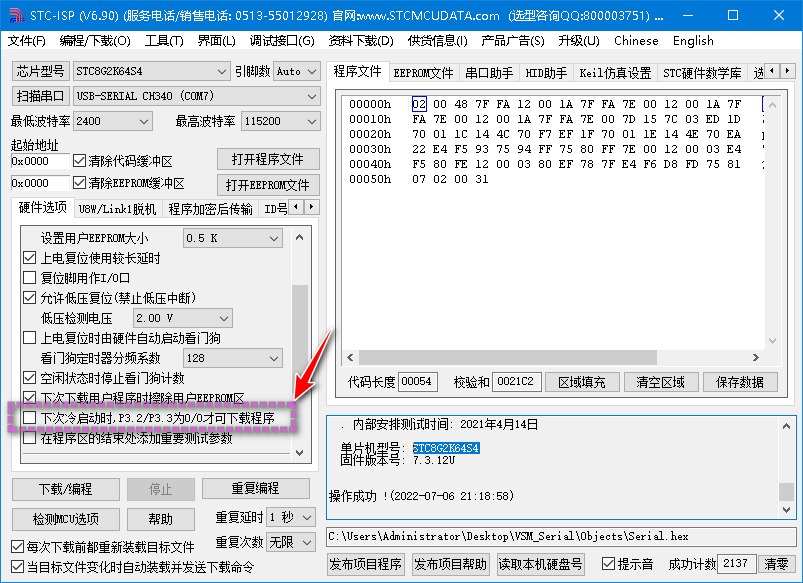
On the discrimination of "fake death" state of STC single chip microcomputer
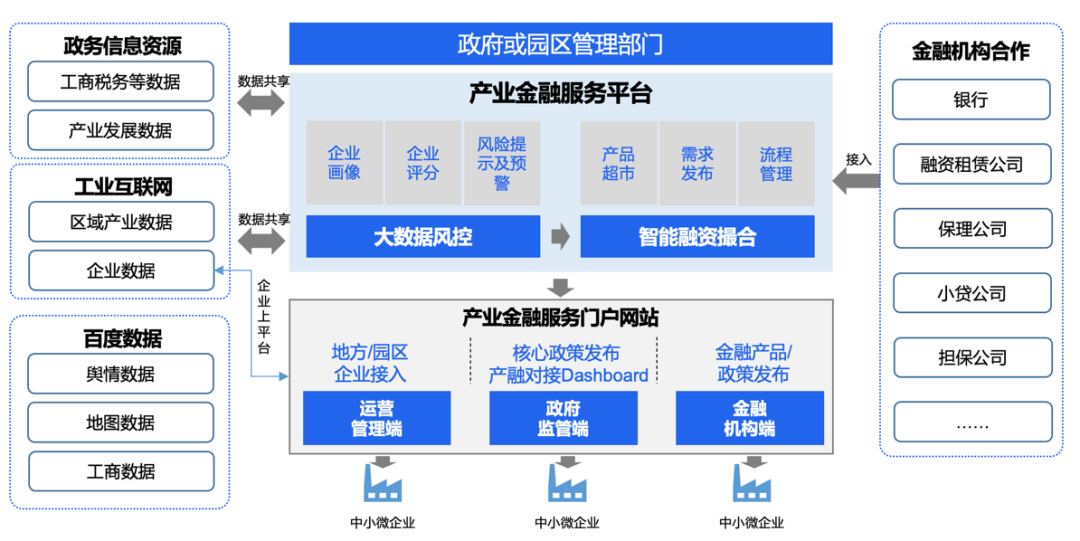
Industrial Finance 3.0: financial technology of "dredging blood vessels"
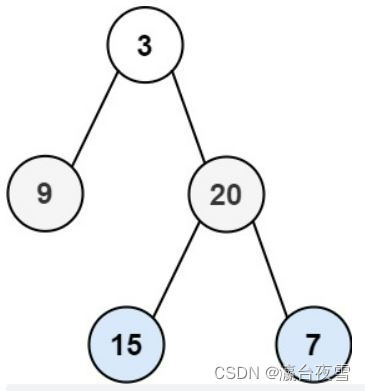
Question 102: sequence traversal of binary tree
数字IC面试总结(大厂面试经验分享)
随机推荐
Loss function and positive and negative sample allocation in target detection: retinanet and focal loss
Harmonyos practice - Introduction to development, analysis of atomized services
R language [logic control] [mathematical operation]
@pathvariable 和 @Requestparam的详细区别
Interview questions and salary and welfare of Shanghai byte
Nvisual network visualization
外设驱动库开发笔记43:GPIO模拟SPI驱动
Three level menu data implementation, nested three-level menu data
Sequential storage of stacks
Go language learning notes - Gorm use - Gorm processing errors | web framework gin (10)
【日常训练--腾讯精选50】235. 二叉搜索树的最近公共祖先
JVM命令之 jstat:查看JVM統計信息
How to improve website weight
Check Point:企业部署零信任网络(ZTNA)的核心要素
Reptile exercises (III)
《ClickHouse原理解析与应用实践》读书笔记(6)
[FPGA tutorial case 14] design and implementation of FIR filter based on vivado core
@Detailed differences between pathvariable and @requestparam
Bat instruction processing details
PTA 天梯赛练习题集 L2-003 月饼 测试点2,测试点3分析