当前位置:网站首页>[opencv] image morphological operation opencv marks the positions of different connected domains
[opencv] image morphological operation opencv marks the positions of different connected domains
2022-07-07 05:12:00 【GLL_】
【opencv】 Image morphology operation -opencv Mark the location of different connected domains
/** @overload
@param image the 8-bit single-channel image to be labeled
@param labels destination labeled image
@param stats statistics output for each label, including the background label.
Statistics are accessed via stats(label, COLUMN) where COLUMN is one of
#ConnectedComponentsTypes, selecting the statistic. The data type is CV_32S.
@param centroids centroid output for each label, including the background label. Centroids are
accessed via centroids(label, 0) for x and centroids(label, 1) for y. The data type CV_64F.
@param connectivity 8 or 4 for 8-way or 4-way connectivity respectively
@param ltype output image label type. Currently CV_32S and CV_16U are supported.
*/
CV_EXPORTS_W int connectedComponentsWithStats(InputArray image, OutputArray labels,
                                              OutputArray stats, OutputArray centroids,
int connectivity = 8, int ltype = CV_32S); 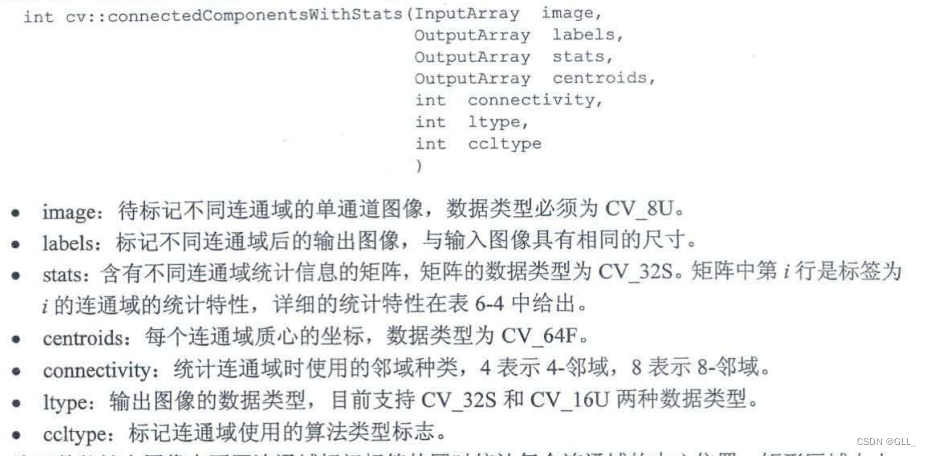
   system("color F0");

    Mat img = imread("D:/image/ml2.png");
    if (img.empty()) {
        cout << "img is empty." << endl;
        return;
    }
    //imshow("srcImg", img);
    Mat rice, riceBW;

    cvtColor(img, rice, COLOR_BGR2GRAY);
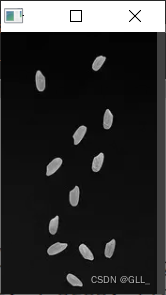
    imshow("rice", rice);
    threshold(rice, riceBW, 50, 255, THRESH_BINARY);
    imshow("riceBW", riceBW);
    RNG rng(10086);
    Mat out, stats, centroids;
    //
    int number = connectedComponentsWithStats(riceBW, out, stats, centroids, 8, CV_16U);
    vector<Vec3b> colors;
    for (int i = 0; i < number; i++) {
        Vec3b vec3 = Vec3b(rng.uniform(0, 256), rng.uniform(0, 256), rng.uniform(0, 256));
        colors.push_back(vec3);
    }
    Mat result = Mat::zeros(rice.size(), img.type());
    int w = result.cols;
    int h = result.rows;
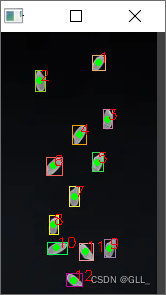
    for (int i = 1; i < number; i++) {
        int center_x = centroids.at<double>(i, 0);
        int center_y = centroids.at<double>(i, 1);
        int x = stats.at<int>(i, CC_STAT_LEFT);
        int y = stats.at<int>(i, CC_STAT_TOP);
        int w = stats.at<int>(i, CC_STAT_WIDTH);
        int h = stats.at<int>(i, CC_STAT_HEIGHT);
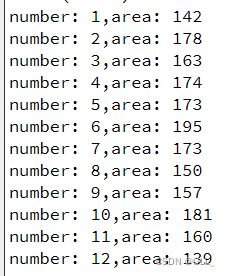
        int area = stats.at<int>(i, CC_STAT_AREA);

        circle(img, Point(center_x, center_y), 2, Scalar(0, 255, 0), 2, 8, 0);

        Rect rect(x, y, w, h);
        rectangle(img, rect, colors[i], 1, 8, 0);
        putText(img, format("%d", i), Point(center_x, center_y),
                FONT_HERSHEY_SIMPLEX, 0.5, Scalar(0, 0, 255), 1);
        cout << "number: " << i << ",area: " << area << endl;
    }

    imshow("result:", img);
    waitKey(0);
result :

边栏推荐
猜你喜欢
随机推荐
Gavin teacher's perception of transformer live class - rasa project actual combat e-commerce retail customer service intelligent business dialogue robot microservice code analysis and dialogue experim
01 machine learning related regulations
2. Overview of securities investment funds
sublime使用技巧
拿到PMP认证带来什么改变?
U++ 游戏类 学习笔记
DBSync新增对MongoDB、ES的支持
《四》表单
谈谈讲清楚这件事的重要性
Pointer and array are input in function to realize reverse order output
Stm32f103ze+sht30 detection of ambient temperature and humidity (IIC simulation sequence)
ClickHouse(03)ClickHouse怎么安装和部署
No experts! Growth secrets for junior and intermediate programmers and "quasi programmers" who are still practicing in Universities
PLC Analog output analog output FB analog2nda (Mitsubishi FX3U)
Batch normalization (Standardization) processing
Markdown编辑器
Ansible概述和模块解释(你刚走过了今天,而扑面而来的却是昨天)
STM32F103实现IAP在线升级应用程序
When knative meets webassembly
How to choose an offer and what factors should be considered
![[Yugong series] go teaching course 005 variables in July 2022](/img/29/2bb30443e1e418556b5e08932f75b4.png)