当前位置:网站首页>Summary of evaluation indicators and important knowledge points of regression problems
Summary of evaluation indicators and important knowledge points of regression problems
2022-07-07 18:16:00 【deephub】
Regression analysis provides a solid foundation for many machine learning algorithms . In this article , We will sum up 10 There are two important regression problems and 5 An important evaluation index of regression problem .
1、 What is the assumption of linear regression ?
Linear regression has four assumptions
- linear : The independent variables (x) And dependent variables (y) There should be a linear relationship between , It means x The change of value should also change in the same direction y value .
- independence : Features should be independent of each other , This means minimal multicollinearity .
- normality : The residual should be normally distributed .
- homoscedasticity : The variance of data points around the regression line should be the same for all values .
2、 What is residual . How it can be used to evaluate regression models ?
Residual refers to the error between the predicted value and the observed value . It measures the distance between the data point and the regression line . It is a computer that subtracts the predicted value from the observed value .
Residual diagram is a good method to evaluate regression model . It's a chart , Show all residuals on the vertical axis , stay x Show features on axis . If the data points are randomly scattered on a line without a pattern , Then linear regression model is very suitable for data , Otherwise, we should use nonlinear models .

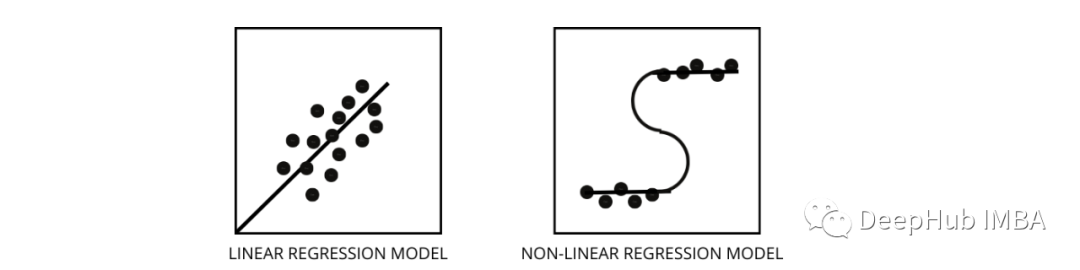
3、 How to distinguish between linear regression model and nonlinear regression model ?
Both are types of regression problems . The difference between the two lies in the data they train .
Linear regression models assume that there is a linear relationship between features and labels , This means that if we take all the data points and plot them linearly ( A straight line ) The line should fit the data .
The nonlinear regression model assumes that there is no linear relationship between variables . nonlinear ( curve ) Lines should be able to separate and fit data correctly .
Three best ways to find out whether the data is linear or nonlinear -
- Residual diagram
- Scatter plot
- Suppose the data is linear , Train a linear model and evaluate it by accuracy .
4、 What is multicollinearity . How it affects model performance ?
When certain features are highly correlated with each other , There will be multicollinearity . Correlation is a measure of how one variable is affected by changes in another variable .
If features a The increase in leads to the characteristics b An increase in , Then these two characteristics are positively correlated . If a The increase in leads to the characteristics b The reduction of , Then these two characteristics are negatively correlated . There are two highly correlated variables in the training data that will lead to multicollinearity , Because its model cannot find patterns in the data , This leads to poor model performance . So before training the model, we should first try to eliminate multicollinearity .
5、 How outliers affect the performance of linear regression models ?
Outliers are data points with values different from the average range of data points . let me put it another way , These points are different from the data or in Chapter 3 Out of standard .

The linear regression model tries to find a best fitting line that can reduce the residual error . If the data contains outliers , Then the best fit line will move a little towards the outliers , This increases the error rate and leads to a very high MSE Model of .
6、 What is? MSE and MAE What's the difference? ?
MSE Represents mean square error , It is the square difference between the actual value and the predicted value . and MAE Is the absolute difference between the target value and the predicted value .
MSE Will punish big mistakes , and MAE Can't . With MSE and MAE The value of both decreases , The model tends to a better fitting line .
7、L1 and L2 What is regularization , When should it be used ?
In machine learning , Our main goal is to create a general model that can perform better on training and test data , But with very little data , Basic linear regression models tend to over fit , So we will use l1 and l2 Regularization .
L1 Regularize or lasso Regression is achieved by adding the absolute value of the slope to the cost function as a penalty . It is helpful to remove outliers by deleting all data points whose slope value is less than the threshold .
L2 Regularize or ridge The regression increases the penalty term equivalent to the square of the coefficient . It penalizes features with higher slope values .
l1 and l2 There are few training data 、 High variance 、 It is useful when the predicted feature is larger than the observed value and the data has multicollinearity .
8、 What does heteroscedasticity mean ?
It refers to the situation that the variance of data points around the best fit line is different within a range . It leads to uneven dispersion of residuals . If it exists in the data , Then the model tends to predict invalid output . One of the best ways to test heteroscedasticity is to draw a residual diagram .
One of the biggest reasons for data internal heteroscedasticity is the huge difference between range characteristics . for example , If we have one from 1 To 100000 The column of , Then increase the value 10% Will not change the lower value , But at higher values, there will be a very large difference , Data points that produce large variance differences .
9、 What is the role of variance inflation factor ?
Variance expansion factor (vif) Used to find out the extent to which other independent variables can be used to predict independent variables .
Let's have v1、v2、v3、v4、v5 and v6 Take the example data of features . Now? , For calculation v1 Of vif, Consider it as a predictive variable , And try to predict it with all other predictive variables .
If VIF The value is very small. , Then it's best to delete the variable from the data . Because smaller values indicate high correlation between variables .
10、 Stepwise regression (stepwise regression) How to work ?
Stepwise regression is with the help of hypothesis testing , A method of creating a regression model by removing or adding predictive variables . It predicts the dependent variable by iteratively testing the significance of each independent variable , And delete or add some features after each iteration . It runs n Time , And try to find the best parameter combination , The error between the observed value and the predicted value of the predicted dependent variable is the smallest .
It can manage a large amount of data very efficiently , And solve high-dimensional problems .
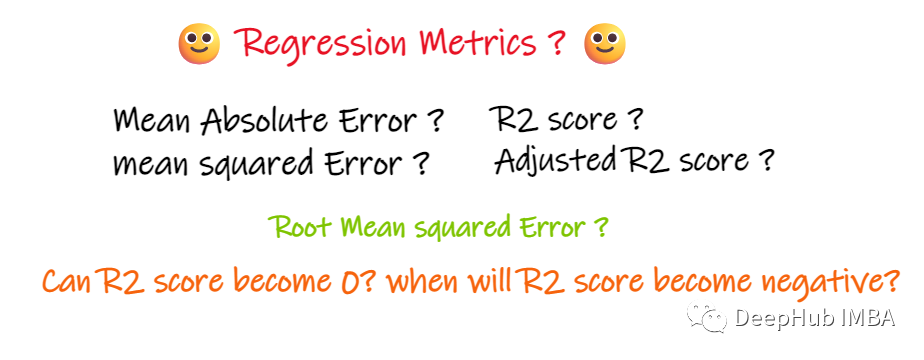
except MSE and MAE Are there any other important indicators of external regression ?
We use a regression problem to introduce these indicators , One of our inputs is work experience , The output is salary . The following figure shows the linear regression line drawn to predict salary .

1、 Mean absolute error (MAE):
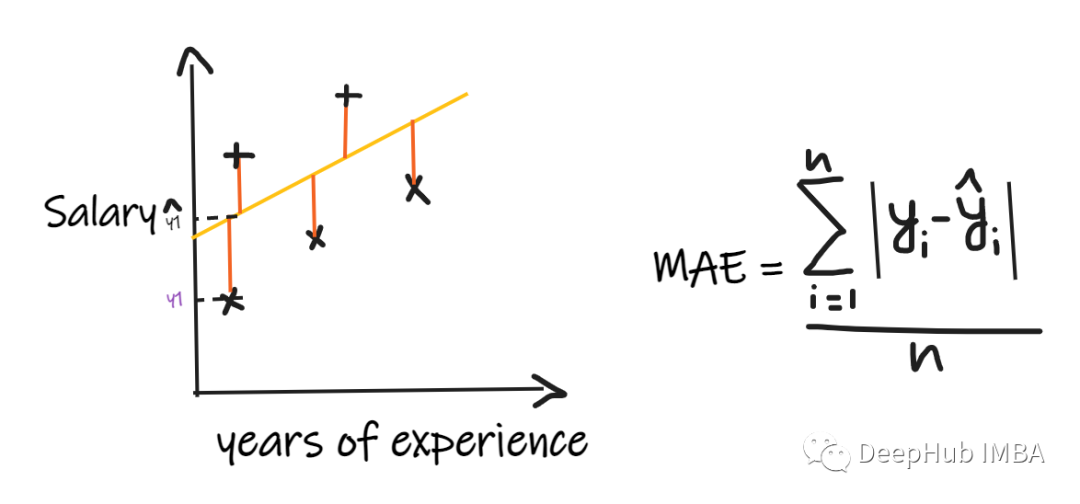
Mean absolute error (MAE) Is the simplest regression measure . It adds the difference between each actual value and the predicted value , Finally, divide by the number of observations . In order to make the regression model be considered as a good model ,MAE It should be as small as possible .
MAE The advantages of :
Simple and easy to understand . The result will have the same unit as the output . for example : If the unit of output column is LPA, So if MAE by 1.2, Then we can explain that the result is +1.2LPA or -1.2LPA,MAE Relatively stable for outliers ( Compared with other regression indicators ,MAE Less affected by outliers ).
MAE The shortcomings of :MAE Modular functions are used , But modular functions are not differentiable at all points , So in many cases, it cannot be used as a loss function .
2、 Mean square error (MSE):
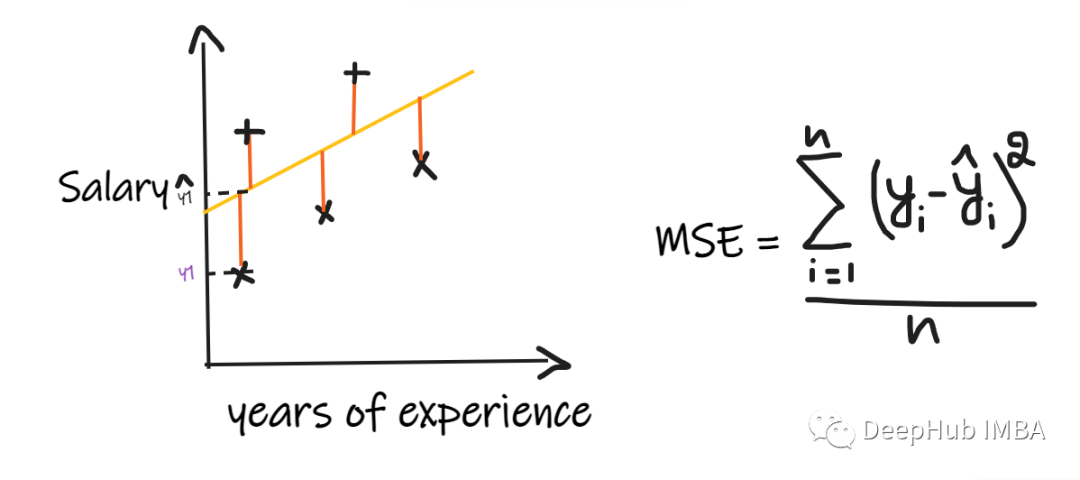
MSE Take the difference between each actual value and the predicted value , Then square the difference and add them , Finally, divide by the number of observations . In order to make the regression model be considered as a good model ,MSE It should be as small as possible .
MSE The advantages of : The square function is differentiable at all points , So it can be used as a loss function .
MSE The shortcomings of : because MSE Use the square function , The unit of the result is the square of the output . So it's hard to explain the results . Because it uses the square function , If there are outliers in the data , Then the difference will also be squared , therefore ,MSE Unstable for outliers .
3、 Root mean square error (RMSE):
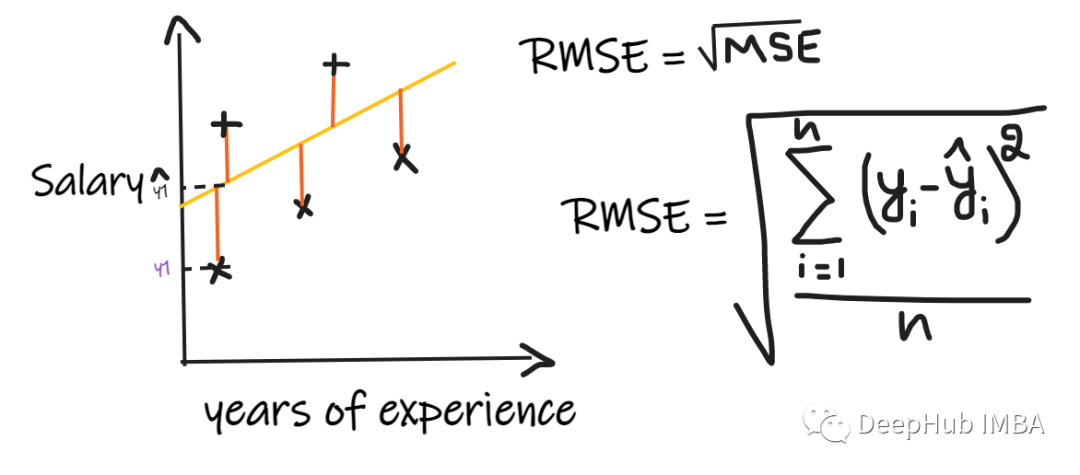
Root mean square error (RMSE) Take the difference between each actual value and the predicted value , Then square the difference and add them , Finally, divide by the number of observations . Then take the square root of the result . therefore ,RMSE yes MSE The square root of . In order to make the regression model be considered as a good model ,RMSE It should be as small as possible .
RMSE It's solved MSE The problem of , The unit will be the same as the output unit , Because it takes the square root , But it is still not so stable for outliers .
The above indicators depend on the context of the problem we are solving , We can't do it without knowing the actual problems , Just look at MAE、MSE and RMSE To judge the quality of the model .
4、R2 score:
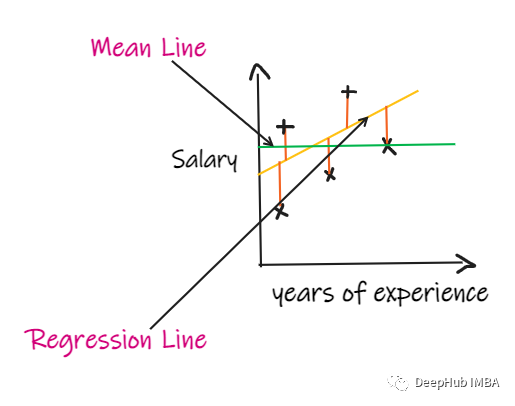
If we don't have any input data , But I want to know how much salary he can get in this company , Then the best thing we can do is to give them the average salary of all their employees .
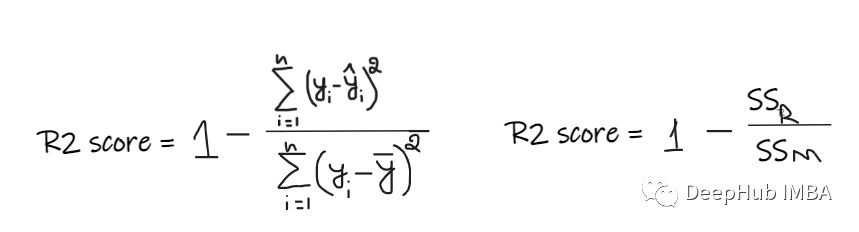
R2 score The value given is between 0 To 1 Between , It can be interpreted in any context . It can be understood as the goodness of fit .
SSR Is the sum of the squares of the errors of the regression line ,SSM Is the sum of squares of the mean square error . We compare the regression line with the average .
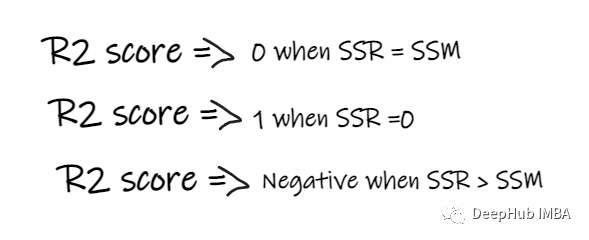
- If R2 The score is 0, It means that the result of our model is the same as that of the average , Therefore, we need to improve our model .
- If R2 The score is 1, Then the right part of the equation becomes 0, This will only happen if our model is suitable for each data point and there is no error .
- If R2 Score negative , Then it means that the right side of the equation is greater than 1, This may happen in SSR > SSM when . This means that our model is the worst than the average , In other words, our model is not as good as taking the average to predict
If we model R2 The score is 0.8, This means that the model can be said to explain 80% Output variance of . in other words ,80% The salary change of can be input ( Years of service ) To explain , But the rest 20% It is unknown. .
If our model has 2 Features , Working years and interview scores , Then our model can use these two input characteristics to explain 80% The change in wages .
R2 The shortcomings of :
As the number of input features increases ,R2 Will tend to increase correspondingly or remain unchanged , But it will never fall , Even if the input characteristics are not important to our model ( for example , Add the temperature on the day of the interview to our example ,R2 It will not drop, even if the temperature is not important to the output ).
5、Adjusted R2 score:
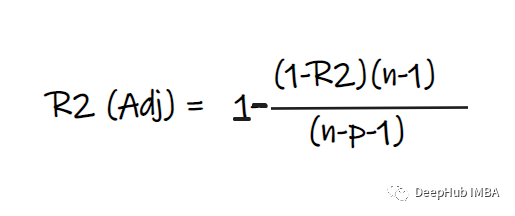
In the above formula R2 by R2,n Is the number of observations ( That's ok ),p Is the independent characteristic number .Adjusted R2 It's solved R2 The problem of .
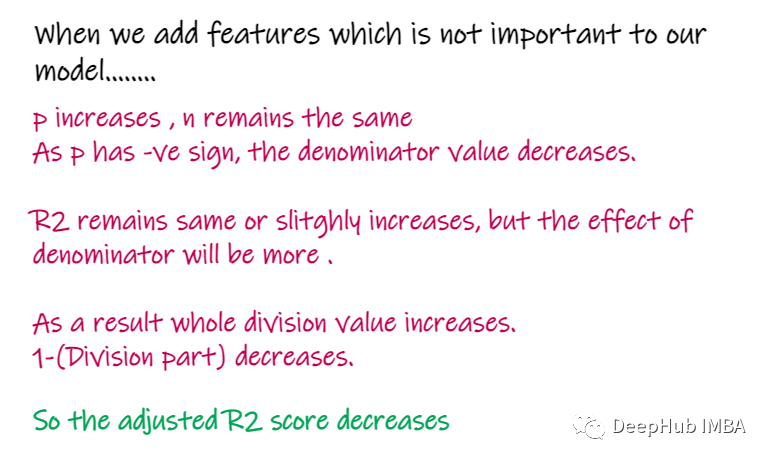
When we add features that are less important to our model , For example, add temperature to predict salary …
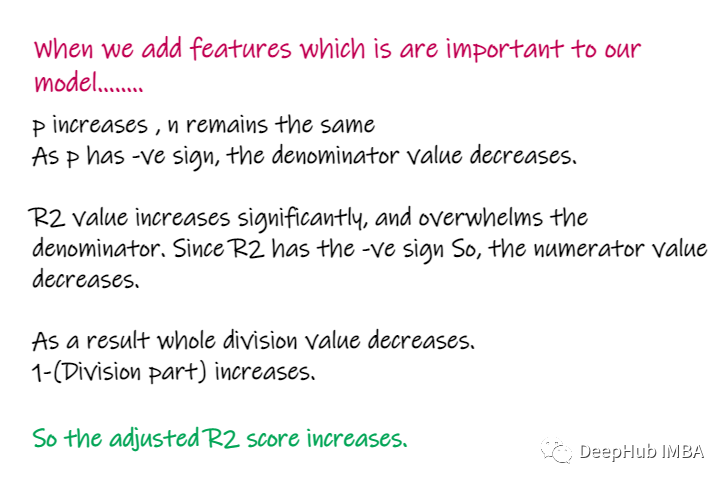
When adding features that are important to the model , For example, add interview scores to predict salary ……
The above is the important knowledge points of regression problems and the introduction of various important indicators used to solve regression problems, as well as their advantages and disadvantages , I hope it helped you .
https://avoid.overfit.cn/post/231a3a53616a42aebc8aba88e3e131c9
边栏推荐
- zdog. JS rocket turn animation JS special effects
- 手机版像素小鸟游js戏代码
- 磁盘存储链式的B树与B+树
- Tips of this week 135: test the contract instead of implementation
- 财富证券证券怎么开户?通过链接办理股票开户安全吗
- Threshold segmentation based on RGB image and threshold adjustment by sliding
- [trusted computing] Lesson 10: TPM password resource management (II)
- Using stored procedures, timers, triggers to solve data analysis problems
- 直播软件搭建,canvas文字加粗
- Chapter 1 Introduction to CRM core business
猜你喜欢
Hash, bitmap and bloom filter for mass data De duplication
![[trusted computing] Lesson 12: TPM authorization and conversation](/img/ce/619141fa0387ba42528f93b1781038.png)
[trusted computing] Lesson 12: TPM authorization and conversation

Sanxian Guidong JS game source code

漫画 | 宇宙第一 IDE 到底是谁?
讨论 | AR 应用落地前,要做好哪些准备?
![[PaddleSeg源码阅读] PaddleSeg Validation 中添加 Boundary IoU的计算(1)——val.py文件细节提示](/img/f2/b6a0e5512b35cf1b695a8feecd0895.png)
[PaddleSeg源码阅读] PaddleSeg Validation 中添加 Boundary IoU的计算(1)——val.py文件细节提示
Chapter 2 building CRM project development environment (building development environment)
What skills can you master to be a "master tester" when doing software testing?

机器人工程终身学习和工作计划-2022-
测试3个月,成功入职 “字节”,我的面试心得总结
随机推荐
Ansible learning summary (9) -- ansible loop, condition judgment, trigger, processing failure and other task control use summary
Yearning-SQL审核平台
SD_DATA_SEND_SHIFT_REGISTER
Chapter 3 business function development (user access project)
[paddleseg source code reading] add boundary IOU calculation in paddleseg validation (1) -- val.py file details tips
上市十天就下线过万台,欧尚Z6产品实力备受点赞
Automated testing: a practical skill that everyone wants to know about robot framework
Yarn capacity scheduler (ultra detailed interpretation)
Download, installation and development environment construction of "harmonyos" deveco
zdog.js火箭转向动画js特效
机器人工程终身学习和工作计划-2022-
Tips of the week 136: unordered containers
Import requirements in batches during Yolo training Txt
【蓝桥杯集训100题】scratch从小到大排序 蓝桥杯scratch比赛专项预测编程题 集训模拟练习题第17题
Main work of digital transformation
[tpm2.0 principle and Application guide] Chapter 5, 7 and 8
Pro2:修改div块的颜色
Performance test process and plan
[trusted computing] Lesson 11: TPM password resource management (III) NV index and PCR
socket編程之常用api介紹與socket、select、poll、epoll高並發服務器模型代碼實現