当前位置:网站首页>MATLAB绘图函数plot详解
MATLAB绘图函数plot详解
2022-08-02 14:10:00 【杨老头软工】
一、引言
Matlab软件提供了强大的可视化功能,可以根据给定的曲线上的坐标来绘制曲线图形,也可以根据已知的函数及自变量来绘制曲线图形,也可以只给定自变量的取值范围来绘制曲线,基本的Matlab函数是plot、fplot、ezplot、fimplicit等,本文详述利用plot绘制二维曲线图形的用法。
二、plot基本用法详述
基本语法:
plot(x,y,s)
其中x是横坐标(数组)、y是纵坐标(数组)、s是图元属性
其功能是根据横坐标和纵坐标数组绘制曲线。横坐标和图元属性s均可以缺省。
1)当横坐标缺省时,系统会自动指定横坐标位单位坐标;
2)当缺省s的时候,就是取点连线,即相邻的两个坐标点之间用直线连接,整体图形就是一条折线;
3)当给定了具体的属性s的时候,就根据属性s绘制不同的曲线。
属性s的常见值及图元线型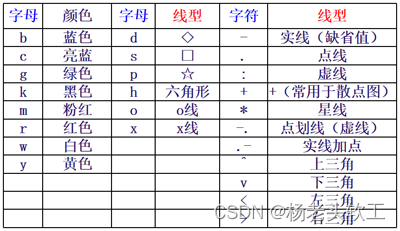
(一)已知曲线上点的坐标来绘制曲线图形
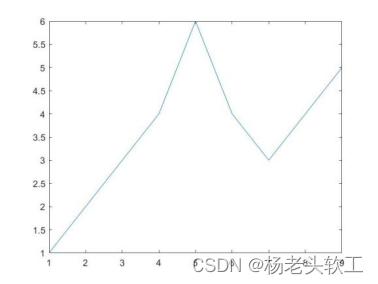
例1.已知横坐标和纵坐标,绘制曲线图。
%示例代码(1)
x = [ 1 : 9 ]; %横坐标
y = [1 2 3 4 6 4 3 4 5]; %纵坐标
plot( x ,y ) %绘图
%运行结果
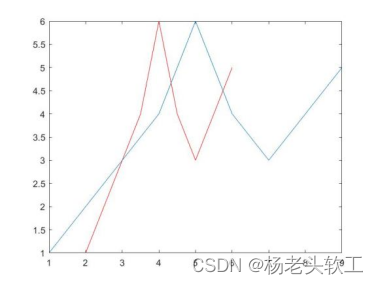
%示例代码(2)对比给定横坐标和系统缺省横坐标情况
x = [ 2 : 0.5 : 6 ]; %横坐标
y = [1 2 3 4 6 4 3 4 5]; %纵坐标
plot( x ,y ) %根据给定的横坐标和纵坐标绘图
hold on
plot( y, 'r' ) %根据给定的纵坐标绘图,横坐标为系统缺省,‘r’表示红色
%运行结果
(二)已知曲线的函数和自变量取值范围来绘制曲线图形
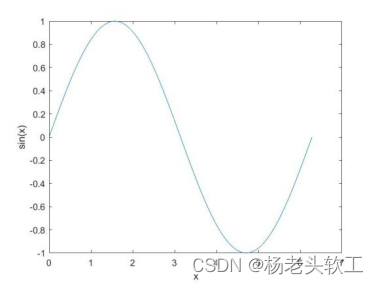
例2.绘制一个周期内的正弦曲线
%示例代码
x = [ 0: 0.01 : 2 ] * pi;%定义横坐标(自变量)的取值(数组)
y = sin( x );%计算纵坐标
plot( x, y );%利用plot绘制y=sin(x)曲线,此时会系统会新建一个图形窗口
xlabel( 'x' );%标记横坐标为x
ylabel( 'sin(x)' )%标记纵坐标为sin(x)
%运行结果
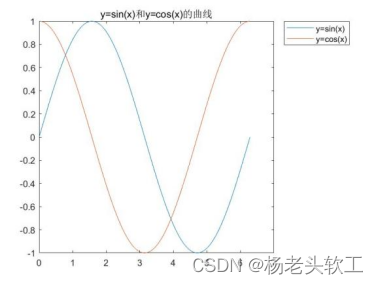
例3.在同一个窗口绘制一个周期内的正弦曲线和余弦曲线
%示例代码(1)
x = [ 0: 0.01 : 2 ] * pi;%定义横坐标(自变量)的取值(数组)
y1 = sin( x );%计算y=sin(x)纵坐标
y2 = cos( x );%计算y=cos(x)纵坐标
plot( x, y1, x, y2 );%在一个图形窗口同时绘制y=sin(x)和y=cos(x)曲线
legend( 'y=sin(x)', 'y=cos(x)', 'Location', 'northeastoutside' );%添加图例
title( 'y=sin(x)和y=cos(x)的曲线' );%添加图的标题
%运行结果
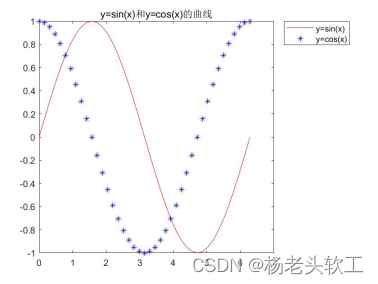
%示例代码(2)
x = [ 0: 0.05 : 2 ] * pi;%定义横坐标(自变量)的取值(数组)
plot( x, sin(x), 'r' );%用红色线绘制y=sin(x)曲线
hold on
plot( x, cos(x), 'b*' );%用蓝色*绘制y=cos(x)曲线
legend( 'y=sin(x)', 'y=cos(x)', 'Location', 'northeastoutside' );%添加图例
title( 'y=sin(x)和y=cos(x)的曲线' );%添加图的标题
%运行结果
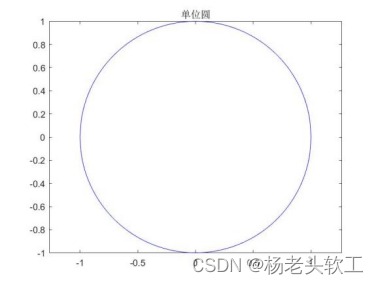
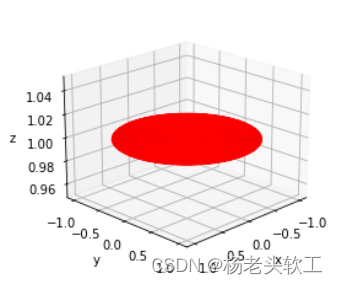
例4.绘制单位圆
%示例代码(1)
x = [ -1: 0.01 : 1 ];%定义横坐标(自变量)的取值(数组)
y = sqrt( 1 - x.^2 );
plot( x, y, 'b', x, -y, 'b' );%绘制单位圆,分上半圆和下半圆
title( '单位圆' );%添加图的标题
axis equal
%运行结果
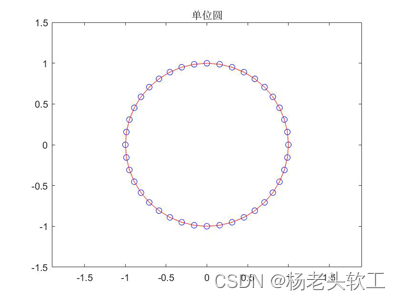
%示例代码(2)使用极坐标绘图
rou = 1;
theta= [ 0: 0.05 : 2 ] * pi;%定义极角theta的范围
x = rou * cos( theta );%横坐标
y = rou * sin( theta );%纵坐标
plot( x, y, 'bo' );%用蓝色的o绘制单位圆
hold on%保持住当前图形窗口,继续绘制后面的图形
plot( x, y, 'r' );%用红色实线再绘制单位圆
axis( [ -1.5, 1.5, -1.5, 1.5 ] );%指定坐标轴刻度范围
title( '单位圆' );%添加图的标题
axis equal
%运行结果
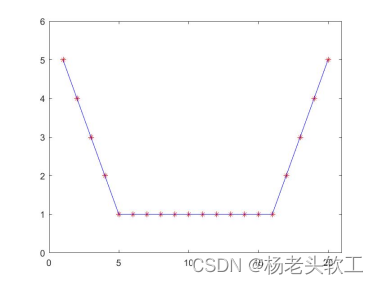
例5.绘制分段函数曲线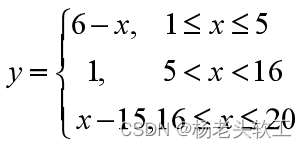
%示例代码
%方法一
clear all
clc
x1 = [ 1 : 5 ];
y1 = 6 - x1;
x2 = [ 6 : 15 ];
y2 = ones( size(x2) );
x3 = [ 16 : 20 ];
y3 = x3 - 15;
xx = [ x1, x2, x3 ];
yy = [ y1, y2, y3 ];
plot( xx, yy, 'r*' )
hold on
%方法二(数组元素过滤法)
x = [ 1 : 20 ];
y( x >= 1 & x <= 5 ) = 6 - x(x >= 1 & x <= 5 );
y( x >= 6 & x <= 15 ) = 1;
y( x >= 16  & x <= 20 ) = x(  x >= 16  & x <= 20  ) - 15;
xlen = length( x )
ylen = length( y )
plot( x, y, 'b' );
axis( [ 0, 21, 0, 6 ] );
%运行结果
边栏推荐
猜你喜欢


随机推荐
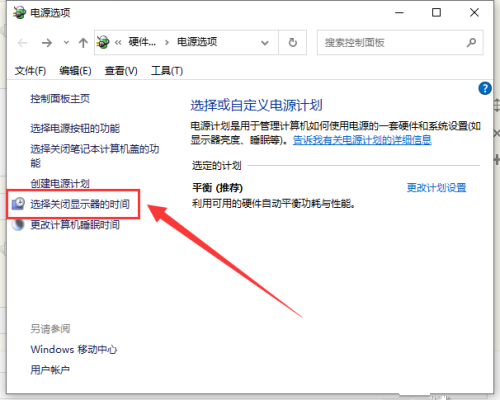
Win10 Settings screen out from lack of sleep?Win10 set the method that never sleep
CI24R1小模块2.4G收发模块无线通信低成本兼容si24r1/XN297超低功耗
Failed to install using npx -p @storybook/cli sb init, build a dedicated storybook by hand
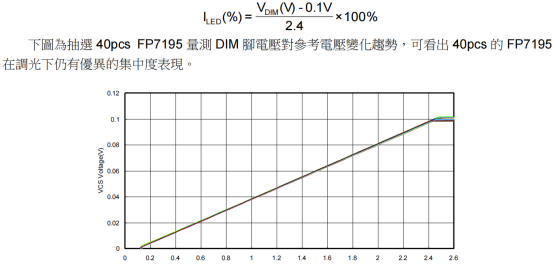
FP7195转模拟恒流调光芯片在机器视觉光源的应用优势
DP1332E内置c8051的mcu内核NFC刷卡芯片国产兼容NXP
BLE蓝牙5.2-PHY6222系统级芯片(SoC)智能手表/手环
推开机电的大门《电路》(二):功率计算与判断
小T成长记-网络篇-1-什么是网络?
Win10电脑需要安装杀毒软件吗?
使用libcurl将Opencv Mat的图像上传到文件服务器,基于post请求和ftp协议两种方法
Win11 computer off for a period of time without operating network how to solve
【我的电赛日记(三)】STM32学习笔记与要点总结
Redis的线程模型
Daily - Notes
FP7122降压恒流内置MOS耐压100V共正极阳极PWM调光方案原理图
LeetCode2 电话号码的字母组合
13.56MHZ刷卡芯片CI521兼容cv520/ci520支持A卡B卡MIFARE协议
[STM32 Learning 1] Basic knowledge and concepts are clear
STM32F1和F4的区别
casbin模型