当前位置:网站首页>并列图的画法,多排多列
并列图的画法,多排多列
2022-07-04 21:14:00 【小蜗笔记】
import matplotlib.pyplot as plt


plt.style.use('seaborn-whitegrid')
plt.rcParams['font.sans-serif']=['SimHei']
plt.rcParams['axes.unicode_minus'] = False
fig = plt.figure(figsize=(70, 60),dpi=60)

for i in range(1,42):
    ax = fig.add_subplot(7,6,i)
    ax.spines['bottom'].set_linewidth('1.0')#设置边框线宽为2.0
    ax.spines['bottom'].set_color('black')
    ax.spines['top'].set_linewidth('1.0')#设置边框线宽为2.0
    ax.spines['top'].set_color('black')
    ax.spines['right'].set_linewidth('1.0')#设置边框线宽为2.0
    ax.spines['right'].set_color('black')
    ax.spines['left'].set_linewidth('1.0')#设置边框线宽为2.0
    ax.spines['left'].set_color('black')
    plt.xticks(fontsize = 20)
    plt.yticks(fontsize = 20)

    plt.scatter(data_std_all[data_std_all['firm'] == i]['year'], data_std_all[data_std_all['firm'] == i]['tfpch'], c='black', edgecolors='black')
    plt.plot(data_std_all[data_std_all['firm'] == i]['year'], data_std_all[data_std_all['firm'] == i]['y_forecast'],color='black',linestyle = '-',linewidth=2, markersize=12)
    if len(data_std_all[(data_std_all['firm'] == i)&(data_std_all['group'] == 1)]['year']) !=0:
        plt.plot([data_std_all[(data_std_all['firm'] == i)&(data_std_all['group'] == 1)]['year'].iloc[0],data_std_all[(data_std_all['firm'] == i)&(data_std_all['group'] == 1)]['year'].iloc[0]],[-2.5,2.5],
             color='black',linestyle = '-.',linewidth=2, markersize=12)
    plt.ylim(-3, 3)
    plt.xlim(2009, 2022)
    plt.xticks(size=30)
    plt.yticks(size=30)
    plt.title(data_std_all[data_std_all['firm'] == i]['area'].iloc[0],size=30)


plt.show()
边栏推荐
- At the right time, the Guangzhou station of the city chain science and Technology Strategy Summit was successfully held
- MongoDB中的索引操作总结
- 解析互联网时代的创客教育技术
- A quick start to fastdfs takes you three minutes to upload and download files to the ECS
- [early knowledge of activities] list of recent activities of livevideostack
- Delphi soap WebService server-side multiple soapdatamodules implement the same interface method, interface inheritance
- Kubedm initialization error: [error cri]: container runtime is not running
- Analyzing the maker space contained in steam Education
- MongoDB聚合操作总结
- Redis has three methods for checking big keys, which are necessary for optimization
猜你喜欢
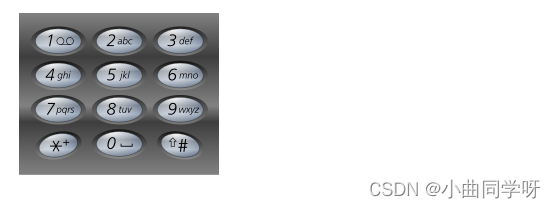
【LeetCode】17、电话号码的字母组合
解析steam教育中蕴含的众创空间
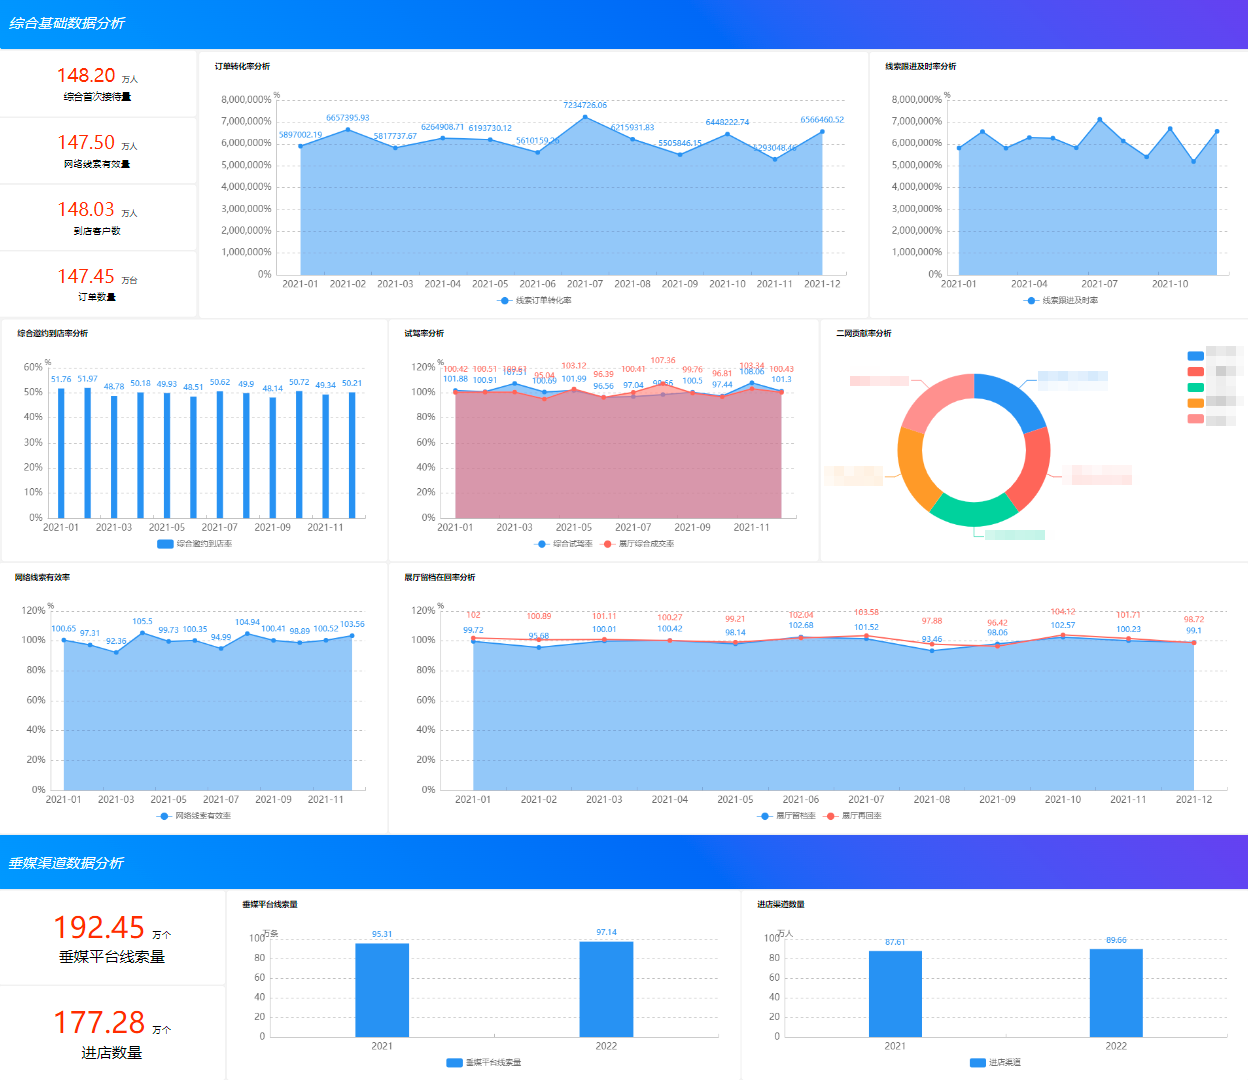
做BI开发,为什么一定要熟悉行业和企业业务?
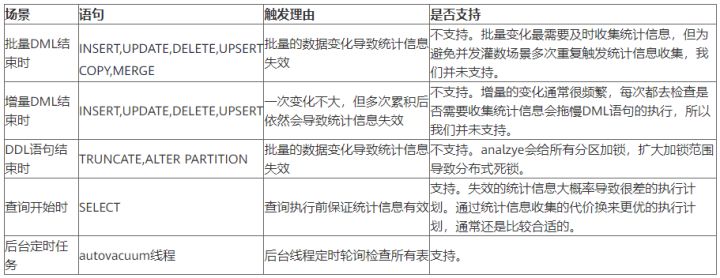
一文掌握数仓中auto analyze的使用
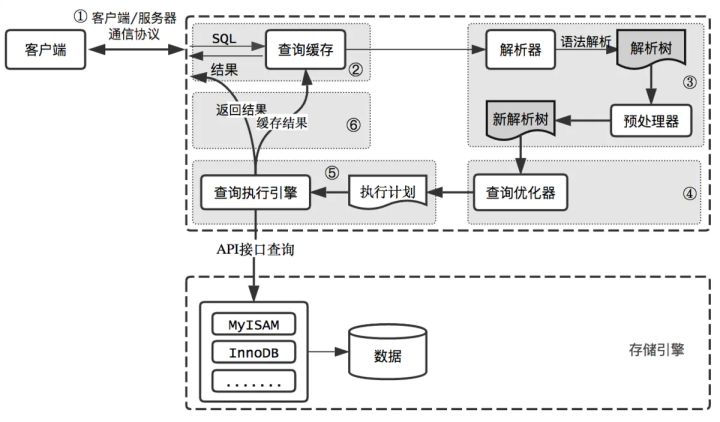
输入的查询SQL语句,是如何执行的?
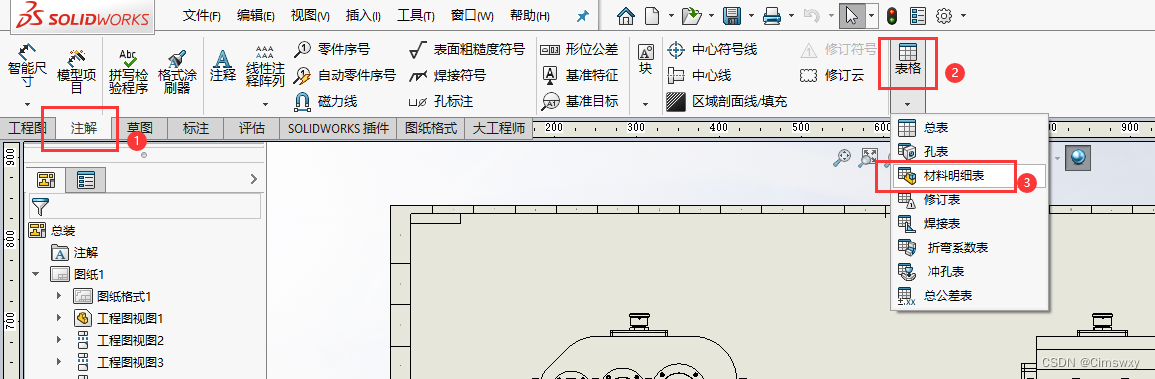
Operation of adding material schedule in SolidWorks drawing
Interpreting the development of various intelligent organizations in maker Education
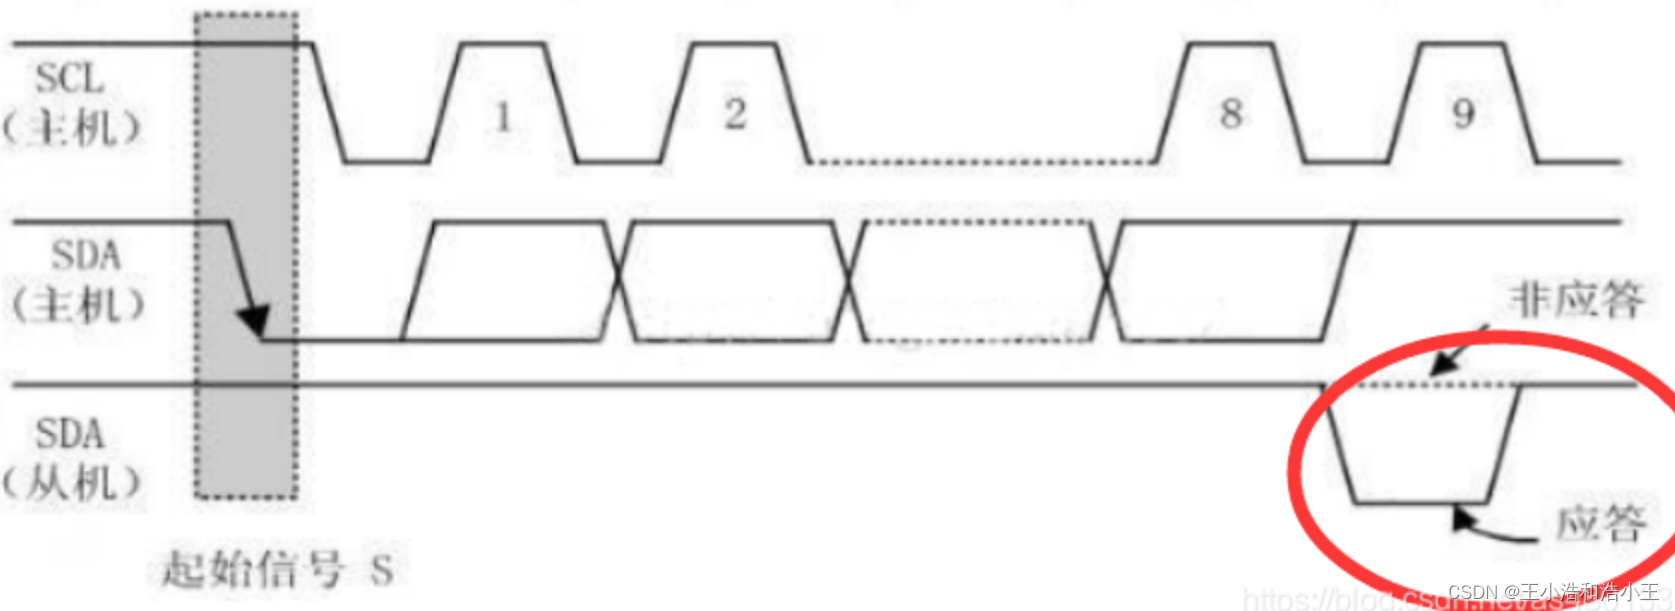
IIC (STM32)
Three or two things about the actual combat of OMS system
Case sharing | integrated construction of data operation and maintenance in the financial industry
随机推荐
Minidom module writes and parses XML
Drop down selection of Ehlib database records
Can be displayed in CAD but not displayed in print
Super detailed tutorial, an introduction to istio Architecture Principle and practical application
How much is the minimum stock account opening commission? Is it safe to open an account online
Solve the problem of data disorder caused by slow asynchronous interface
Daily question -leetcode1200- minimum absolute difference - array - sort
Redis transaction
【微信小程序】协同工作与发布
[leetcode] 17. Letter combination of telephone number
Jerry's ad series MIDI function description [chapter]
Delphi SOAP WebService 服务器端多个 SoapDataModule 实现相同的接口方法,接口继承
gtest从一无所知到熟练使用(3)什么是test suite和test case
MongoDB聚合操作总结
Stealing others' vulnerability reports and selling them into sidelines, and the vulnerability reward platform gives rise to "insiders"
每日一题-LeetCode1200-最小绝对差-数组-排序
【LeetCode】17、电话号码的字母组合
Jerry's ad series MIDI function description [chapter]
Delphi soap WebService server-side multiple soapdatamodules implement the same interface method, interface inheritance
[C language] deep understanding of symbols