当前位置:网站首页>[azure microservice service fabric] start the performance monitor in the SF node and set the method of capturing the process
[azure microservice service fabric] start the performance monitor in the SF node and set the method of capturing the process
2022-07-07 22:11:00 【51CTO】
Prerequisite
When we observe SF One of the nodes in the CPU Abnormal conditions , But because it can't be observed with the naked eye for a long time , So you can turn it on Performance Monitor To get the information of each process %Processer Time To analyze .
- Already Service Fabric Running and node is Windows operating system
- Sure RDP To node
Operation steps
Here's how to open Performance Monitor And how to set the capture process :( The first 5, The first 7 Step is the more important setting )
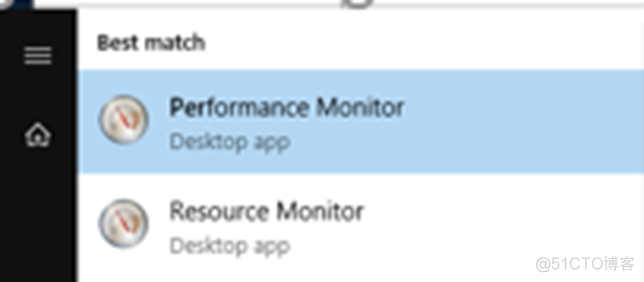
1)RDP To the node problem node , Open the start menu and enter “Performance Monitor” .
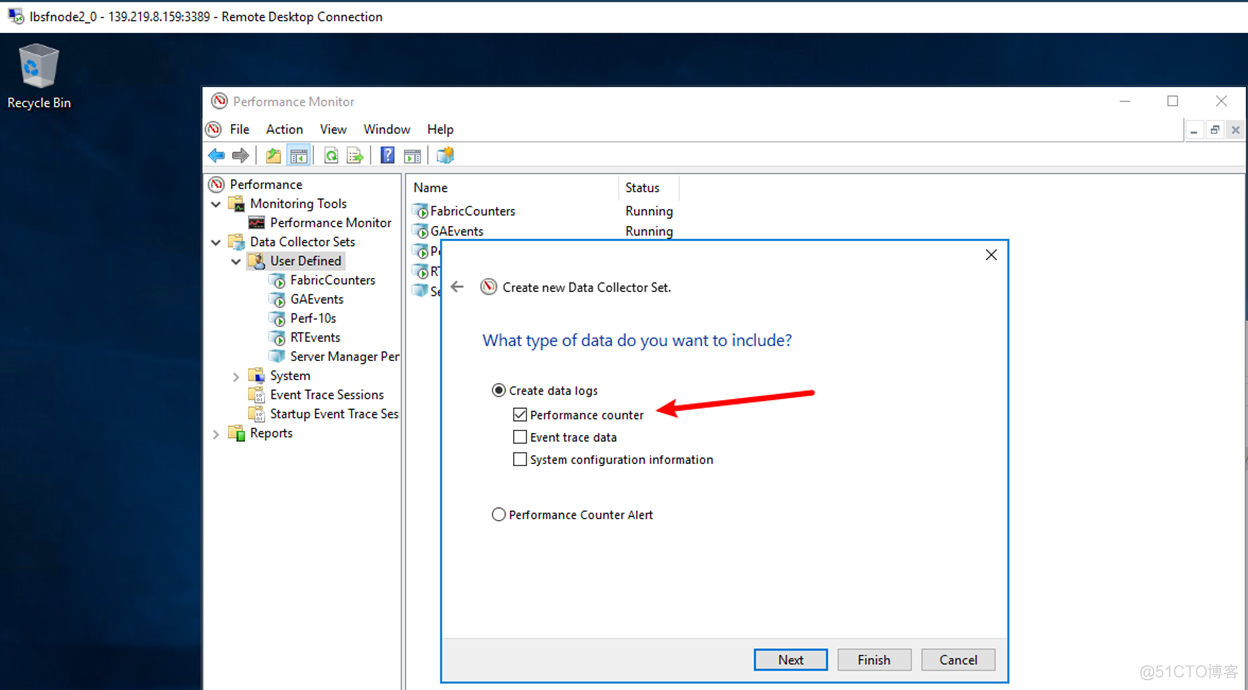
2) stay Performance Monitor in , choice Data Collector Sets -> User Defined -> New

3) Define the name of the collector , And select “Create manually”, then Next
4) At present, we only need to collect Performance counter The data of
5) A very critical step , Collect all Process Of Processor Time, And set the collection time to every 10 Collect once in a second (PS: The collection interval can be modified according to the actual situation )
Adding Performance counter Yes select as :Process Medium % Processor Time, stay Instances of selected object Choose from all instances
6) Choose where to save the file , Click on Finish complete .
7) Select the newly created... In the directory structure on the left Data Collector Set, And then in DataCollector01 The right choice Properties, Enter the following page .
- Because there are too many processes collected , So if you choose Binary Of Log Format Under the circumstances , Only _Total Information , It is not helpful for the analysis process , So the number in the figure 3 You need to choose Comma Separated, use CSV Format to save data .
8) After it has been modified , You can put the newly created Data Collector Set Change to start status . When the collection is long enough ( Include at least one regularity CPU The cycle of change ), Stop and save data .
9) When the fetch is complete , The final file format is as follows , You can analyze the changes of a single process in the file at a point in time .
When facing problems in a complex environment , The way to check things needs : The turbid and quiet Xu Qing , An Yidong's Xu Sheng . In the clouds , Just so !
边栏推荐
- ISO 26262 - considerations other than requirements based testing
- QT compile IOT management platform 39 alarm linkage
- The maximum number of meetings you can attend [greedy + priority queue]
- Jerry's power on automatic pairing [chapter]
- Dbsync adds support for mongodb and ES
- DBSync新增对MongoDB、ES的支持
- Record a garbled code during servlet learning
- Pre sale 179000, hengchi 5 can fire? Product power online depends on how it is sold
- 建立自己的网站(18)
- Typescript TS basic knowledge type declaration
猜你喜欢
It's worth seeing. Interview sites and interview skills
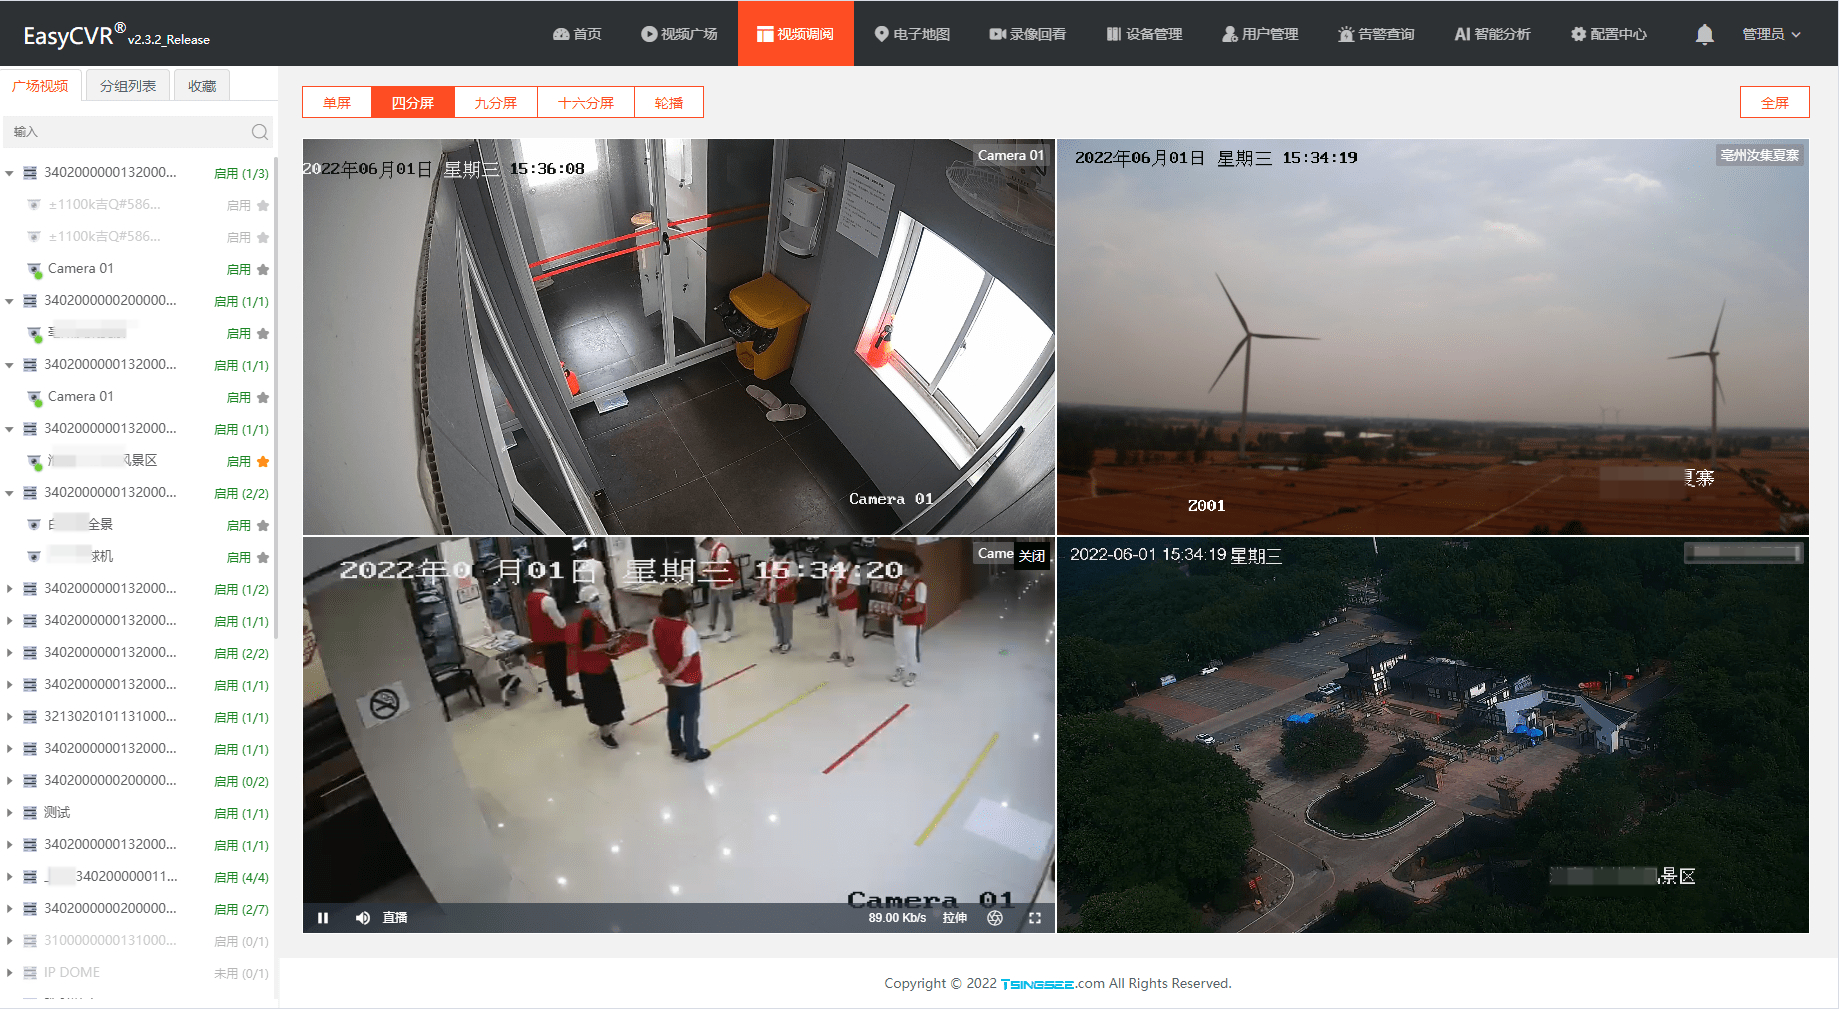
NVR hard disk video recorder is connected to easycvr through the national standard gb28181 protocol. What is the reason why the device channel information is not displayed?
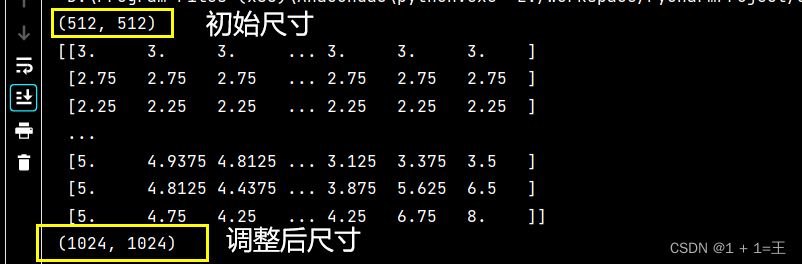
Cv2.resize function reports an error: error: (-215:assertion failed) func= 0 in function ‘cv::hal::resize‘
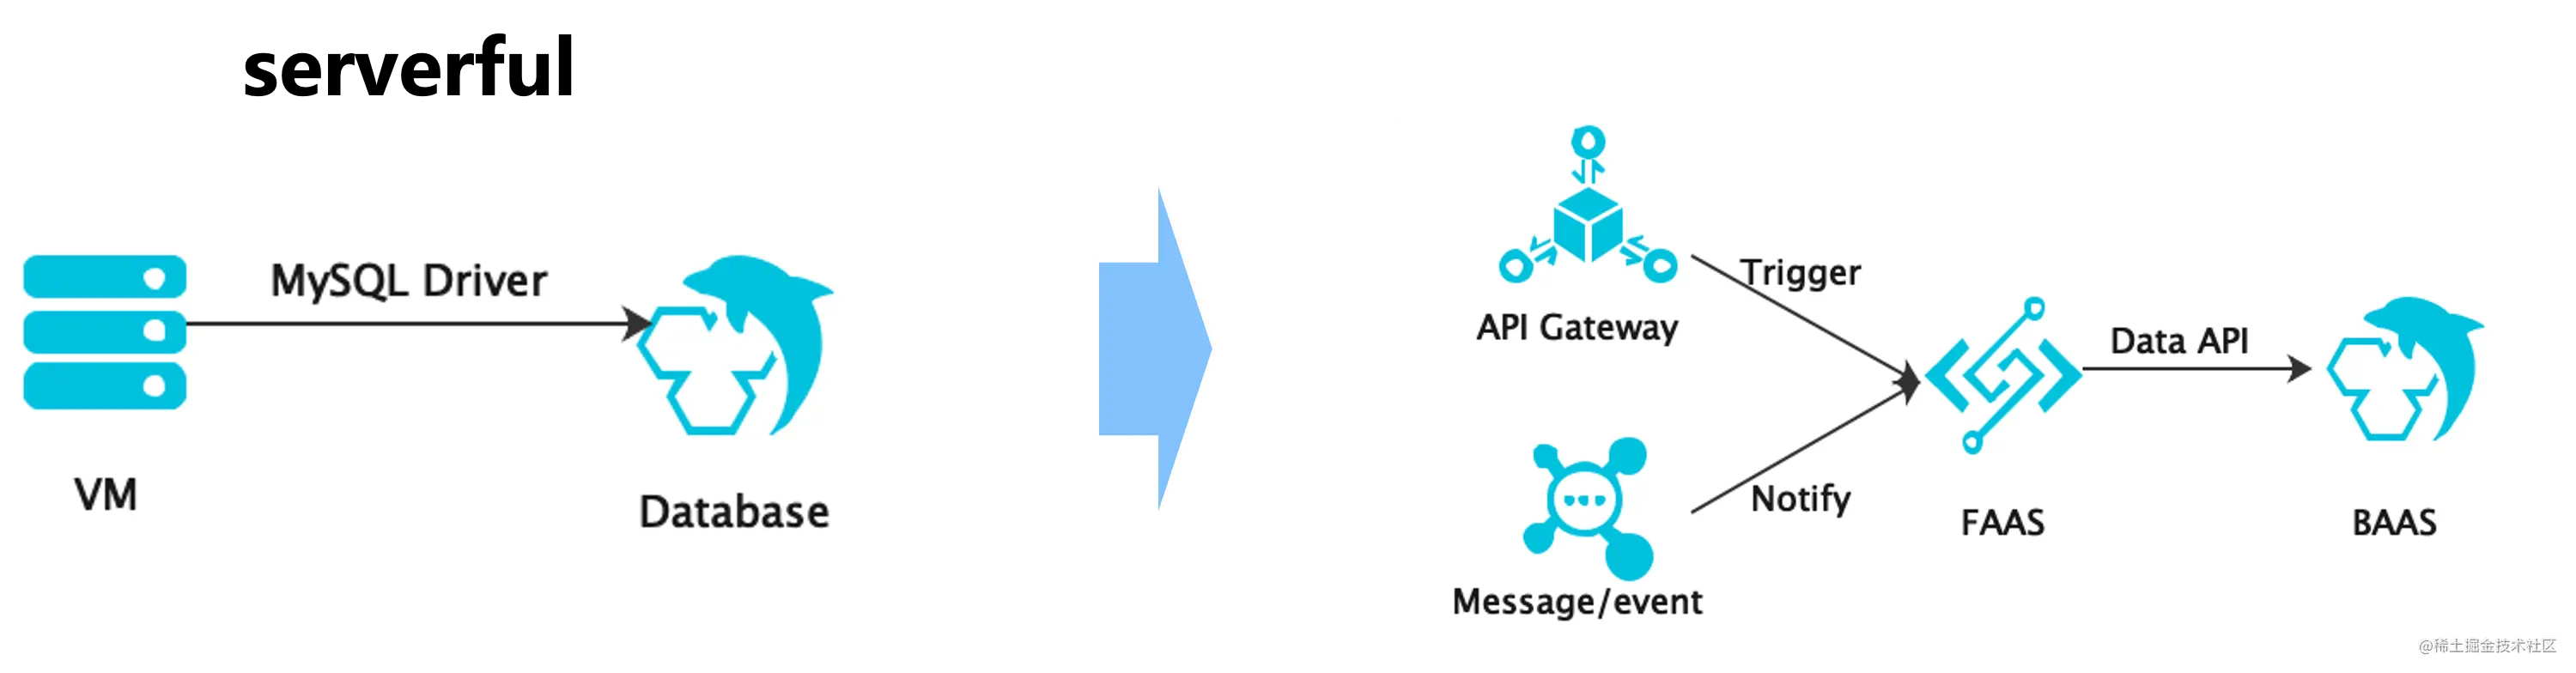
Talk about relational database and serverless
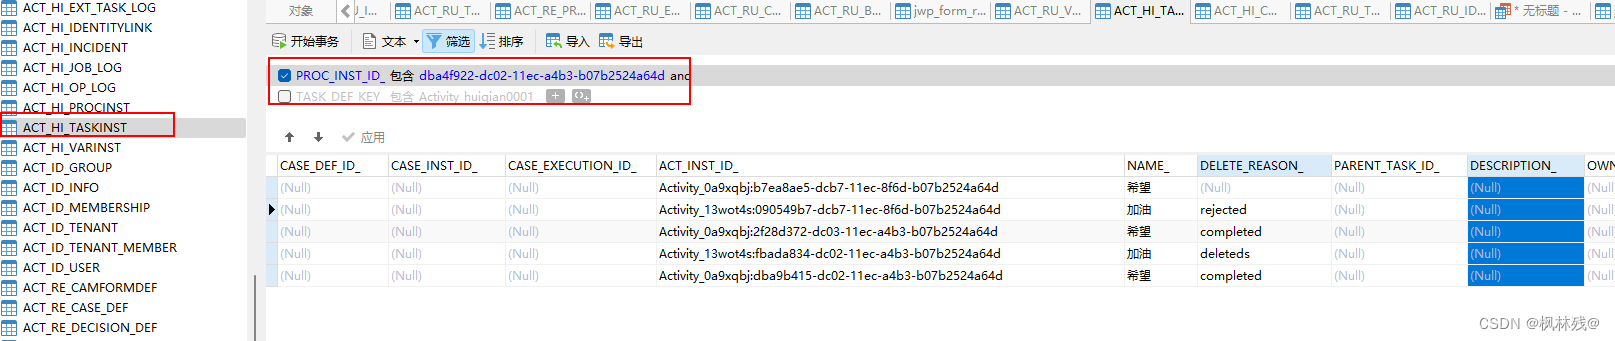
Use camunda to do workflow design and reject operations
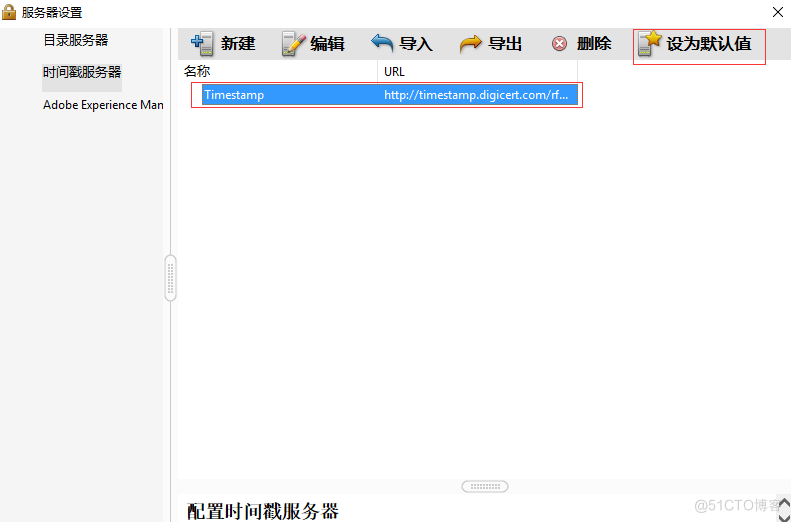
Pdf document signature Guide
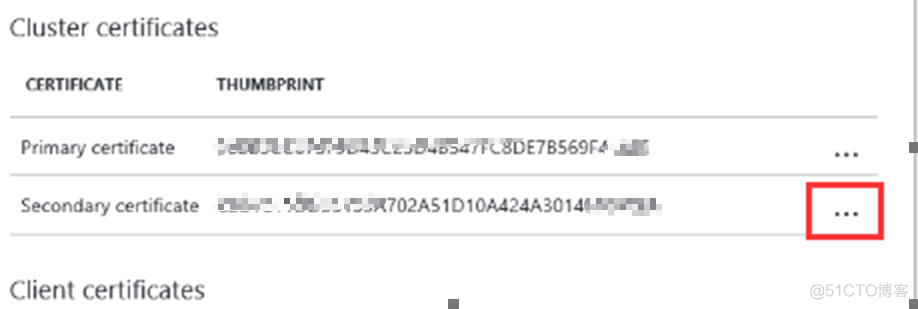
【Azure微服务 Service Fabric 】因证书过期导致Service Fabric集群挂掉(升级无法完成,节点不可用)
![Jerry's test box configuration channel [chapter]](/img/d4/fb67f5ee0fe413c22e4e5cd5037938.png)
Jerry's test box configuration channel [chapter]

Goal: do not exclude yaml syntax. Try to get started quickly
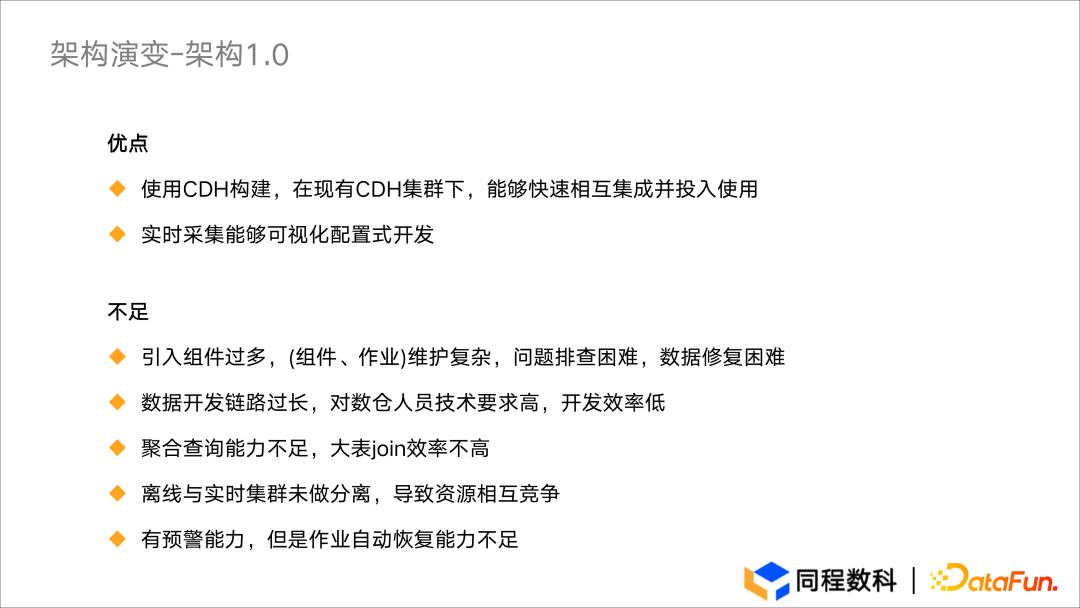
应用实践 | 数仓体系效率全面提升!同程数科基于 Apache Doris 的数据仓库建设
随机推荐
DNS series (I): why does the updated DNS record not take effect?
用语雀写文章了,功能真心强大!
The latest Android interview collection, Android video extraction audio
应用实践 | 数仓体系效率全面提升!同程数科基于 Apache Doris 的数据仓库建设
Ad domain group policy management
Cv2.resize function reports an error: error: (-215:assertion failed) func= 0 in function ‘cv::hal::resize‘
Pre sale 179000, hengchi 5 can fire? Product power online depends on how it is sold
[open source] Net ORM accessing Firebird database
【colmap】稀疏重建转为MVSNet格式输入
NVR硬盤錄像機通過國標GB28181協議接入EasyCVR,設備通道信息不顯示是什麼原因?
[azure microservice service fabric] how to transfer seed nodes in the service fabric cluster
Take the intersection of two sets
Use br to recover backup data on azure blob storage
Use json Stringify() to realize deep copy, be careful, there may be a huge hole
An in-depth understanding of fp/fn/precision/recall
【JDBC Part 1】概述、获取连接、CRUD
ISO 26262 - considerations other than requirements based testing
PKPM 2020软件安装包下载及安装教程
Backup tidb cluster to persistent volume
Use br to back up tidb cluster data to azure blob storage