当前位置:网站首页>机器学习在房屋价格预测上的应用
机器学习在房屋价格预测上的应用
2022-07-04 22:46:00 【Wu_Candy】
前言
Python 在机器学习方面有天然的优势,那么我们今天也来涉足一下机器学习方面的技术,以下是在学习过程中的一些笔记,里面有大量的注释说明,用于理解为什么这样操作。
涉及到的数据见资源共享的文章--机器学习-数据集(预测房价)
代码实现如下:
Numpy & Pandas & Matplotlib & Ipython
#NumPy(Numerical Python) 是 Python 语言的一个扩展程序库,支持大量的维度数组与矩阵运算,此外也针对数组运算提供大量的数学函数库。
import numpy as np

#Pandas 可以对各种数据进行运算操作,比如归并、再成形、选择,还有数据清洗和数据加工特征
import pandas as pd

#Matplotlib 是 Python 的绘图库。 它可与 NumPy 一起使用,提供了一种有效的 MatLab 开源替代方案
import matplotlib.pyplot as plt

#Ipython.display的库是用来展示图片的
from IPython.display import Image
from sklearn.model_selection import train_test_split

import  warnings
warnings.filterwarnings('ignore')

data = pd.read_csv("train.csv")
print(type(data))
print(data.info())
print(data.shape)
print(data.head())
print(data[['MSSubClass','LotArea']])
数据集合&缺失值
#选择数据集合中的几个重要特征
data_select = data[['BedroomAbvGr','LotArea','Neighborhood','SalePrice']]

#对数据集中的字段进行重命名
data_select = data_select.rename(columns={'BedroomAbvGr':'room','LotArea':'area'})
print(data_select)
print(data_select.shape)
print("*"*100)

#判断缺失值一般采用 isnull(),然而生成的却是所有数据的true/false矩阵
print(data_select.isnull())

#df.isnull().any()则会判断哪些”列”存在缺失值
print(data_select.isnull().any())

#只显示存在缺失值的行列,清楚的确定缺失值的位置
print(data_select.isnull().values==True)

#对缺失的数据进行过滤
data_select=data_select.dropna(axis=0)
print(data_select.shape)
print(data_select.head())

#print(np.take(data_select.columns,[0,1,3]))
#print(type(np.take(data_select.columns,[0,1,3])))
归一化处理
#数太大,归一化,让数据的分布处于同一区间,咱们选择一种最简单的数据调整方法,每一个数除以其最大值
for col in np.take(data_select.columns,[0,1,-1]):
    # print(col)
    # print(data_select[col])
    data_select[col] /= data_select[col].max()

print(data_select.head())

#分配测试数据和训练数据
train,test = train_test_split(data_select.copy(),test_size=0.9)
print(train.shape)
print(test.shape)
print(test.describe())


#numpy 里面axis=0 and axis=1 的使用示例说明:
print("="*50)
data=np.array([[1,2,3,4],[5,6,7,8],[9,10,11,12]])
print(data)
print(data.shape) #shape=[3,4] 即为3行4列
print(np.sum(data)) #在numpy中若没有指定axis,默认对所有的数据相加

print(np.sum(data,axis=0))#若指定了axis=0,则沿着第一个维度的方向进行计算,即为3 按列中的3个数据进行计算,得到4组列数据计算结果

print(np.sum(data,axis=1))#若指定了axis=1,则沿着第二个维度的方向进行计算,即为4 按行中的4个数据进行计算,得到3组行数据计算结果

print("="*50)

#pandas 里面axis=0 and axis=1 的使用示例说明:
#如果我们调用df.mean(axis=1),我们将得到按行计算的均值
df=pd.DataFrame(np.arange(12).reshape(3,4))
print(df)

print(df.mean()) #在pandas中,如果没有指定axis,则默认按axis=0来计算

print(df.mean(axis=0)) #若指定了axis=0,则按照第一个维度的变化方向来计算,即为3 按列中的3个数据进行计算,得到4组列数据计算结果

print(df.mean(axis=1)) #若指定了axis=1,则按照第二个维度的变化方向来计算,即为4 按行中的4个数据进行计算,得到3组行数据计算结果
线性回归模型
#线性回归模型,假设 h(x) = wx + b 是线性的.
def linear(features,pars):
    print("the pars is:",pars)
    print(pars[:-1])
    price=np.sum(features*pars[:-1],axis=1)+pars[-1]
    return price

print("*"*100)
train['predict']=linear(train[['room','area']].values,np.array([0.1,0.1,0.0]))

#能够看到,在该参数下,模型的预测价格和真实价格有较大的差距.那么寻找合适的参数值是咱们须要作的事情
print(train.head())


#预测函数为 h(x) = wx + b
#偏差的平方和函数:
def mean_squared_error(pred_y,real_y):
    return sum(np.array(pred_y-real_y)**2)

#损失函数:
def lost_function(df,features,pars):
    df['predict']=linear(df[features].values,pars)
    cost=mean_squared_error(df.predict,df.SalePrice)/len(df)
    return cost

cost=lost_function(train,['room','area'],np.array([0.1,0.1,0.1]))
print(cost)

#linspace函数原型:linspace(start, stop, num=50, endpoint=True, retstep=False, dtype=None)
#作用为:在指定的大间隔内,返回固定间隔的数据。他将返回“num”个等间距的样本,在区间[start, stop]中。其中,区间的结束端点可以被排除在外,默认是包含的。
num=100
Xs = np.linspace(0,1,num)
Ys = np.linspace(0,1,num)
print(Xs) #如果num=5 ->[0.   0.25 0.5  0.75 1.  ]
print(Ys) #如果num=5 ->[0.   0.25 0.5  0.75 1.  ]

#zeros函数原型:zeros(shape, dtype=float, order='C')
#作用:通常是把数组转换成想要的矩阵;
#示例:np.zeros((2,3),dtype=np.int)
Zs = np.zeros([num,num]) #100*100的矩阵,值全为0.
print(Zs)

#meshgrid 从坐标向量中返回坐标矩阵
Xs,Ys=np.meshgrid(Xs,Ys)
print(Xs.shape,Ys.shape)
print(Xs) #如果num=5 则处理后的矩阵为:
'''
[[0.   0.25 0.5  0.75 1.  ]
 [0.   0.25 0.5  0.75 1.  ]
 [0.   0.25 0.5  0.75 1.  ]
 [0.   0.25 0.5  0.75 1.  ]
 [0.   0.25 0.5  0.75 1.  ]]
'''
print(Ys) #如果num=5 则处理后的矩阵为:
'''
[[0.   0.   0.   0.   0.  ]
 [0.25 0.25 0.25 0.25 0.25]
 [0.5  0.5  0.5  0.5  0.5 ]
 [0.75 0.75 0.75 0.75 0.75]
 [1.   1.   1.   1.   1.  ]]
'''
W1=[]
W2=[]
Costs=[]

for i in range(100):
    for j in range(100):
        W1.append(0.01*i)
        W2.append(0.01*j)
        Costs.append(lost_function(train,['room','area'],np.array([0.01*i,0.01*j,0.])))
#numpy.argmin(a, axis=None, out=None)
#a:一个矩阵
#axis:整数,可选(没选择的话就是整个数组的展开)(0:行,1列)
#返回小值的下标
index=np.array(lost_function).argmin()
print(W1[index],W2[index],Costs[index])

from mpl_toolkits.mplot3d import Axes3D
fig=plt.figure()
ax = fig.add_subplot(111,projection='3d')
ax.view_init(5,-15)
ax.scatter(W1,W2,Costs,s=10)
ax.scatter(0.58,0.28, zs=lost_function(train,['room','area'],np.array([0.58,0.28,0.0])),s=100,color='red')
plt.xlabel('rooms')
plt.ylabel('llotArea')
plt.show()end
边栏推荐
- Talk about Middleware
- Notepad++--编辑的技巧
- Attack and defense world misc advanced zone 2017_ Dating_ in_ Singapore
- 攻防世界 MISC 进阶区 3-11
- Redis入门完整教程:Pipeline
- On-off and on-off of quality system construction
- Tweenmax emoticon button JS special effect
- A complete tutorial for getting started with redis: redis shell
- 【ODX Studio编辑PDX】-0.2-如何对比Compare两个PDX/ODX文件
- The solution to the lack of pcntl extension under MAMP, fatal error: call to undefined function pcntl_ signal()
猜你喜欢

JS 3D explosive fragment image switching JS special effect

Redis introduction complete tutorial: slow query analysis
A complete tutorial for getting started with redis: redis shell
Redis démarrer le tutoriel complet: Pipeline
Redis getting started complete tutorial: Key Management
The overview and definition of clusters can be seen at a glance
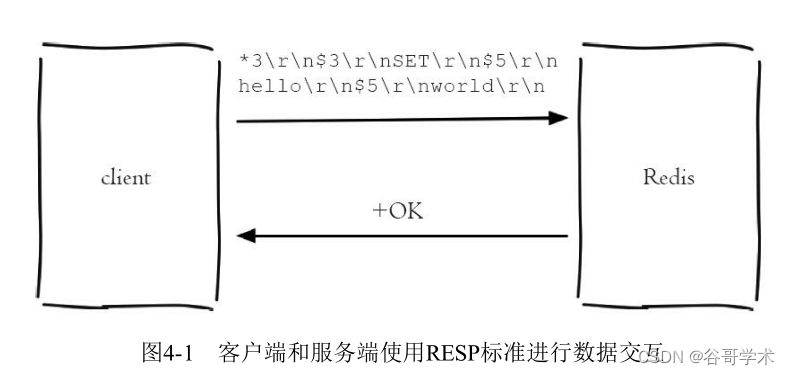
Redis introduction complete tutorial: client communication protocol
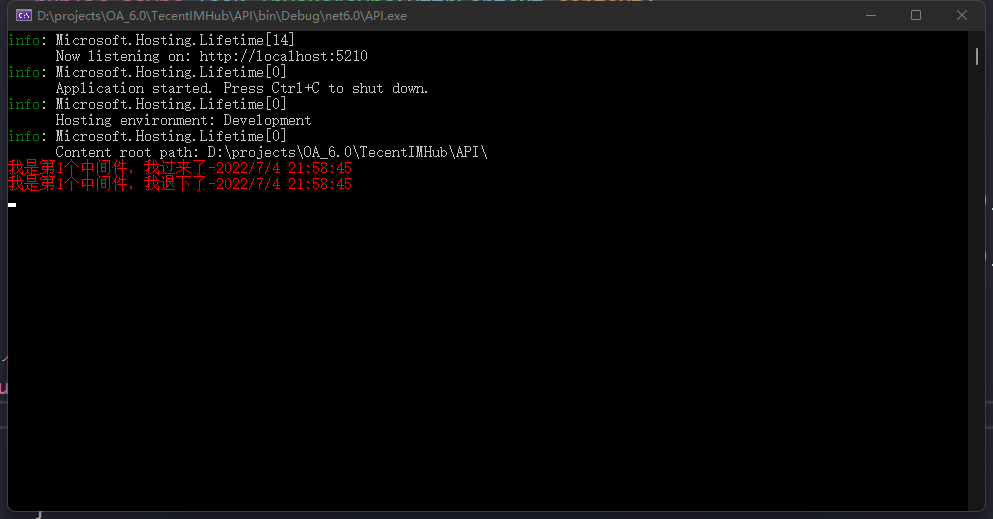
浅聊一下中间件
Analysis of the self increasing and self decreasing of C language function parameters
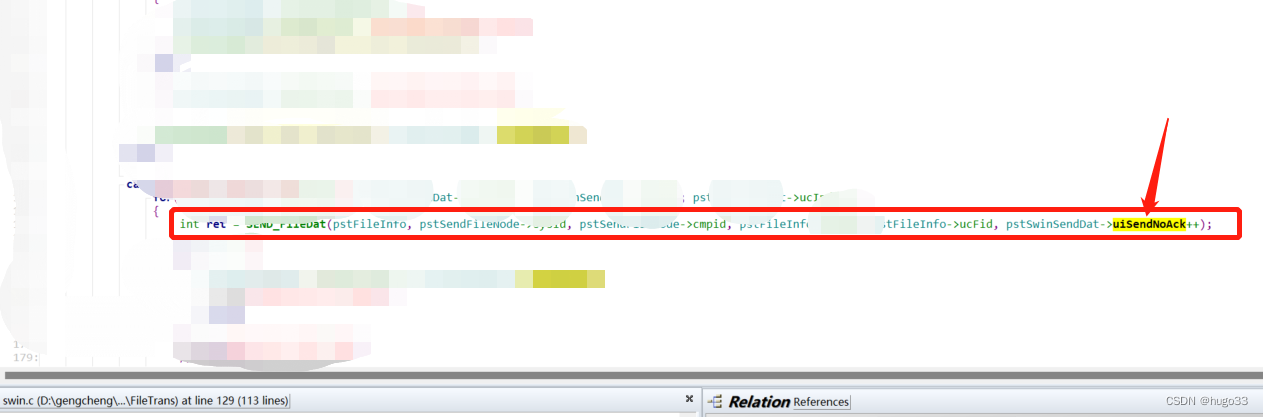
Serial port data frame
随机推荐
Analysis of environmental encryption technology
剑指 Offer 65. 不用加减乘除做加法
Redis démarrer le tutoriel complet: Pipeline
Editplus-- usage -- shortcut key / configuration / background color / font size
Qt加法计算器(简单案例)
Sobel filter
Redis入门完整教程:GEO
图片懒加载的原理
金融市场,资产管理与投资基金
PS style JS webpage graffiti board plug-in
【ODX Studio编辑PDX】-0.2-如何对比Compare两个PDX/ODX文件
Set up a website with a sense of ceremony, and post it to 1/2 of the public network through the intranet
Google Earth engine (GEE) - globfire daily fire data set based on mcd64a1
Redis introduction complete tutorial: List explanation
S32 Design Studio for ARM 2.2 快速入门
为什么信息图会帮助你的SEO
Redis入门完整教程:Bitmaps
【ODX Studio編輯PDX】-0.2-如何對比Compare兩個PDX/ODX文件
The small program vant tab component solves the problem of too much text and incomplete display
How can enterprises cross the digital divide? In cloud native 2.0