当前位置:网站首页>Web service performance monitoring scheme
Web service performance monitoring scheme
2022-07-07 03:58:00 【The season when the monsoon dies】
One 、 Use of local testing tools
advantage :
- Trigger multiple requests at once , And each parameter can change dynamically , It is helpful to make up for the insufficient coverage of single unit test scenarios of interfaces
- It can complete the qualitative test of interface performance , Make preliminary selection for interface performance test .
- Developers share a development environment database , It is convenient for you to have an intuitive and comprehensive understanding of all microservice interface tests
defects :
- Local machines vary in performance , And the number of concurrent threads cannot be controlled . As a result, the response time results of interface test fluctuate greatly , The result data of quantitative analysis on the degree of interface performance is not reliable .
- It is impossible to make sequential link calls to test the overall performance of a module's interface .
- When an interface parameter depends on the result of the previous interface , To ensure a desired interface hit rate through regular expressions , More troublesome .
- It is impossible to measure the actual operation of the interface after it passes through the gateway .
Conclusion :
Local testing tools are only applicable to developing interfaces at interfaces , Complete the interface unit test and preliminary performance test locally , Want to complete the quantitative analysis of interface performance and the full link analysis of interface calls , We have to rely on other tools .
Two 、 Development environment interface performance testing and monitoring
Due to the instability of the local environment and the short board of the local interface test tool , So we need a stable environment to deploy other tools to make up , This environment is preferably a development environment .
Request sending and monitoring tools jmeter
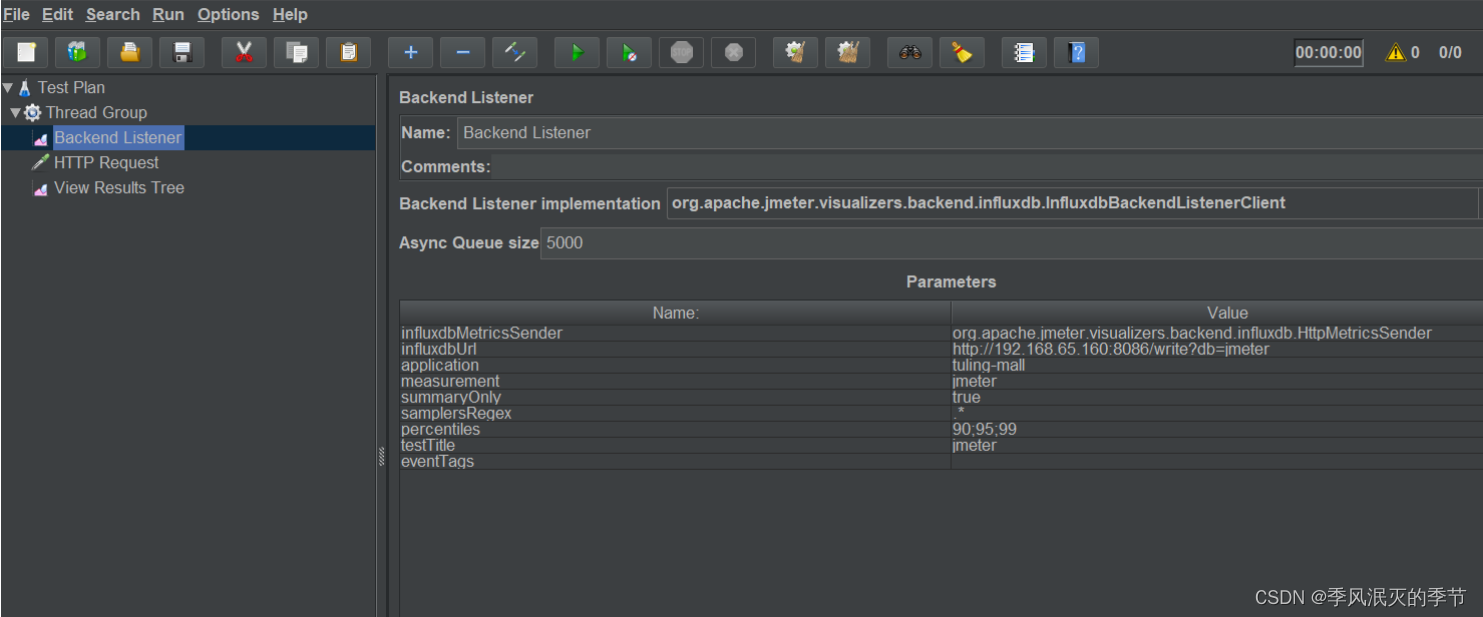
The request sending tool of the development environment uses jmeter, It can make up for the shortage of local testing tools , Such as :
- It can generate a continuous and stable number of concurrent messages sent to an interface , Measured interface TPS Value in steady state .
- It can realize the sequential link call of the interface , Test the whole module TPS value .
- You can get the request parameters according to the file , Improve the hit rate of the interface .
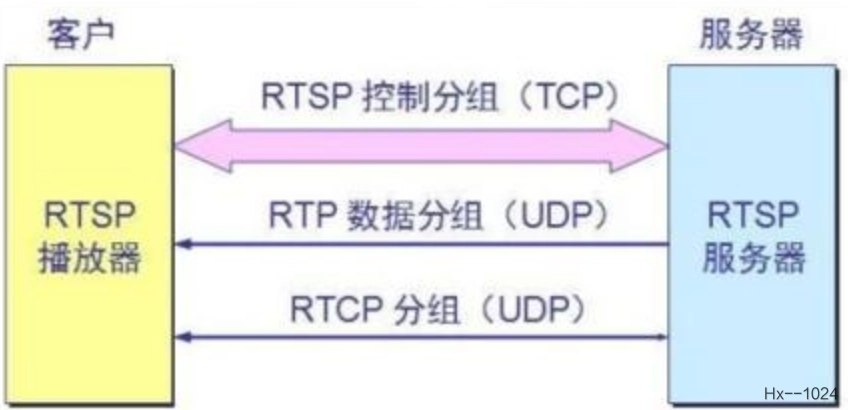
Request link analysis tool skywalking
In the course of the request , If an interface is found TQS Couldn't get on , You can use skywalking It takes time to analyze each link .


Prometheus+Grafana Monitor performance metrics
Jmeter monitor
You can see it clearly Jmeter The total number of requests 、 Number of failures 、TPS Change trend and other information during interface debugging

web Application monitoring
Main monitoring jvm Usage and garbage collection 
Mysql monitor
monitor mysql Connection number 、QPS、 Slow query, etc

Redis monitor
Main monitoring redis Memory 、 The Internet IO、 Of each database key Value usage .
web Apply performance analysis tools Arthas
Prometheus+Grafana It can be done to web Monitoring to jvm Usage and GC situation , But to analyze the specific reasons, we have to rely on Arthas.
As per cpu Usage analysis thread state


3、 ... and 、 Summary of interface test steps
Local testing :
Complete the unit test through the local interface test tool , And the preliminary selection of performance test , If the interface test results cannot meet the query 300 Time /s, Additions and deletions 100 Time /s, Then debug the development environment .
Development environment debugging :
- Deploy in the development environment jmeter、skywalking、Prometheus、Grafana And other monitoring tools and configure relevant monitoring parameters .
- Use jmeter Make concurrent requests for interfaces that need to be debugged in the development environment , Observe each middleware and web Service cpu usage , Find out the performance bottleneck of the link .
边栏推荐
- 19. (ArcGIS API for JS) ArcGIS API for JS line acquisition (sketchviewmodel)
- 力扣------路径总和 III
- Implementation steps of docker deploying mysql8
- List interview common questions
- ubuntu20安装redisjson记录
- 1.19.11.SQL客户端、启动SQL客户端、执行SQL查询、环境配置文件、重启策略、自定义函数(User-defined Functions)、构造函数参数
- cuda编程
- The true face of function pointer in single chip microcomputer and the operation of callback function
- Implementation of binary search tree
- Ubuntu20 installation redisjson record
猜你喜欢
List interview common questions
Kbone与小程序跨端开发的一些思考
![[MySQL] row sorting in MySQL](/img/97/8a451fa62796838e11242c86eecd8d.png)
[MySQL] row sorting in MySQL

Introduction to opensea platform developed by NFT trading platform (I)

21. (article ArcGIS API for JS) ArcGIS API for JS rectangular acquisition (sketchviewmodel)
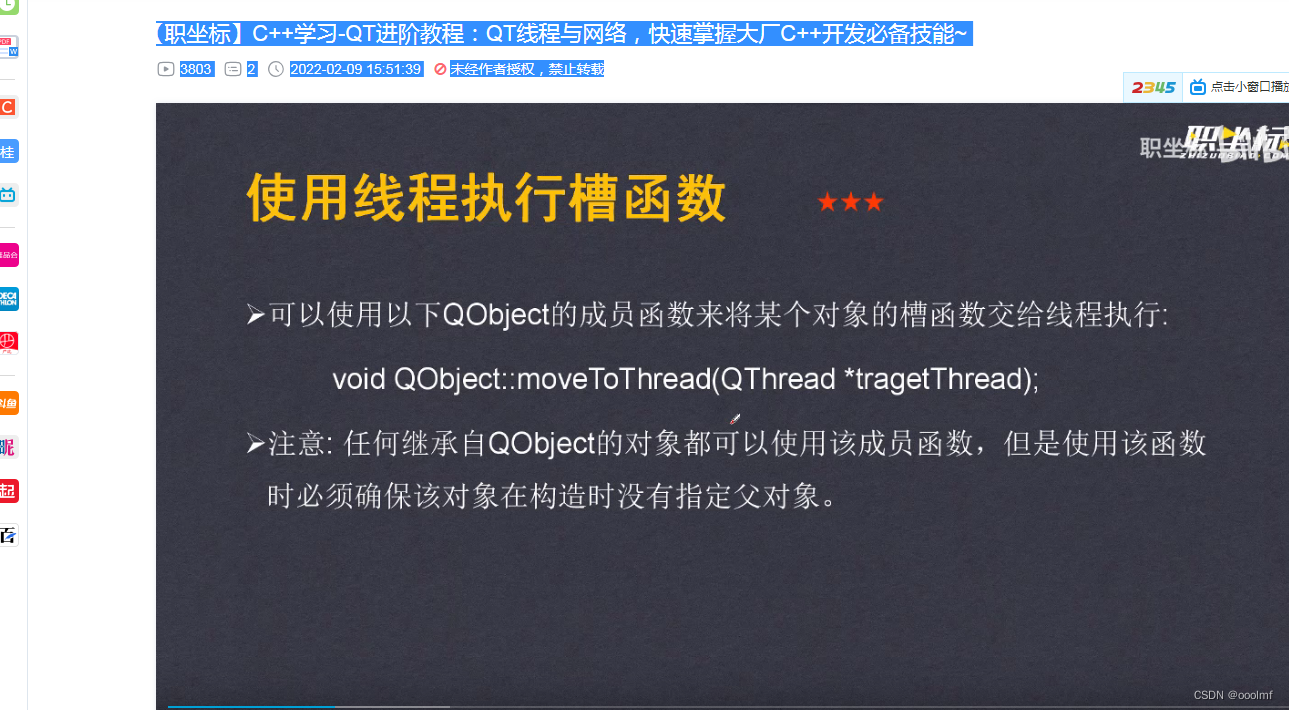
qt-线程等01概念
海思3559万能平台搭建:RTSP实时播放的支持
My brave way to line -- elaborate on what happens when the browser enters the URL
![[dpdk] dpdk sample source code analysis III: dpdk-l3fwd_ 001](/img/f6/dced69ea36fc95ef84bb546c56dd91.png)
[dpdk] dpdk sample source code analysis III: dpdk-l3fwd_ 001
【DPDK】dpdk样例源码解析之三:dpdk-l3fwd_001
随机推荐
我的勇敢对线之路--详细阐述,浏览器输入URL发生了什么
ggplot 分面的细节调整汇总
机器学习笔记 - 使用机器学习进行鸟类物种分类
Implementation of binary search tree
AVL树插入操作与验证操作的简单实现
SSL certificate deployment
U.S. Air Force Research Laboratory, "exploring the vulnerability and robustness of deep learning systems", the latest 85 page technical report in 2022
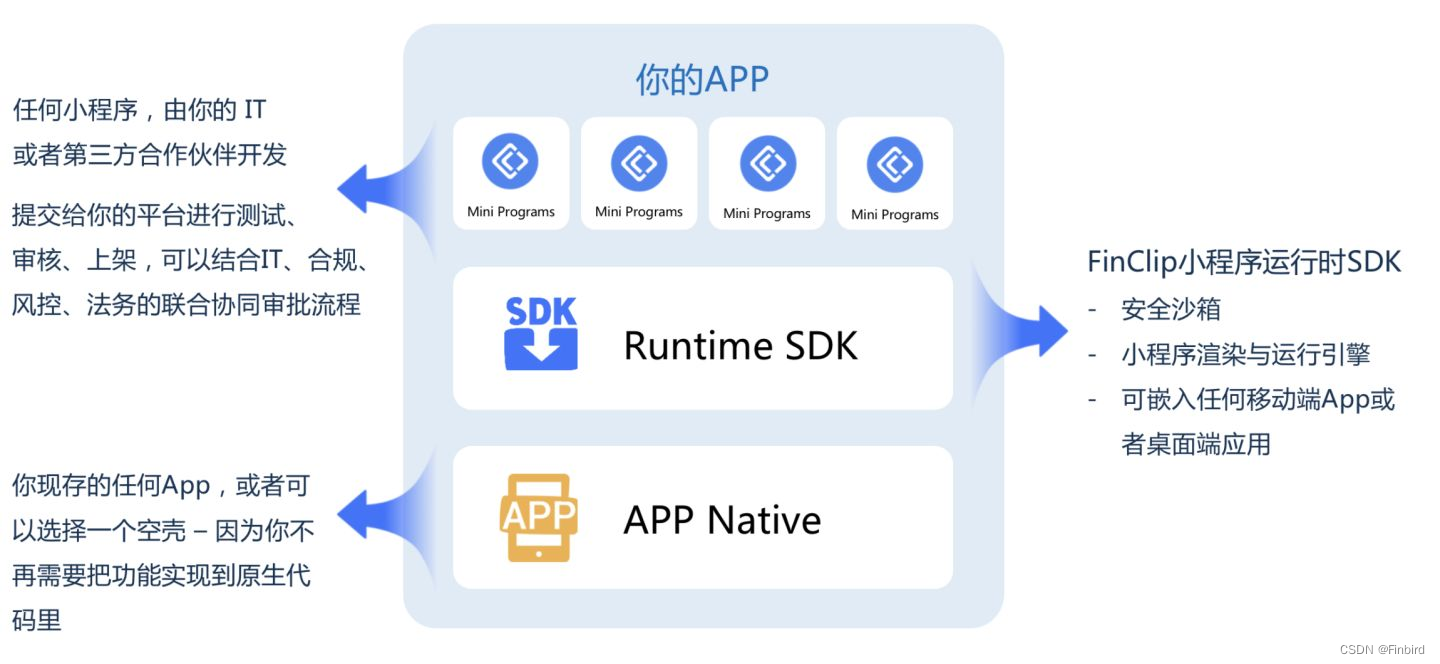
Can the applet run in its own app and realize live broadcast and connection?
[leetcode] 450 and 98 (deletion and verification of binary search tree)
2022夏每日一题(一)
【开发软件】 tilipa开发者软件
Native MySQL
Allow public connections to local Ruby on Rails Development Server
About Confidence Intervals
二进制、八进制、十六进制
Kalman filter-1
OSCP工具之一: dirsearch用法大全
Ubuntu 20 installation des enregistrements redisjson
本机mysql
Implementation of map and set