当前位置:网站首页>Machine learning notes mutual information
Machine learning notes mutual information
2022-07-04 22:04:00 【Sit and watch the clouds rise】
1、 summary
When encountering a new data set, the important first step is to use the characteristic utility index to build the ranking , This indicator is a function of measuring the correlation between characteristics and objectives . then , You can choose a small number of the most useful functions for initial development .
The metrics we use are called “ Mutual information ”. Mutual information is much like relevance , Because it measures the relationship between two quantities . The advantage of mutual information is that it can detect any kind of relationship , Correlation only detects linear relationships .
Mutual information is a good general indicator , Especially useful at the beginning of function development , Because you may not know which model to use .
Mutual information is easy to use and interpret , High calculation efficiency , There is a theoretical basis , Over fitting , And can detect any type of relationship .
2、 Mutual information and its measurement
Mutual information describes the relationship in terms of uncertainty . Mutual information between two quantities (MI) It is a measure of how much knowledge of one quantity reduces the uncertainty of another . If you know the value of a feature , Will you have more confidence in your goals ?
This is a Ames Housing An example of data . The figure shows the relationship between the appearance quality of the house and its selling price . Each dot represents a house .
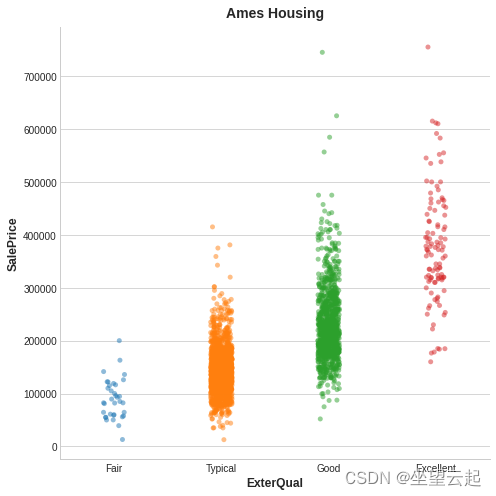
As we can see from the picture , know ExterQual The value of should make you correct the corresponding SalePrice More certain ——ExterQual Each category of tends to SalePrice Concentrate in a certain range . ExterQual And SalePrice The mutual information of is ExterQual Four values of SalePrice Average reduction in uncertainty . for example , because Fair The occurrence frequency of is lower than that of typical , therefore Fair stay MI The weight in the score is small .
What we call uncertainty is the use of information theory called “ entropy ” To measure . The entropy of a variable roughly means :“ How many yes or no questions do you need to describe this happening Variable , On average, .” The more questions you have to ask , The greater your uncertainty about variables . Mutual information is how many questions about goals you expect the feature to answer .
3、 Explain mutual information scores
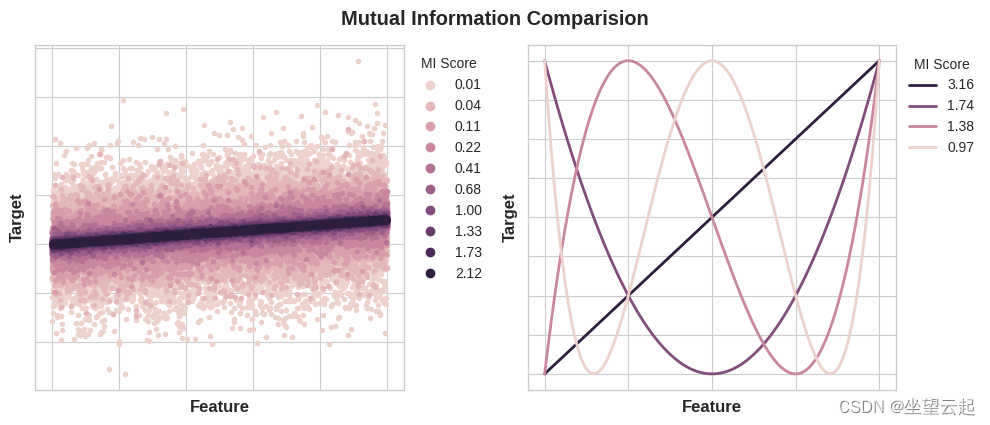
The minimum possible mutual information between quantities is 0.0. When MI Is zero , These quantities are independent : Neither can tell you anything about the other . contrary , Theoretically MI There is no upper limit . In practice , Although higher than 2.0 Values around are not common . ( Mutual information is a pair of numbers , So it increases very slowly .)
The following figure will show you MI How the value corresponds to the type and degree of association between the feature and the target .
Here are some things to remember when applying mutual information :
MI It can help you understand the relative potential of a feature as a target predictor , And consider it alone .
When interacting with other functions , A function may provide very rich information , But the amount of information alone may not be very large . MI Interaction between features cannot be detected . It is a univariate indicator .
The actual use of the function depends on the model you use . A feature is only useful if its relationship to the target is something your model can learn . Just because one feature has high MI Score does not mean that your model will be able to do anything with this information . You may need to transform features first to expose associations .
4、 Example - 1985 Cars in
The car data set consists of 1985 Year of 193 Vehicle composition . The goal of this data set is based on the 23 Features ( For example, brand 、 Body style and horsepower ) To predict the price of cars ( The goal is ). In this case , We will rank features with mutual information , And visualize the research results through data .
Automobile Dataset | KaggleDataset consist of various characteristic of an auto
import matplotlib.pyplot as plt
import numpy as np
import pandas as pd
import seaborn as sns

plt.style.use("seaborn-whitegrid")

df = pd.read_csv("../input/fe-course-data/autos.csv")
df.head()
MI Of scikit-learn The algorithm deals with discrete features differently from continuous features . Based on experience , Any must have float dtype Everything is not discrete . By giving them a tag code , You can classify ( Object or classification dtype) Considered discrete .
X = df.copy()
y = X.pop("price")

# Label encoding for categoricals
for colname in X.select_dtypes("object"):
    X[colname], _ = X[colname].factorize()

# All discrete features should now have integer dtypes (double-check this before using MI!)
discrete_features = X.dtypes == int
Scikit-learn In its feature_selection There are two mutual information measures in the module : One for real value goals (mutual_info_regression), A target for classification (mutual_info_classif). Our goal , Price , Is of real value . The next unit calculates our characteristic MI fraction , And wrap them in a data frame .
from sklearn.feature_selection import mutual_info_regression

def make_mi_scores(X, y, discrete_features):
    mi_scores = mutual_info_regression(X, y, discrete_features=discrete_features)
    mi_scores = pd.Series(mi_scores, name="MI Scores", index=X.columns)
    mi_scores = mi_scores.sort_values(ascending=False)
    return mi_scores

mi_scores = make_mi_scores(X, y, discrete_features)
mi_scores[::3]  # show a few features with their MI scores
curb_weight 1.486440
highway_mpg 0.950989
length 0.607955
bore 0.489772
stroke 0.380041
drive_wheels 0.332973
compression_ratio 0.134799
fuel_type 0.048139
Name: MI Scores, dtype: float64Now it's a bar chart , It can make the comparison easier :
def plot_mi_scores(scores):
    scores = scores.sort_values(ascending=True)
    width = np.arange(len(scores))
    ticks = list(scores.index)
    plt.barh(width, scores)
    plt.yticks(width, ticks)
    plt.title("Mutual Information Scores")


plt.figure(dpi=100, figsize=(8, 5))
plot_mi_scores(mi_scores)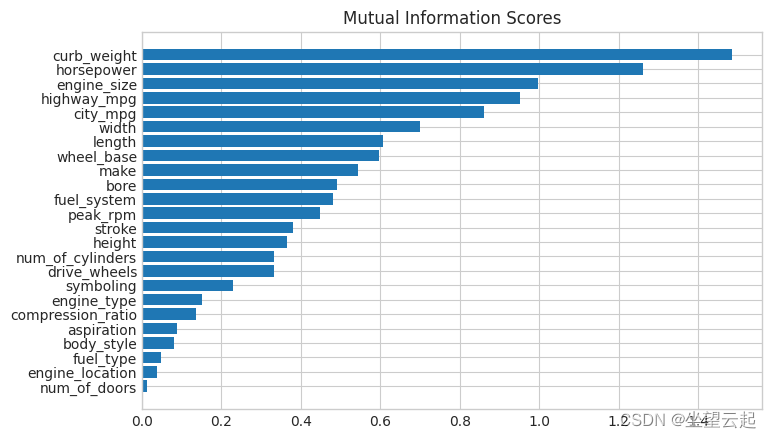
Data visualization is a good follow-up to utility ranking . Let's take a closer look at some of them .
as we had expected , High score curb_weight Characteristics have a strong relationship with the target price .
sns.relplot(x="curb_weight", y="price", data=df);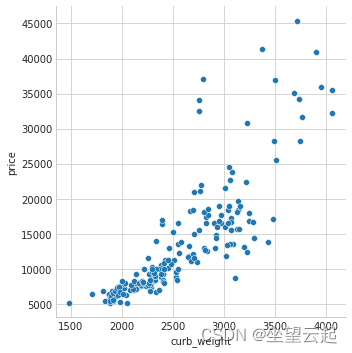
Fuel_type Features have a fairly low MI fraction , But we can see from the picture that , It clearly distinguishes two price groups with different trends in horsepower characteristics . This shows that fuel_type Contributed an interaction , And it may not be unimportant . In from MI Before the score determines that a characteristic is not important , It is best to investigate any possible interaction —— Knowledge in the professional field can provide a lot of guidance here .
sns.lmplot(x="horsepower", y="price", hue="fuel_type", data=df);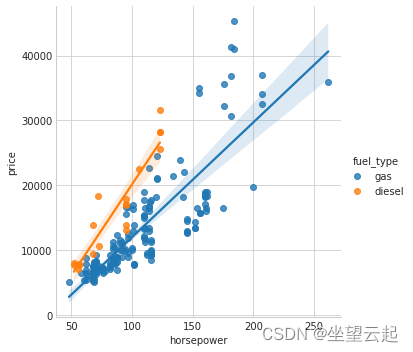
Data visualization is an important supplement to the feature engineering toolbox . In addition to practical indicators such as mutual information , This kind of visualization can help you discover important relationships in the data .
边栏推荐
- 赋能数字经济 福昕软件出席金砖国家可持续发展高层论坛
- 做BI开发,为什么一定要熟悉行业和企业业务?
- The drawing method of side-by-side diagram, multi row and multi column
- 类方法和类变量的使用
- GTEST from ignorance to proficient use (2) what is test fixture
- TCP shakes hands three times and waves four times. Do you really understand?
- Analyzing the maker space contained in steam Education
- 玩转gRPC—深入概念与原理
- Relational database
- [weekly translation go] how to code in go series articles are online!!
猜你喜欢
Why do you have to be familiar with industry and enterprise business when doing Bi development?
el-tree结合el-table,树形添加修改操作
![Compréhension approfondie du symbole [langue C]](/img/4b/26cf10baa29eeff08101dcbbb673a2.png)
Compréhension approfondie du symbole [langue C]

Redis 排查大 key 的3种方法,优化必备
PMO:比较25种分子优化方法的样本效率
QT - plot other problems

Super detailed tutorial, an introduction to istio Architecture Principle and practical application

湘江鲲鹏加入昇腾万里伙伴计划,与华为续写合作新篇章
![[weekly translation go] how to code in go series articles are online!!](/img/bf/77253c87bfa1512f4b8d3d8f7ebe80.png)
[weekly translation go] how to code in go series articles are online!!
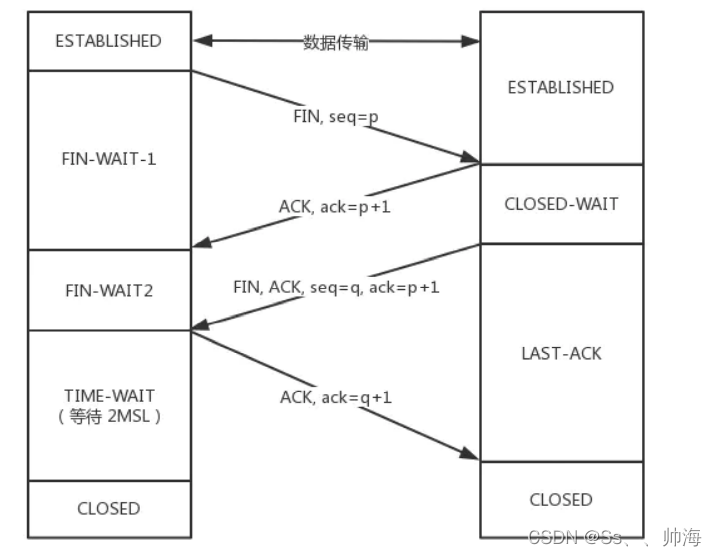
TCP shakes hands three times and waves four times. Do you really understand?
随机推荐
从RepVgg到MobileOne,含mobileone的代码
Hash table
并列图的画法,多排多列
什么是商业智能(BI),就看这篇文章足够了
一文掌握数仓中auto analyze的使用
How much is the minimum stock account opening commission? Is it safe to open an account online
gtest从一无所知到熟练使用(3)什么是test suite和test case
MongoDB聚合操作总结
283. Moving zero-c and language assisted array method
Drop down selection of Ehlib database records
1807. 替换字符串中的括号内容
VS2019 C# release下断点调试
For MySQL= No data equal to null can be found. Solution
MongoDB中的索引操作总结
Lambdaquerywrapper usage
Enlightenment of maker thinking in Higher Education
gtest从一无所知到熟练使用(2)什么是测试夹具/装置(test fixture)
Flutter WebView示例
面试题 01.01. 判定字符是否唯一
Bookmark