当前位置:网站首页>One of the commonly used technical indicators, reading boll Bollinger line indicators
One of the commonly used technical indicators, reading boll Bollinger line indicators
2022-07-04 22:54:00 【Zhuge said talk】
What is Bollinger line index ?

The brin line BOLL indicators (Bollinger Bands) It is one of the commonly used tools for technical analysis of the stock market , By American financial analysts John Bollinger According to the moving average and the principle of standard deviation in Statistics 1980 Designed in the s .
As shown in the figure above , Bollinger line indicators from the top 、 in 、 The next three tracks form , Among them, the upper, middle and lower tracks can be regarded as the pressure line of stock price 、 Average line and support line , The stock price fluctuates within the range of upper limit and lower limit, that is, the stock price channel . The stock price channel will change with the fluctuation range of the stock price . The Bollinger line generally takes 20 Day as a parameter .
Brin line formula description
Middle track = N Daily moving average ,N Usually take 20
Upper rail line = Middle track + X Times the standard deviation ,X Usually take 2
Lower track = Middle track -Y Times the standard deviation , Y Usually take 2
Bollinger line index calculation
talib Brin line index is used in
import talib

upper, middle, lower = talib.BBANDS(close, timeperiod=20, nbdevup=2, nbdevdn=2, matype=0)
Return value :upper Is the upper rail line ,middle It is the middle track ,lower For the next track
talib.BBANDS Function parameter :close For the closing price ,timeperiod Is the calculation period , Usually take 20;nbdevup: The price of the upper track is a multiple of the standard deviation of the middle track , Usually take 2, The larger the value , The higher the upper limit , The wider the channel ;nbdevdn: The lower rail price is a multiple of the standard deviation of the middle rail , Usually take 2;matype: Moving average type ,0 Represents simple moving average
backtrader Brin line index is used in
import backtrader as bt

boll = bt.ind.BollingerBands(period=20, devfactor=2)
BollingerBands share 3 Parameters ,period Is the calculation period , Usually take 20;devfactor Is the multiple of standard deviation , Usually take 2;movav It is the moving average type , The default is simple moving average
Bollinger line index application
The brin line can indicate the position of support and pressure , On 、 The middle track can exert pressure on the operation of stock prices , While in 、 Going down the track will support the operation of the stock market ; Brin line can show overbought 、 Oversold : If the stock price rushes out of the upper track, it is possible to callback , The stock price may rebound after falling off the track
The brin line can indicate the trend , Strong stocks are always in the middle 、 Between upper rail lines , The total operation of vulnerable stocks is below the medium rail line . When the price line is above the middle rail of brin line , It is mostly a long market , Can hold shares or buy ; And when the price line is below the brin line middle track , It is mostly a short market , Be careful when buying , The two poles of brin channel are upper rail and lower rail , It means extremely strong and extremely weak
The narrowing of the upper and lower rails of brin hides a sudden change , Don't rush to buy . When the stock price K The amount of the line breaks through the upper track of the brin line , At the same time, when the originally narrow brin line channel suddenly opens upward , It shows that the stock price is about to enter a new rising channel , Should be based on buying ; Once the stock price K The line breaks through the lower track of brin line , At the same time, when the originally narrow brin line channel suddenly opens downward , It shows that the stock price is about to enter a new downward channel , It should be mainly sold
When the stock price K When the line breaks through the middle rail line of brin line from below the middle rail line of brin line , It indicates that the stock price is relatively strong , Should be based on buying ; When the stock price K When the line breaks through the rail line of brin line from above the middle rail line of brin line , It indicates that the stock price is very strong , Share prices may rise sharply in the short term , It should focus on holding shares to be raised or short-term buying
When the stock price K After the line has moved above the brin line for some time , If K When the line turns down and breaks through the upper rail of brin line , It indicates that the short-term strong market of stock price may end , Short term stocks should be sold in time , Especially those stocks with large short-term gains ; When the stock price K When the line breaks through the middle track of brin line , It should be mainly sold
Conclusion & communication
Pay attention to WeChat public number : Zhuge said talk, Get more . At the same time, you can also get an invitation to join the investment exchange group 、 Quantitative investment seminar group , With many investment lovers 、 Quantitative practitioners 、 Technical leaders communicate with each other 、 Compare notes , Quickly improve your investment level .
It's not easy to write , If you think this article can help you , Do me a favor .
Reference resources
边栏推荐
- [machine learning] handwritten digit recognition
- NFT Insider #64:电商巨头eBay提交NFT相关商标申请,毕马威将在Web3和元宇宙中投入3000万美元
- Li Kou 98: verify binary search tree
- 【烹饪记录】--- 青椒炒千张
- Sword finger offer 67 Convert a string to an integer
- Unity-VScode-Emmylua配置报错解决
- Unity vscode emmylua configuration error resolution
- Gnawing down the big bone - sorting (II)
- Analysis of environmental encryption technology
- In Linux, I call odspcmd to query the database information. How to output silently is to only output values. Don't do this
猜你喜欢

Logo special training camp Section IV importance of font design
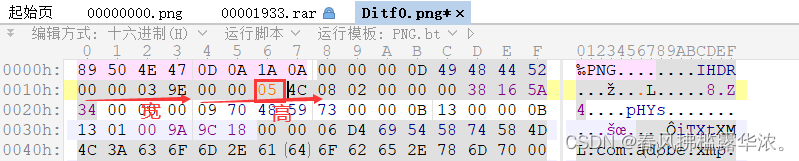
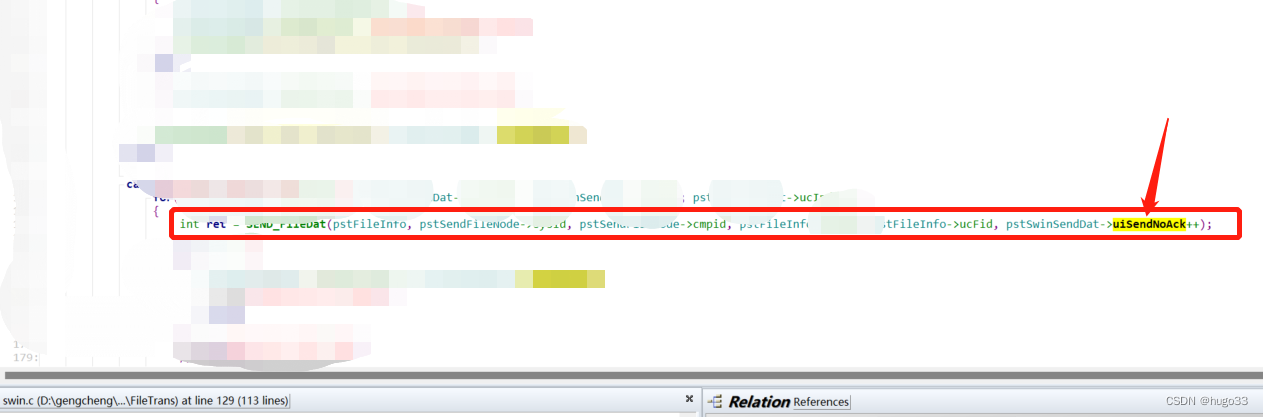
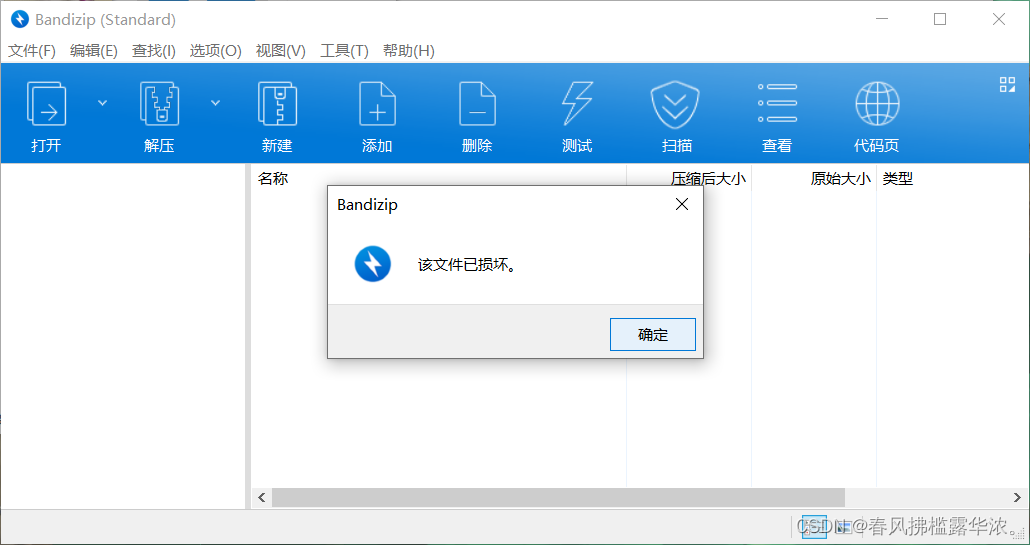
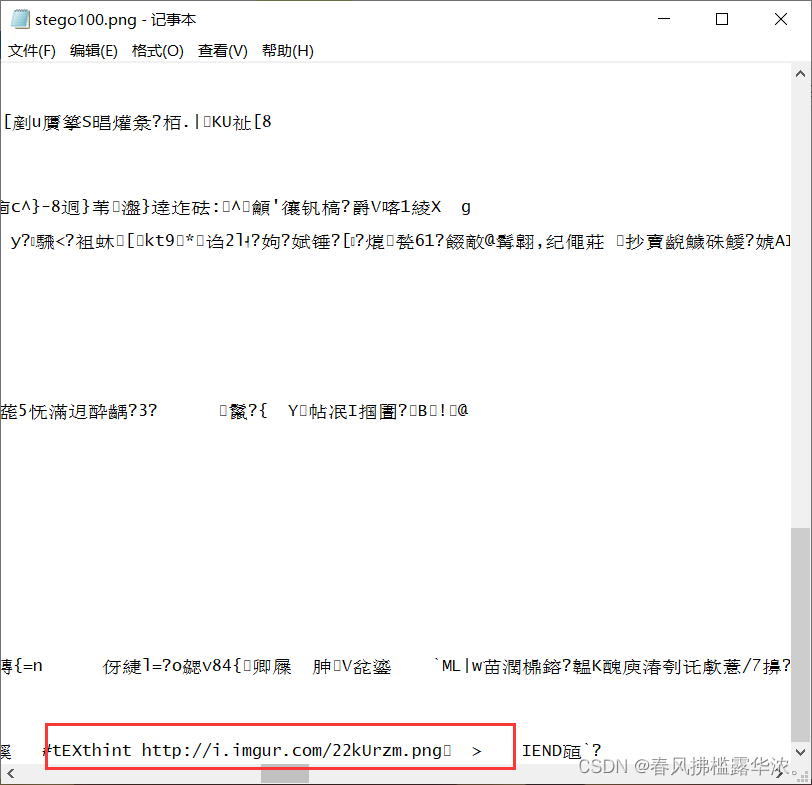
Attack and defense world misc advanced area ditf
Analysis of the self increasing and self decreasing of C language function parameters
攻防世界 MISC 进阶区 3-11
Attack and Defense World MISC Advanced Area Erik baleog and Olaf
SPSS安装激活教程(包含网盘链接)
Set up a website with a sense of ceremony, and post it to 1/2 of the public network through the intranet
[the 2023 autumn recruitment of MIHA tour] open [the only exclusive internal push code of school recruitment eytuc]
How to send a reliable request before closing the page
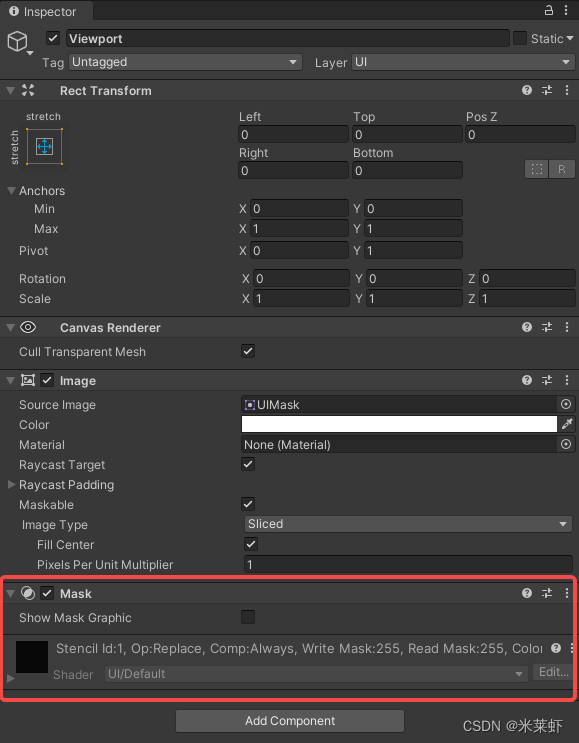
Unity修仙手游 | lua动态滑动功能(3种源码具体实现)
![[the 2023 autumn recruitment of MIHA tour] open [the only exclusive internal push code of school recruitment eytuc]](/img/5b/35d855520741ac50507c2ff00cef97)

随机推荐
Attack and defense world misc advanced area can_ has_ stdio?
堆排序代码详解
Redis入门完整教程:列表讲解
Li Kou 98: verify binary search tree
MySQL Architecture - user rights and management
LOGO特训营 第二节 文字与图形的搭配关系
质量体系建设之路的分分合合
Redis入门完整教程:有序集合详解
繁華落盡、物是人非:個人站長該何去何從
串口数据帧
Redis入门完整教程:发布订阅
Sword finger offer 65 Add without adding, subtracting, multiplying, dividing
Attack and defense world misc advanced area ditf
页面关闭前,如何发送一个可靠请求
The difference between Max and greatest in SQL
剑指 Offer 67. 把字符串转换成整数
华泰证券是国家认可的券商吗?开户安不安全?
[the 2023 autumn recruitment of MIHA tour] open [the only exclusive internal push code of school recruitment eytuc]
繁华落尽、物是人非:个人站长该何去何从
Sobel filter