ANR Introduce
ANR The full name is Application No Responding, That is, the application is not responding , It's something specific Message (Key Dispatch、Broadcast、Service) In application UI Threads ( The main thread ) Didn't finish processing within the specified time , And then trigger ANR abnormal .
ANR Guaranteed by the message processing mechanism ,Android At the system level, a sophisticated mechanism is implemented to discover ANR, The core principle is message scheduling and timeout processing .ANR The mechanism body is implemented in the system layer , All and ANR Related messages , Will go through the system process system_server Dispatch , The concrete is ActivityManagerService service , Then send it to the application process to complete the actual processing of the message , meanwhile , System processes are designed with different timeout limits to track message processing . Once the application processes the message improperly , The timeout limit works , It collects some system state , for example CPU/IO usage 、 Process function call stack CallStack,( There are platforms like MTK, And print the corresponding Message For debugging and analysis ), Finally, report that the user has no response to the process ( ANR Dialog box ).
ANR type
ANR There are generally three types :
KeyDispatchTimeout
This is mainly a key or touch event does not respond to a specific time , commonly Android The default timeout for the platform is 5s Will be submitted to the anr, But some platforms will change this time , such as MTK Some platforms are 8s Timeout for .
This timeout can be in ActivityManagerService.java see :
// M: ANR debug mechanism (Ori: 5*1000)
static final int KEY_DISPATCHING_TIMEOUT = 8*1000;
BroadcastTimeout
This kind of overtime will have ANR The prompt box pops up , The user can choose forceStop Or keep waiting .
This is mainly BroadcastRecevier It can't be processed within the specified time . The front desk broadcast timeout is 10s, Background broadcast timeout is 60s, There is no prompt box for this kind of timeout .
==> AMS.java
// How long we allow a receiver to run before giving up on it.
static final int BROADCAST_FG_TIMEOUT = 10*1000;
static final int BROADCAST_BG_TIMEOUT = 60*1000;
ServiceTimeout 
Service Unable to complete the operation within the specified time , The service timeout will be reported , This kind of ANR Again, there is no prompt box . Timeout time , The front desk Service yes 20s, backstage Service yes 200s.
==> ActivityServices.java
// How long we wait for a service to finish executing.
static final int SERVICE_TIMEOUT = 20*1000;
// How long we wait for a service to finish executing.
static final int SERVICE_BACKGROUND_TIMEOUT = SERVICE_TIMEOUT * 10;
Three ANR Only the 1 The system prompt dialog box will be displayed , Because the user is doing interface interaction , If there is no response for a long time , It will make the user suspect that the device has crashed , Most people will start clicking at this point , Even unplug the battery and restart , The user experience must be very bad .
Three ANR It's going to happen in log Output error message in , You will find that the function stack information of each application process and system process is output to a /data/anr/traces.txt In the file of , This document is an analysis of ANR The reason for the key document , At the same time, you can also see in the log CPU Usage rate , This is also important information , In the following chapters, we will describe in detail how to use them to analyze ANR problem .
These three ANR It's not isolated , It's possible to interact with each other . For example, an application process has a display of Activity And someone who's processing the message BroadcastReceiver, They all run in the main thread of the process . If BR Of onReceive Function did not return , At this point, the user clicks on the screen , and onReceive exceed 5 Seconds still don't return , The main thread cannot handle user input events , It will lead to 1 Kind of ANR. If you continue to exceed 10 Seconds did not return , It will lead to 2 Kind of ANR.
ANR How it happens
about ANR The basic principle of occurrence is as follows :
-
In the relevant operation call hander.sendMessageAtTime() Send a ANR The news of , The delay time is ANR When it happened ( Such as activity It's the current time 5s after ).
-
Carry out relevant operations
-
After the end of the operation remove Drop that one message. If the relevant operation is not completed within the specified time , This article message Will be handler Remove and execute , It happened ANR.
Android Messages are processed through Handler To complete , Yes Handler Students who don't know can refer to the article Android Handler Source code analysis ( detailed ).
ANR Analysis examples
ANR It's essentially a Performance problem , happen ANR When , If the problem may be APK On myself , So the main direction of investigation is apk In itself , Analyze to see if it's in UI Threads do time-consuming operations ?
Personally think that , Somewhat ANR The problem is hard to analyze , such as app When running, due to some influence of the current system's underlying , Leading to the current message Processing failed . Such problems are often irregular , And it's hard to reproduce . For this kind of ANR problem , It usually takes a lot of time to understand some other behavior of the system , And beyond ANR Its own category , This kind of problem is a warning sign , Tell you what's wrong with the system .
see log Log files
Search for keywords ANR :
04-17 17:15:23.817 E/ActivityManager( 187): ANR in com.da.android (com.da.android/com.text.my.app.ui.activities.ContentActivity)
The meaning of the above passage is 4 month 17 Japan ,17 spot 15 branch 23 second 817ms It's time ANR . In fact, they usually bring ANR Why , as well as CPU The use of information ,
Here we write a demo, For example, in the broadcast receiver onReceive Method ( Broadcast receiver's onReceive Method is executed in the main thread by default ) Sleep inside for a while , If the main thread has no operation at this time , Then the broadcast receiver can complete the normal execution . Not cause ANR . If I send the broadcast and then hit the back button multiple times , This is because the main thread is sleeping , Unable to respond , Will appear ANR.
Its corresponding integrity log The information is as follows :
ANR in com.brotherd.broadcastdemo (com.brotherd.broadcastdemo/.MainActivity)
    PID: 6317
    Reason: Input dispatching timed out (Waiting to send key event because the focused window has not finished processing all of the input events that were previously delivered to it.  Outbound queue length: 0.  Wait queue length: 2.)
    //
   Load: 38.14 / 37.82 / 37.45
  // ANR  Before it happened  cpu  The use of information
    CPU usage from 45678ms to 0ms ago (2020-10-27 08:39:06.256 to 2020-10-27 08:39:51.933):
      15% 1265/system_server: 12% user + 3.5% kernel / faults: 6531 minor 16 major
      13% 23112/com.android.systemui: 9.7% user + 3.5% kernel / faults: 6033 minor 103 major // minor major  Indicates a page error
      4.7% 578/surfaceflinger: 2.6% user + 2% kernel / faults: 469 minor 2 major
      4.4% 673/hwpged: 0% user + 4.3% kernel / faults: 29 minor
      2.3% 549/[email protected]: 1.1% user + 1.1% kernel / faults: 149 minor
      0.1% 2246/com.huawei.android.pushagent: 0% user + 0% kernel / faults: 2583 minor 22 major
      1.5% 461/logd: 0.8% user + 0.6% kernel / faults: 52 minor
      1.5% 2077/com.huawei.powergenie: 0.7% user + 0.8% kernel / faults: 843 minor 2 major
      0.5% 17384/com.android.settings: 0.4% user + 0.1% kernel / faults: 5419 minor 73 major
      1.3% 259/mmc-cmdqd/0: 0% user + 1.3% kernel
      1% 3888/kworker/u16:0: 0% user + 1% kernel / faults: 1 minor
      0.9% 18949/android.process.media: 0.5% user + 0.3% kernel / faults: 1408 minor 8 major
      0.8% 148/kswapd0: 0% user + 0.8% kernel
      0.5% 657/dubaid: 0.3% user + 0.2% kernel / faults: 139 minor
      0.5% 2105/com.huawei.android.launcher: 0.4% user + 0.1% kernel / faults: 159 minor 1 major
      0.5% 2366/com.huawei.systemmanager:service: 0.3% user + 0.1% kernel / faults: 374 minor
      0.5% 922/hisi_frw/0: 0% user + 0.5% kernel
      0.4% 3951/kworker/u16:8: 0% user + 0.4% kernel
      0.4% 27040/com.huawei.appmarket: 0.3% user + 0.1% kernel / faults: 350 minor 2 major
      0.4% 238/kworker/0:1H: 0% user + 0.4% kernel
      0.4% 2028/com.huawei.hiview: 0.1% user + 0.2% kernel / faults: 88 minor
      0.3% 577/lmkd: 0% user + 0.3% kernel
      0.3% 677/[email protected]: 0% user + 0.3% kernel / faults: 19 minor
      0.3% 3715/kworker/u16:1: 0% user + 0.3% kernel
      0.3% 29718/com.huawei.hidisk: 0.2% user + 0.1% kernel / faults: 404 minor 1 major
      0.1% 527/zygote64: 0% user + 0.1% kernel / faults: 541 minor
      0.3% 3954/kworker/u16:10: 0% user + 0.3% kernel
      0.3% 581/powerlogd: 0.2% user + 0.1% kernel / faults: 25 minor
      0.3% 3952/kworker/u16:9: 0% user + 0.3% kernel
      0% 23351/com.huawei.hwid: 0% user + 0% kernel / faults: 854 minor 10 major
      0.1% 3945/kworker/u16:6: 0% user + 0.1% kernel
      0.2% 24447/kworker/u17:0: 0% user + 0.2% kernel
      0.2% 548/[email protected]: 0% user + 0.2% kernel / faults: 47 minor
      0.2% 2042/com.huawei.systemserver: 0.1% user + 0.1% kernel / faults: 95 minor
      0.2% 426/oeminfo_nvm_server: 0% user + 0.1% kernel / faults: 79 minor 205 major
      0.2% 4187/kworker/u17:1: 0% user + 0.2% kernel
      0.2% 462/servicemanager: 0% user + 0.1% kernel / faults: 20 minor
      0.2% 3633/kworker/u16:2: 0% user + 0.2% kernel
      0.2% 5290/com.huawei.health:DaemonService: 0.1% user + 0% kernel / faults: 77 minor
      0.1% 7/rcu_preempt: 0% user + 0.1% kernel
      0.1% 93/sys_heap: 0% user + 0.1% kernel
      0.1% 949/hisi_hcc: 0% user + 0.1% kernel
      0.1% 637/hisecd: 0% user + 0.1% kernel / faults: 66 minor
      0.1% 2097/com.android.phone: 0% user + 0.1% kernel / faults: 97 minor
      0.1% 3441/kworker/u16:5: 0% user + 0.1% kernel
      0.1% 526/netd: 0% user + 0.1% kernel / faults: 142 minor 2 major
      0.1% 2063/com.huawei.HwOPServer: 0% user + 0% kernel / faults: 168 minor
      0.1% 1//init: 0% user + 0% kernel / faults: 263 minor 5 major
      0% 465/[email protected]: 0% user + 0% kernel / faults: 113 minor 5 major
      0.1% 3944/kworker/u16:4: 0% user + 0.1% kernel
      0.1% 655/displayengineserver: 0% user + 0% kernel / faults: 21 minor
      0.1% 918/oal_gpio_rx_dat: 0% user + 0.1% kernel
      0.1% 3955/com.eg.android.AlipayGphone:push: 0% user + 0% kernel / faults: 132 minor
      0.1% 26941/com.huawe
// anr  After occurrence  cpu  usage
  2020-10-27 08:39:53.753 1265-1285/? E/ActivityManager: CPU usage from 51ms to 493ms later (2020-10-27 08:39:51.984 to 2020-10-27 08:39:52.426) with 99% awake:
      48% 1265/system_server: 10% user + 37% kernel
      45% 1285/ActivityManager: 8% user + 37% kernel
      4.9% 578/surfaceflinger: 4.9% user + 0% kernel / faults: 5 minor
      2.4% 578/surfaceflinger: 2.4% user + 0% kernel
      3.1% 3952/kworker/u16:9: 0% user + 3.1% kernel
      3.7% 23112/com.android.systemui: 3.7% user + 0% kernel
      9.7% TOTAL: 5.2% user + 4.4% kernel  //  It can be downloaded from  total  You see the whole thing inside  cpu  The situation of
First look at the first few lines :
ANR in com.brotherd.broadcastdemo (com.brotherd.broadcastdemo/.MainActivity)
PID: 6317
Reason: Input dispatching timed out (Waiting to send key event because the focused window has not finished processing all of the input events that were previously delivered to it.  Outbound queue length: 0.  Wait queue length: 2.)
These lines show ANR Where it happened activity, process ID, as well as ANR reason (input Event distribution timed out );
ANRManager Will print out the anr Front and rear cpu usage , This can reflect the systematic Performance state :
-
If CPU The usage is close to 100%, It means that the equipment is busy at present , It could be CPU Hunger leads to ANR.
-
If CPU The amount of usage is very small , Indicates that the main thread is BLOCK 了
-
If IOwait Very high , explain ANR It is possible that the main thread is in progress I/O Caused by operation
So at this point , We're going to see anr When it happened , What is the main thread doing .
Trace file (data/anr/traces.txt)
log The document just tells you ANR Time of occurrence , But not in detail , At this point, you have to check trace file (App The process of ANR when , The system makes active Top It's all going through a little bit dump, All kinds of things in the process Thread It's all dump To this trace In the file , therefore trace The file contains the runtime state of each thread ).
The stack information for the current example is as follows :
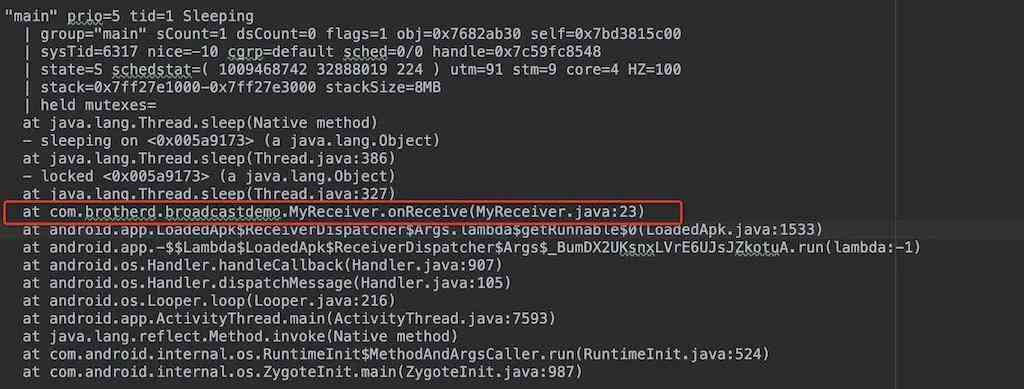
In the information above , There is such a line
at com.brotherd.broadcastdemo.MyReceiver.onReceive(MyReceiver.java:23)
That's what makes ANR Root cause of . stay MyReceiver Class onReceive Method is called Thread Of sleep Method causes the main thread to block , cause ANR.
Then we look at some of the fields .
"main" prio=5 tid=1 Sleeping
  | group="main" sCount=1 dsCount=0 flags=1 obj=0x7682ab30 self=0x7bd3815c00
  | sysTid=6317 nice=-10 cgrp=default sched=0/0 handle=0x7c59fc8548
  | state=S schedstat=( 1009468742 32888019 224 ) utm=91 stm=9 core=4 HZ=100
  | stack=0x7ff27e1000-0x7ff27e3000 stackSize=8MB
  | held mutexes=
The meaning of these fields is as follows: thread name :
Thread information itself
-
Thread priority :prio=5
-
Threads ID: tid=1
-
Thread state :Sleeping
-
Thread group name :group="main"
-
The number of times a thread has been suspended :sCount=1
-
The number of times a thread was suspended by the debugger :dsCount=0
-
Thread java Object address of :obj= 0x7682ab30
-
Thread itself Native Object address :self=0x7bd3815c00 Thread scheduling information :
-
Linux Kernel threads in the system ID: sysTid=6317 Same as the process number of the main thread
-
Thread scheduling priority :nice=-10
-
Thread scheduling group :cgrp=default
-
Thread scheduling strategy and priority :sched=0/0
-
Thread processing function address :handle= 0x7c59fc8548
Thread context information :
-
Thread scheduling state :state=S
-
The thread is in CPU Execution time in 、 Thread wait time 、 The time slice length of thread execution :schedstat=(1009468742 32888019 224)
-
Thread scheduling time in user mode :utm=91
-
Thread scheduling time in kernel mode :stm=9
-
Finally, execute the thread's CPU Check number :core=4
Thread stack information :
- Stack address and size :stack=0x7ff27e1000-0x7ff27e3000 stackSize=8MB
Thread state
Besides , The state of the thread is important , To understand the meaning of these States is to analyze ANR The reason is helpful , Summarized below :
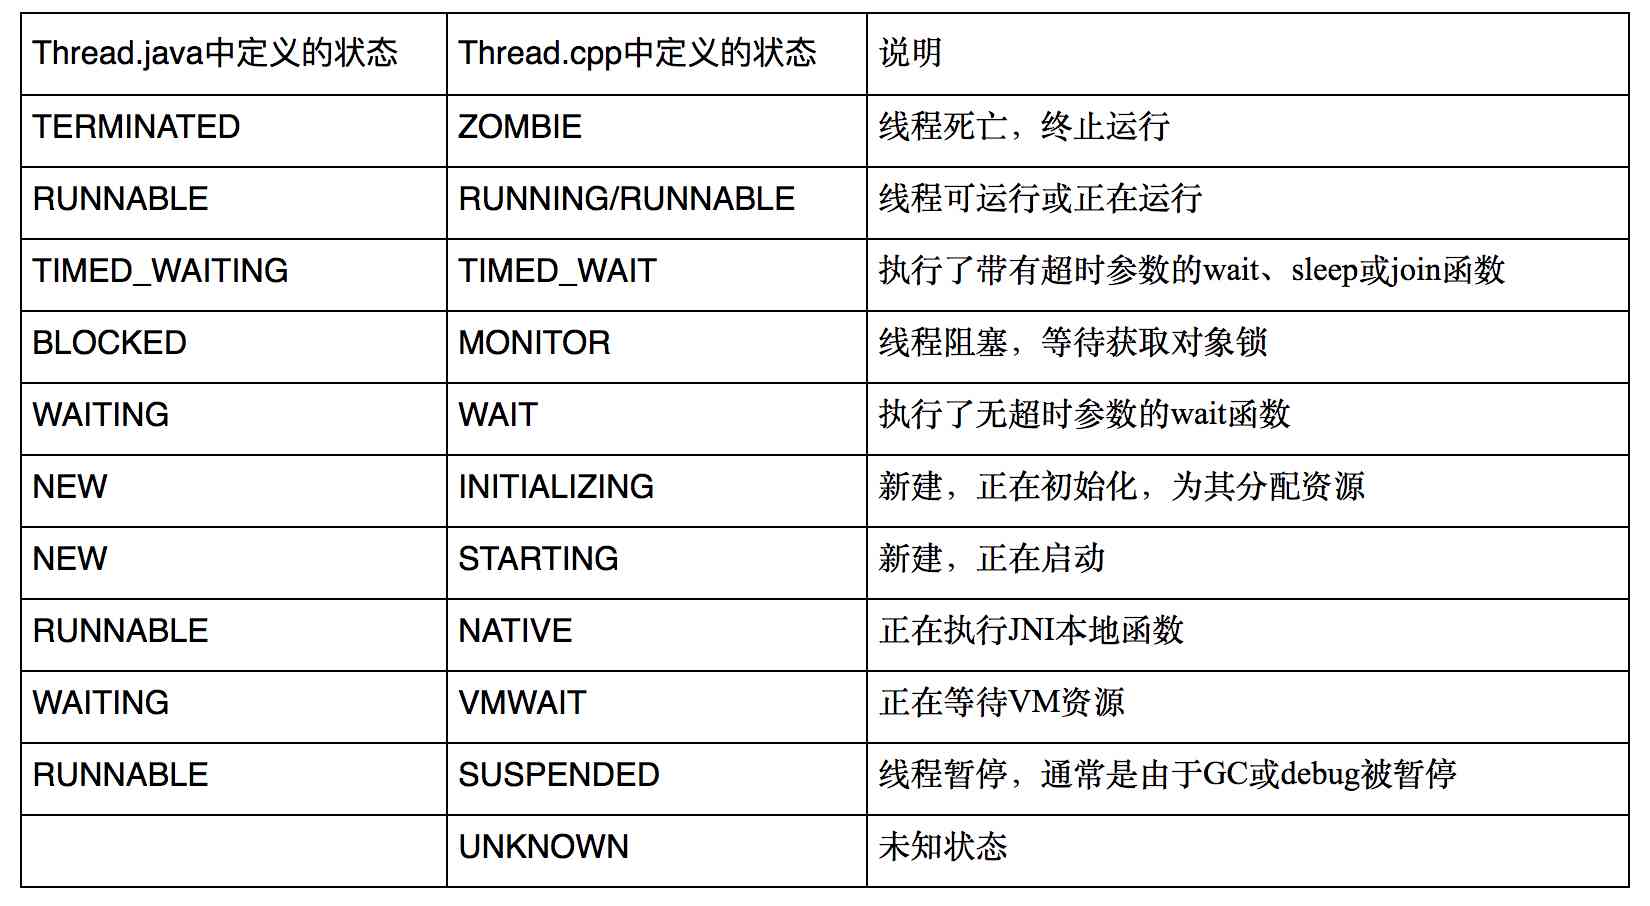
Thread.java The state of and Thread.cpp There is a corresponding relationship between the states in . You can see that the former is more general , It's easier to understand , oriented Java Users of ; The latter is more detailed , Facing the environment inside the virtual machine .traces.txt The thread status shown in is Thread.cpp As defined in . in addition , All threads follow POSIX Standard local threads .
Thread state example :
-
The main thread is running perhaps native: And the corresponding stack corresponds to App The function in , It is likely that a timeout occurred while executing the function .
-
The main thread is block: Very obvious threads are locked , At this time, you can see which thread is locked , Consider optimizing your code . If it's a deadlock problem , We need to solve it in time .
Deadlock demo
Let's take an example of a deadlock :
"PowerManagerService" prio=5 tid=24 MONITOR
| group="main" sCount=1 dsCount=0 obj=0x41dd0eb0 self=0x5241b218
| sysTid=567 nice=0 sched=0/0 cgrp=apps handle=1380038664
| state=S schedstat=( 6682116007 11324451214 33313 ) utm=450 stm=219 core=1
at com.android.server.am.ActivityManagerService.broadcastIntent(ActivityManagerService.java:~13045)
- waiting to lock <0x41a874a0> (a com.android.server.am.ActivityManagerService) held by tid=12 (android.server.ServerThread)
at android.app.ContextImpl.sendBroadcast(ContextImpl.java:1144)
at com.android.server.power.PowerManagerService$DisplayBlankerImpl.unblankAllDisplays(PowerManagerService.java:3442)
at com.android.server.power.DisplayPowerState$PhotonicModulator$1.run(DisplayPowerState.java:456)
at android.os.Handler.handleCallback(Handler.java:800)
at android.os.Handler.dispatchMessage(Handler.java:100)
at android.os.Looper.loop(Looper.java:194)
at android.os.HandlerThread.run(HandlerThread.java:60)
tid=24 The thread is waiting for a <0x41a874a0> Lock of , And this lock is tid=12 Thread occupied by , Let's see tid=12:
"android.server.ServerThread" prio=5 tid=12 MONITOR
| group="main" sCount=1 dsCount=0 obj=0x41a76178 self=0x507837a8
| sysTid=545 nice=-2 sched=0/0 cgrp=apps handle=1349936616
| state=S schedstat=( 15368096286 21707846934 69485 ) utm=1226 stm=310 core=0
at com.android.server.power.PowerManagerService.isScreenOnInternal(PowerManagerService.java:~2529)
- waiting to lock <0x41a7e2e8> (a java.lang.Object) held by tid=85 (Binder_B)
at com.android.server.power.PowerManagerService.isScreenOn(PowerManagerService.java:2522)
at com.android.server.wm.WindowManagerService.sendScreenStatusToClientsLocked(WindowManagerService.java:7749)
at com.android.server.wm.WindowManagerService.setEventDispatching(WindowManagerService.java:7628)
at com.android.server.am.ActivityManagerService.updateEventDispatchingLocked(ActivityManagerService.java:8083)
at com.android.server.am.ActivityManagerService.wakingUp(ActivityManagerService.java:8077)
tid=12 The thread is waiting <0x41a7e2e8> Lock of , And this lock is tid=85 Thread occupied by , Let's see tid=85:
"Binder_B" prio=5 tid=85 MONITOR
| group="main" sCount=1 dsCount=0 obj=0x42744770 self=0x58329e88
| sysTid=3700 nice=-20 sched=0/0 cgrp=apps handle=1471424616
| state=S schedstat=( 1663727513 2044643318 6806 ) utm=132 stm=34 core=1
at com.android.server.power.PowerManagerService$DisplayBlankerImpl.toString(PowerManagerService.java:~3449)
- waiting to lock <0x41a7e420> (a com.android.server.power.PowerManagerService$DisplayBlankerImpl) held by tid=24 (PowerManagerService)
It is worth noting that ,trace It usually contains time , Try to analyze and anr Similar in time trace, Avoid other distractions .tid=85 The thread is waiting <0x41a7e420> The lock is released , And this lock is tid=24 Occupied , So we sent a deadlock . In this case, we need to find the deadlock source code, Analyze and modify .
Other analytical ideas
Sometimes we log Also analyzed ,traces Also analyzed , It's still hard to analyze ANR Why , Then we may need to try to analyze it from other aspects :
-
from main log Inside looking for anr Before it happened 8s, have a look app Of main thread What's going on ? Is there anything unusual , commonly process Of pid Will be equal to the main thread id.
-
A wide search log, See if anr Before it happened , Where did it happen crash? Is it possible to cause anr.
-
Depending on the situation, grab some auxiliary information of the platform , Including but not limited to :
-
memory info
-
process status
-
cpu info
-
Binder info
-
ftrace
-
Reduce occurrence ANR probability
-
All time consuming operations , Like access to the network ,Socket signal communication , Large number of queries SQL sentence , Complex logic calculation is put in the sub thread , however After passage handler.sendMessage、runonUIThread、AsyncTask Etc UI. Make sure the user interface works smoothly anyway degree . If a time-consuming operation requires users to wait , Then you can display the bar on the interface .
-
Use AsyncTask It takes time to process IO operation . In some synchronous operations, the main thread may be locked , You need to wait for other threads to release the corresponding lock before continuing execution , There will be a certain amount of ANR risk , In this case, you can also use asynchronous threads to execute the corresponding logic . in addition , To avoid deadlock .
-
Use Thread perhaps HandlerThread when , call Process.setThreadPriority(Process.THREADPRIORITYBACKGROUND) set priority , Otherwise, it will still reduce the program response , Because the default Thread Has the same priority as the main thread .
-
Use Handler Processing worker thread results , Instead of using Thread.wait() perhaps Thread.sleep() To block the main thread .
-
Activity Of onCreate and onResume Try to avoid time-consuming code in callbacks
- View Of onOnTouchevent and onclick Also avoid time-consuming code in
-
BroadcastReceiver in onReceive Code should also be as time-consuming as possible , It is recommended to use IntentService Handle .
-
The life cycle function of each component should not have too time-consuming operation , Even for the backstage Service perhaps ContentProvider Speaking of , When an application is running in the background, it onCreate() There is no user input that causes the event to be unresponsive ANR, But its execution time is too long to cause Service Of ANR and ContentProvider Of ANR
Reference article

![[200 interview experience], programmer interview, common interview questions analysis](/img/fb/625e17f83f6be064f7387e78ec082a.jpg)