当前位置:网站首页>Seriation in R: How to Optimally Order Objects in a Data Matrice
Seriation in R: How to Optimally Order Objects in a Data Matrice
2022-07-02 11:50:00 【Xiaoyu 2022】
library(seriation)
# Load the data
data("iris")
df <- iris
head(df, 2)
# Remove the column `species` (column 5)
df <- df[, -5]
# Reorder the objects randomly
set.seed(123)
df <- df[sample(seq_len(nrow(df))),]
head(df, 2)
# Compute dissimilarity matrix
dist_result <- dist(df)
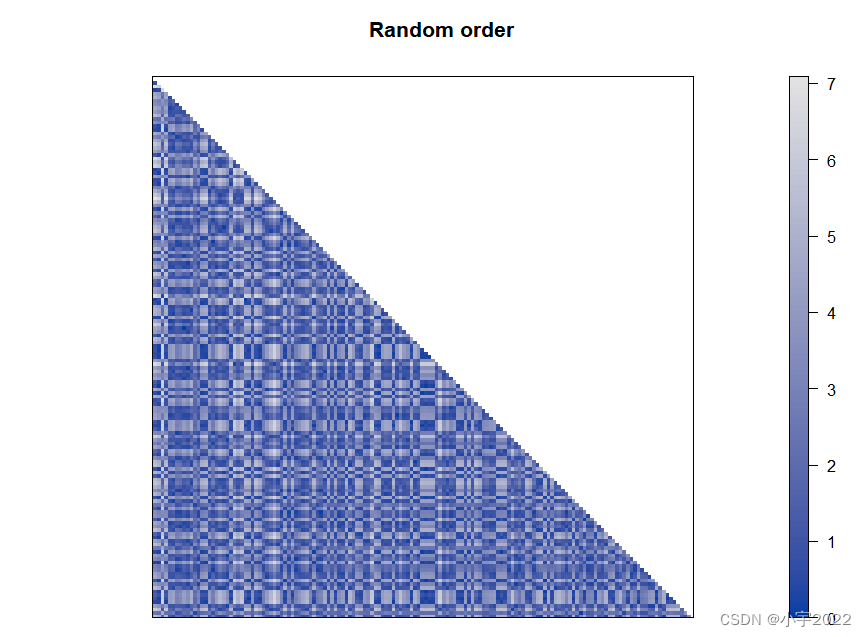
# Seriate objects, reorder rows based on their similarity
object_order <- seriate(dist_result)
# Extract object orders
head(get_order(object_order), 15)
pimage(dist_result, main = "Random order")
library(seriation)
# Load the data
data("iris")
df <- iris
head(df, 2)
# Remove the column `species` (column 5)
df <- df[, -5]
# Reorder the objects randomly
set.seed(123)
df <- df[sample(seq_len(nrow(df))),]
head(df, 2)
# Compute dissimilarity matrix
dist_result <- dist(df)
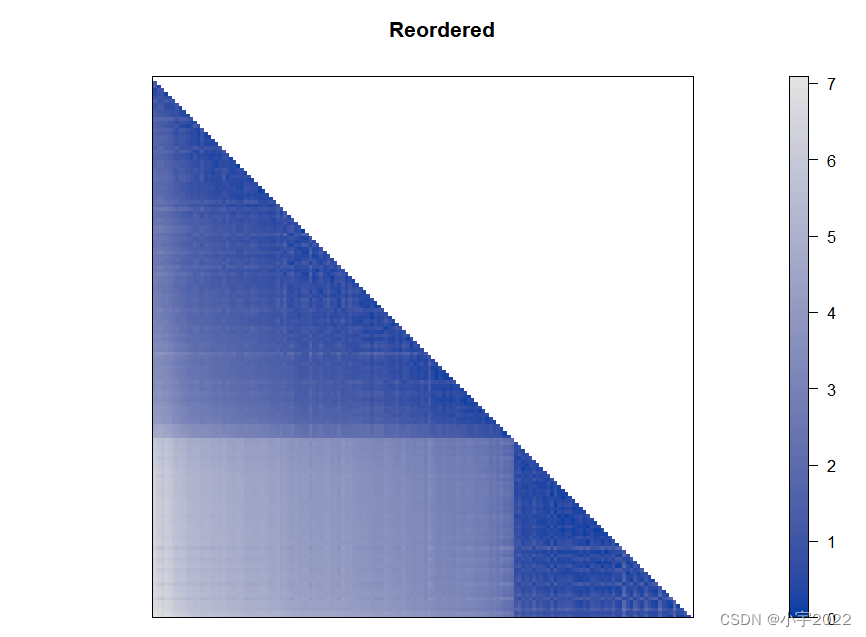
# Seriate objects, reorder rows based on their similarity
object_order <- seriate(dist_result)
# Extract object orders
head(get_order(object_order), 15)
pimage(dist_result, order = object_order, main = "Reordered")
library(seriation)
# Data preparation
# Load the dataset
data("USArrests")
# Replace original values by their ranks
df <- head(apply(USArrests, 2, rank), 30)
# Perform seriation on row and columns
row_order <- seriate(dist(df, "minkowski", p = 1), method ="TSP")
col_order <- seriate(dist(t(df), "minkowski", p = 1), method ="TSP")
orders <- c(row_order, col_order)
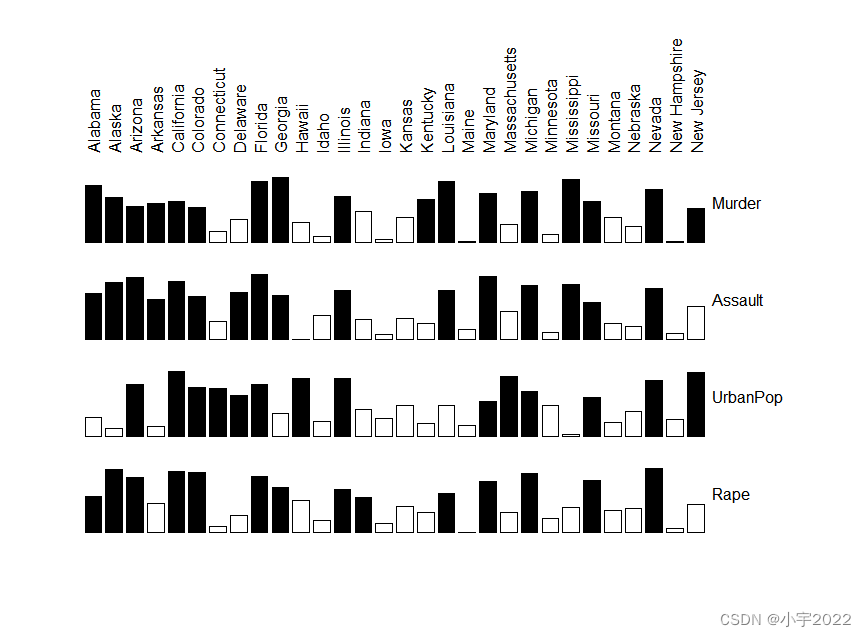
# Visualization: matrix of bars
# Original matrix
bertinplot(df)
library(seriation)
# Data preparation
# Load the dataset
data("USArrests")
# Replace original values by their ranks
df <- head(apply(USArrests, 2, rank), 30)

# Perform seriation on row and columns
row_order <- seriate(dist(df, "minkowski", p = 1),  method ="TSP")
col_order <- seriate(dist(t(df), "minkowski", p = 1),  method ="TSP")
orders <- c(row_order, col_order)

# Visualization: matrix of bars
# Original matrix
bertinplot(df, orders)

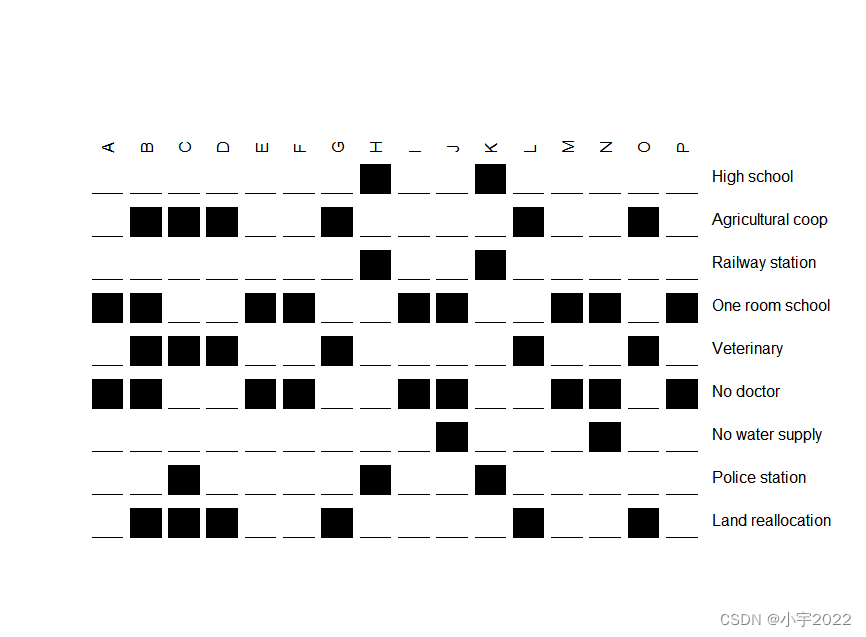
library(seriation)
# Load demo data
data("Townships")
# Visualize the original data
bertinplot(
  Townships,
  options = list(panel = panel.circles)
)
library(seriation)
# Load demo data
data("Townships")
# Seriate rows and columns using the bond energy algorithm (BEA)
set.seed(1234)
orders <- seriate(Townships, method = "BEA", control = list(rep = 10))
bertinplot(
  Townships, order = orders,
  options = list(panel = panel.circles)
)

边栏推荐
- MySQL comparison operator in problem solving
- TDSQL|就业难?腾讯云数据库微认证来帮你
- 数字化转型挂帅复产复工,线上线下全融合重建商业逻辑
- How to Create a Nice Box and Whisker Plot in R
- 制造业数字化转型和精益生产什么关系
- pgsql 字符串转数组关联其他表,匹配 拼接后原顺序展示
- YYGH-9-预约下单
- Thesis translation: 2022_ PACDNN: A phase-aware composite deep neural network for speech enhancement
- HOW TO EASILY CREATE BARPLOTS WITH ERROR BARS IN R
- Basic usage of MySQL in centos8
猜你喜欢

数据分析 - matplotlib示例代码
GGHIGHLIGHT: EASY WAY TO HIGHLIGHT A GGPLOT IN R

FLESH-DECT(MedIA 2021)——一个material decomposition的观点
PYQT5+openCV项目实战:微循环仪图片、视频记录和人工对比软件(附源码)

GGPUBR: HOW TO ADD ADJUSTED P-VALUES TO A MULTI-PANEL GGPLOT
Map set assignment to database
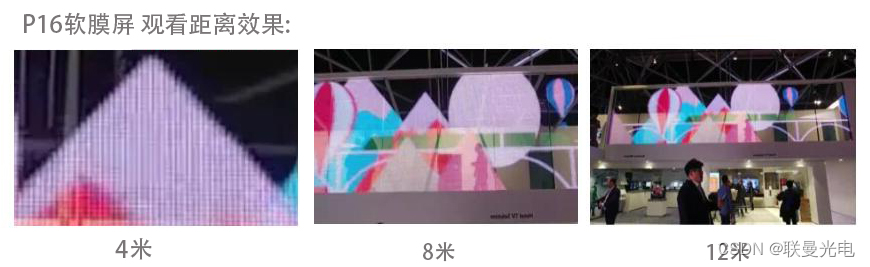
6. Introduce you to LED soft film screen. LED soft film screen size | price | installation | application
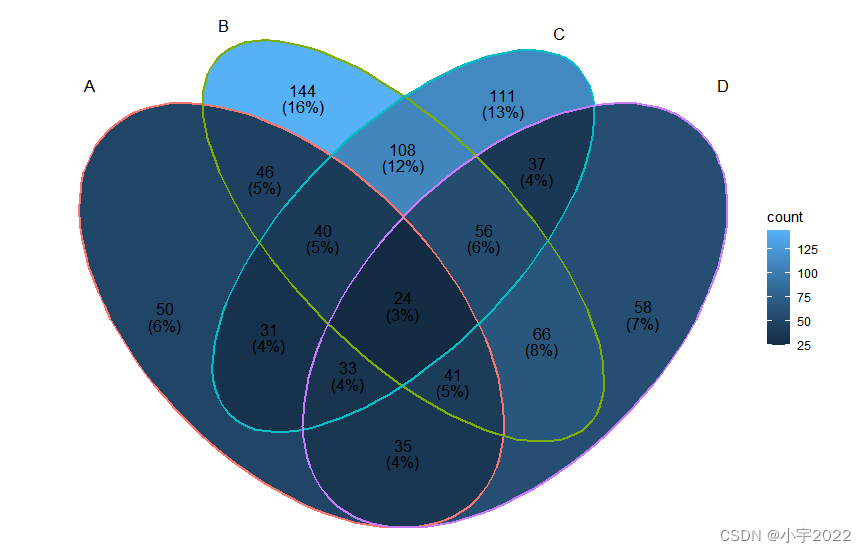
BEAUTIFUL GGPLOT VENN DIAGRAM WITH R
6方面带你认识LED软膜屏 LED软膜屏尺寸|价格|安装|应用
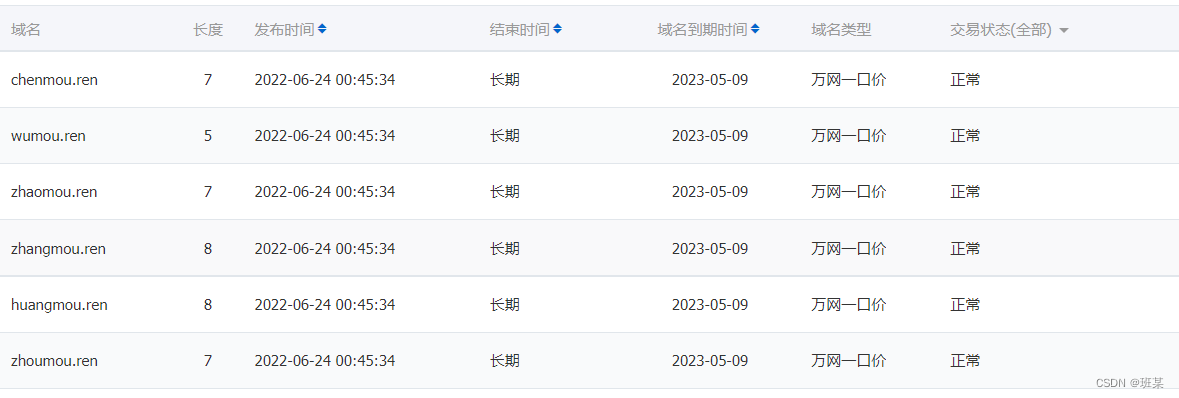
Is the Ren domain name valuable? Is it worth investing? What is the application scope of Ren domain name?
随机推荐
Flesh-dect (media 2021) -- a viewpoint of material decomposition
to_ Bytes and from_ Bytes simple example
Homer forecast motif
to_bytes与from_bytes简单示例
Is it safe to open a stock account through the QR code of the securities manager? Or is it safe to open an account in a securities company?
Three transparent LED displays that were "crowded" in 2022
GGPUBR: HOW TO ADD ADJUSTED P-VALUES TO A MULTI-PANEL GGPLOT
Wechat applet uses Baidu API to achieve plant recognition
Develop scalable contracts based on hardhat and openzeppelin (II)
MySQL linked list data storage query sorting problem
How to Create a Nice Box and Whisker Plot in R
行业的分析
通讯录的实现(文件版本)
GGHIGHLIGHT: EASY WAY TO HIGHLIGHT A GGPLOT IN R
揭露数据不一致的利器 —— 实时核对系统
What is the relationship between digital transformation of manufacturing industry and lean production
GGPLOT: HOW TO DISPLAY THE LAST VALUE OF EACH LINE AS LABEL
Visualization of chip SEQ data by deeptools
MySql存储过程游标遍历结果集
Dynamic memory (advanced 4)