当前位置:网站首页>About Confidence Intervals
About Confidence Intervals
2022-07-06 20:18:00 【梦想家DBA】
Much of machine learning involves estimating the performance of a machine learning algorithm on unseen data.
Confidence intervals are a way of quantifying the uncertainty of an estimate.
- That a confidence interval is a bounds on an estimate of a population parameter.
- That the confidence interval for the estimated skill of a classification method can be calculated directly.
- That the confidence interval for any arbitrary population statistic can be estimated in a distribution-free way using the bootstrap.
1.1 Tutorial Overview
1. What is a Confidence Interval?
2. Interval for classfication Accuracy
3.Nonparametric Confidence Interval
1.2 What is a Confidence Interval?
A confidence interval is a bounds on the estimate of a population variable. It is an interval statistic used to quantify the uncertainty on an estimate.
A confidence interval is used to contain an unknown characteristic of the population or process. The quantity of interest might be a population property or “parameter”, such as the mean or standard deviation of the population or process.
A confidence interval is different from a tolerance interval that describes the bounds of data sampled from the distribution. It is also different from a prediction interval that describes the bounds on a single observation. Instead, the confidence interval provides bounds on a population parameter, such as a mean, standard deviation, or similar. In applied machine learning, we may wish to use confidence intervals in the presentation of the skill of a predictive model.
The value of a confidence interval is its ability to quantify the uncertainty of the estimate. It provides both a lower and upper bound and a likelihood. Taken as a radius measure alone, the confidence interval is often referred to as the margin of error and may be used to graphically depict the uncertainty of an estimate on graphs through the use of error bars. Often, the larger the sample from which the estimate was drawn, the more precise the estimate and the smaller (better) the confidence interval.
- Smaller Confidence Interval: A more precise estimate.
- Larger Confidence Interval: A less precise estimate.
1.3 Interval for Classification Accuracy
Classification problems are those where a label or class outcome variable is predicted given some input data. It is common to use classification accuracy or classification error (the inverse of accuracy) to describe the skill of a classification predictive model. For example, a model that makes correct predictions of the class outcome variable 75% of the time has a classification accuracy of 75%, calculated as:
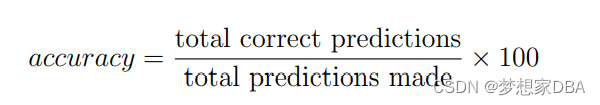
This accuracy can be calculated based on a hold-out dataset not seen by the model during training, such as a validation or test dataset. Classification accuracy or classification error is a proportion or a ratio. It describes the proportion of correct or incorrect predictions made by the model. Each prediction is a binary decision that could be correct or incorrect.
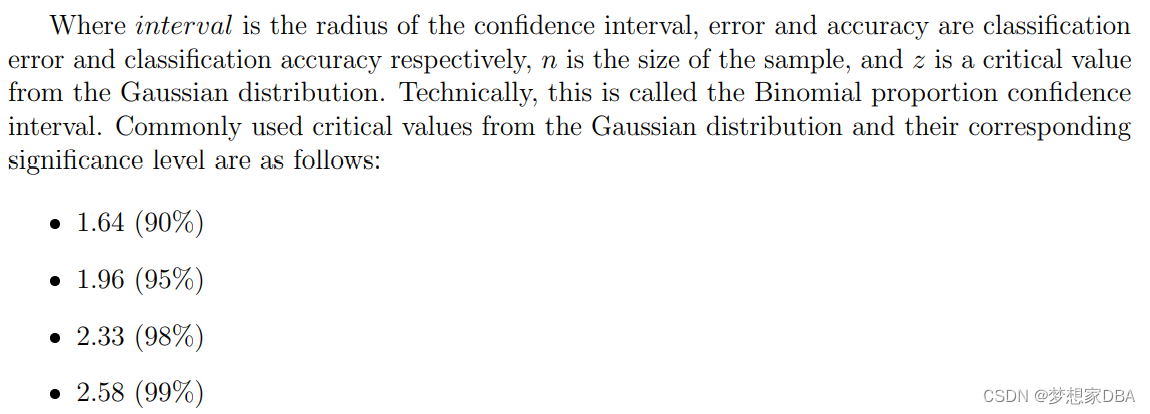
We can use the assumption of a Gaussian distribution of the proportion (i.e. the classification accuracy or error) to easily calculate the confidence interval. In the case of classification error, the radius of the interval can be calculated as:
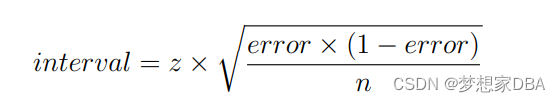
In the case of classification accuracy, the radius of the interval can be calculated as:

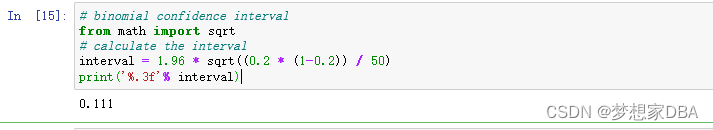
Consider a model with an error of 20%, or 0.2 (error = 0.2), on a validation dataset with 50 examples (n = 50). We can calculate the 95% confidence interval (z = 1.96) as follows:
# binomial confidence interval
from math import sqrt
# calculate the interval
interval = 1.96 * sqrt((0.2 * (1-0.2)) / 50)
print('%.3f'% interval)
Running the example, we see the calculated radius of the confidence interval calculated and printed.
We can then make claims such as:
- The classification error of the model is 20% +/- 11%
- The true classification error of the model is likely between 9% and 31%.
We can see the impact that the sample size has on the precision of the estimate in terms of the radius of the confidence interval.
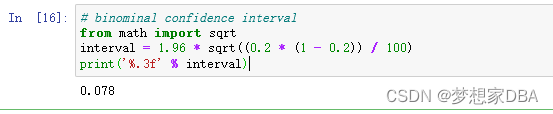
# binominal confidence interval
from math import sqrt
interval = 1.96 * sqrt((0.2 * (1 - 0.2)) / 100)
print('%.3f' % interval)
Running the example shows that the confidence interval drops to about 7%, increasing the precision of the estimate of the models skill.
The proportion confint() Statsmodels function an implementation of the binomial proportion confidence interval. By default, it makes the Gaussian assumption for the Binomial distribution, although other more sophisticated variations on the calculation are supported. The function takes the count of successes (or failures), the total number of trials, and the significance level as arguments and returns the lower and upper bound of the confidence interval. The example below demonstrates this function in a hypothetical case where a model made 88 correct predictions out of a dataset with 100 instances and we are interested in the 95% confidence interval (provided to the function as a significance of 0.05).
# calculate the confidence interval
from statsmodels.stats.proportion import proportion_confint
# calculate the interval
lower, upper = proportion_confint(88, 100, 0.05)
print('lower=%.3f, upper=%.3f' % (lower, upper))
Running the example prints the lower and upper bounds on the model’s classification accuracy.

1.4 Nonparametric Confidence Interval
Often we do not know the distribution for a chosen performance measure. Alternately, we may not know the analytical way to calculate a confidence interval for a skill score.
In these cases, the bootstrap resampling method can be used as a nonparametric method for calculating confidence intervals, nominally called bootstrap confidence intervals. The bootstrap is a simulated Monte Carlo method where samples are drawn from a fixed finite dataset with replacement and a parameter is estimated on each sample. This procedure leads to a robust estimate of the true population parameter via sampling. The bootstrap method was covered in detail in Chapter 17. We can demonstrate this with the following pseudocode.
statistics = []
for i in bootstraps:
sample = select_sample_with_replacement(data)
stat = calculate_statistic(sample)
statistics.append(stat)
The complete example is listed below:
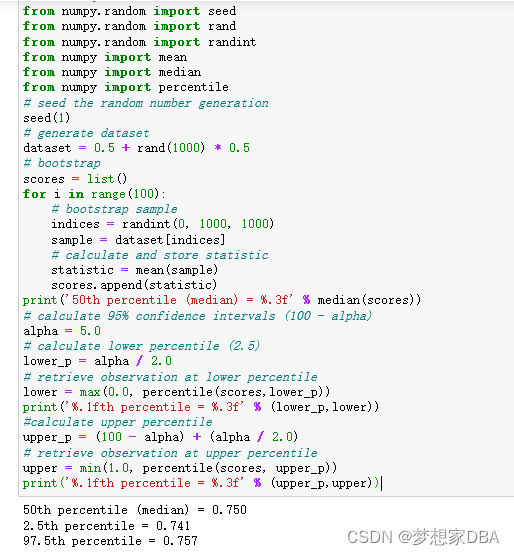
# bootstrap confidence intervals
from numpy.random import seed
from numpy.random import rand
from numpy.random import randint
from numpy import mean
from numpy import median
from numpy import percentile
# seed the random number generation
seed(1)
# generate dataset
dataset = 0.5 + rand(1000) * 0.5
# bootstrap
scores = list()
for i in range(100):
    # bootstrap sample
    indices = randint(0, 1000, 1000)
    sample = dataset[indices]
    # calculate and store statistic
    statistic = mean(sample)
    scores.append(statistic)
print('50th percentile (median) = %.3f' % median(scores))
# calculate 95% confidence intervals (100 - alpha)
alpha = 5.0
# calculate lower percentile (2.5)
lower_p = alpha / 2.0
# retrieve observation at lower percentile
lower = max(0.0, percentile(scores,lower_p))
print('%.1fth percentile = %.3f' % (lower_p,lower))
#calculate upper percentile
upper_p = (100 - alpha) + (alpha / 2.0)
# retrieve observation at upper percentile
upper = min(1.0, percentile(scores, upper_p))
print('%.1fth percentile = %.3f' % (upper_p,upper))
Running the example summarizes the distribution of bootstrap sample statistics including the 2.5th, 50th (median) and 97.5th percentile.
边栏推荐
- 密码学系列之:在线证书状态协议OCSP详解
- 美国空军研究实验室《探索深度学习系统的脆弱性和稳健性》2022年最新85页技术报告
- 腾讯云原生数据库TDSQL-C入选信通院《云原生产品目录》
- leetcode-02(链表题)
- leetcode
- 编译常量、ClassLoader类、系统类加载器深度探析
- 杰理之电话本获取【篇】
- The solution of unable to create servlet file after idea restart
- Household appliance industry under the "retail is king": what is the industry consensus?
- Hazel engine learning (V)
猜你喜欢
Don't you know the relationship between JSP and servlet?
Mathematical induction and recursion
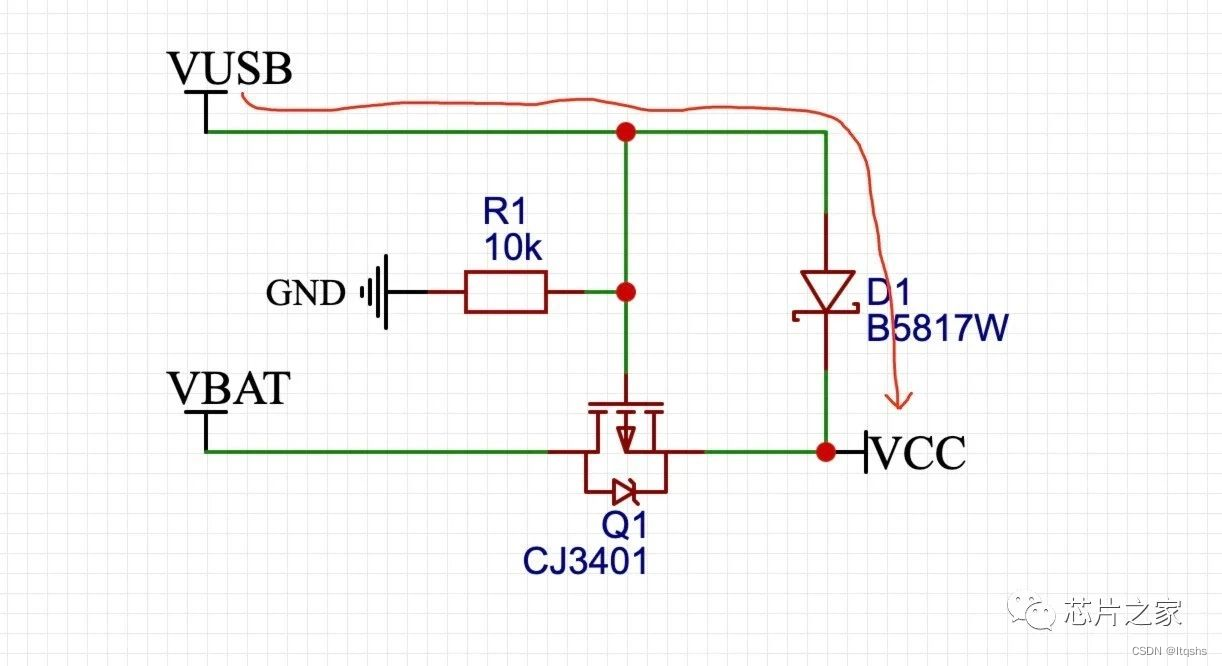
MOS transistor realizes the automatic switching circuit of main and auxiliary power supply, with "zero" voltage drop and static current of 20ua
![[cpk-ra6m4 development board environment construction based on RT thread studio]](/img/08/9a847c73d6da6fc74d84af56897752.png)
[cpk-ra6m4 development board environment construction based on RT thread studio]

The whole process of knowledge map construction

RestClould ETL 社区版六月精选问答

「小样本深度学习图像识别」最新2022综述
亚像素级角点检测Opencv-cornerSubPix
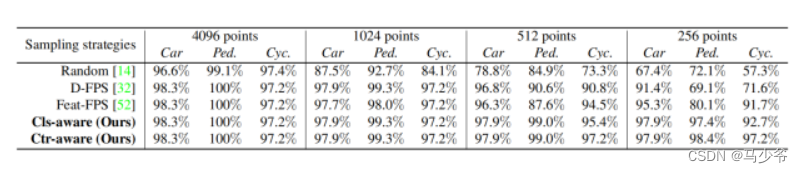
Not All Points Are Equal Learning Highly Efficient Point-based Detectors for 3D LiDAR Point

Flutter3.0了,小程序不止于移动应用跨端运行
随机推荐
[colmap] 3D reconstruction with known camera pose
Appx code signing Guide
杰理之FM 模式单声道或立体声选择设置【篇】
迷失在MySQL的锁世界
Appx代码签名指南
硬件之OC、OD、推挽解释
The whole process of knowledge map construction
opencv环境的搭建,并打开一个本地PC摄像头。
「小样本深度学习图像识别」最新2022综述
Lingyun going to sea | yidiantianxia & Huawei cloud: promoting the globalization of Chinese e-commerce enterprise brands
杰理之RTC 时钟开发【篇】
VHDL实现单周期CPU设计
Shangsilicon Valley JVM Chapter 1 class loading subsystem
cocos3——8. Implementation Guide for beginners
存储过程与函数(MySQL)
Starting from 1.5, build a micro Service Framework -- log tracking traceid
What about SSL certificate errors? Solutions to common SSL certificate errors in browsers
源代码保密的意义和措施
VHDL实现任意大小矩阵乘法运算
SQL中删除数据