preface
We will show you one in detail through a series of articles go-zero Microservice example , The whole series is divided into ten articles , The directory structure is as follows :
- Environment building
- Service split
- Customer service
- Product service
- Order service
- Payment services
- RPC service Auth verification
- Service monitoring
- Link tracking ( this paper )
- Distributed transactions
I hope this series will take you to use it locally Docker Environmental utilization go-zero Quickly develop a mall system , Let you get started with micro services quickly .
Complete sample code :https://github.com/nivin-studio/go-zero-mall
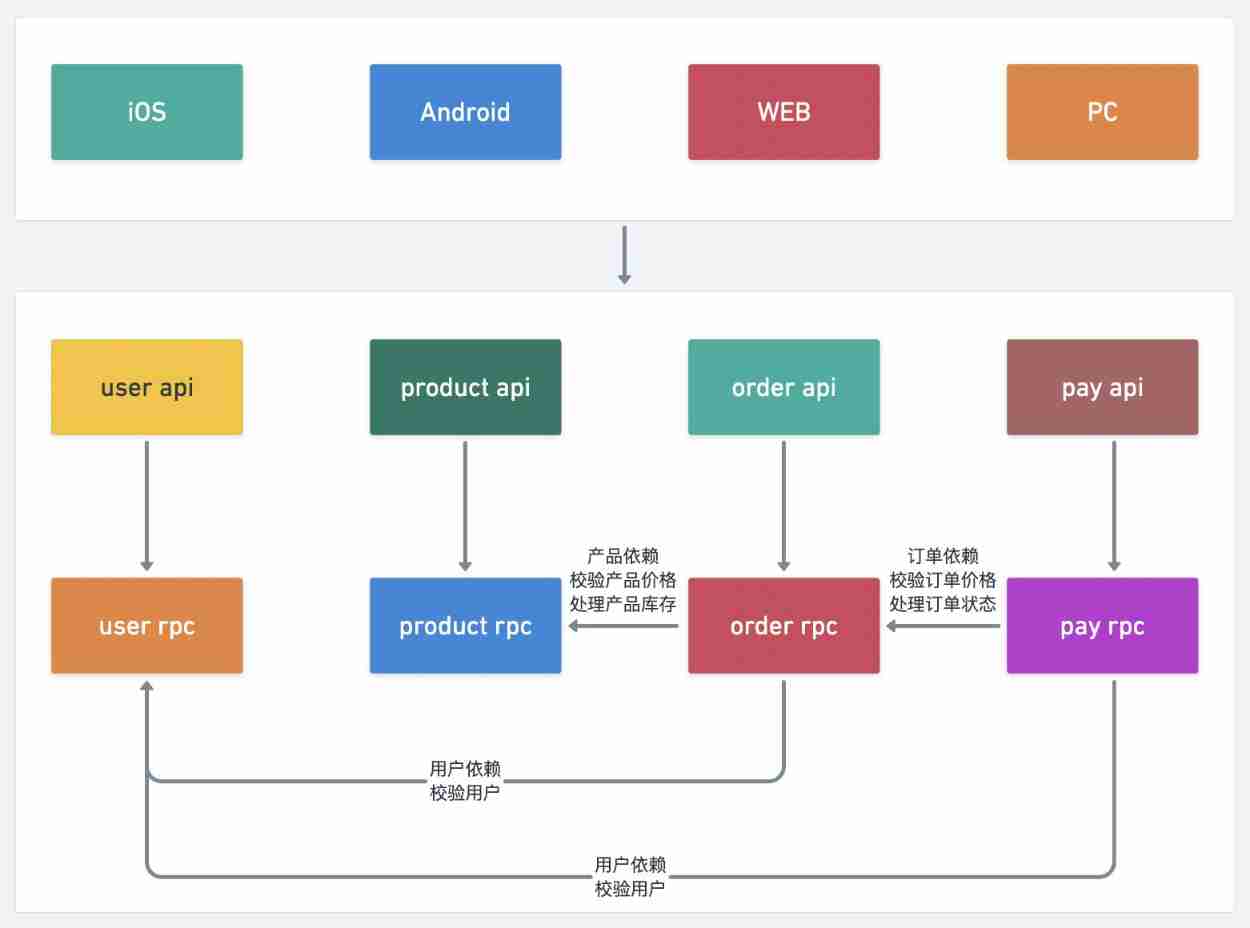
First , Let's take a look at the overall service split diagram :
9.1 Jaeger Introduce
Jaeger yes Uber Develop and open source a distributed tracking system , compatible OpenTracing API, For the following scenarios :
- Distributed tracking information transfer
- Distributed transaction monitoring
- Problem analysis
- Service dependency analysis
- performance optimization
Jaeger The full link tracking function of is mainly completed by three roles :
client: Be responsible for the timing of each call point on the whole chain 、 sampling , And willtracingThe data is sent locallyagent.agent: Responsible for collectionclientIt's fromtracingdata , AndthriftThe agreement is forwarded tocollector.collector: Responsible for collecting allagentReportedtracingdata , Unified storage .
9.2 go-zero Use Jaeger Link tracking
go-zero The framework has helped us realize link tracking ( See :go-zero Link tracking ), And the integration supports Jaeger, Zipkin These two link tracking and reporting tools , We just need a simple configuration , You can visually view the complete call chain of a request , And the call and performance of each link .
9.2.1 add to user api service Telemetry To configure
$ vim mall/service/user/api/etc/user.yaml
Name: User
Host: 0.0.0.0
Port: 8000

...

Telemetry:
  Name: user.api
  Endpoint: http://jaeger:14268/api/traces
  Sampler: 1.0
  Batcher: jaeger
9.2.2 add to user rpc service Telemetry To configure
$ vim mall/service/user/rpc/etc/user.yaml
Name: user.rpc
ListenOn: 0.0.0.0:9000

...

Telemetry:
  Name: user.rpc
  Endpoint: http://jaeger:14268/api/traces
  Sampler: 1.0
  Batcher: jaeger
9.2.3 add to product api service Telemetry To configure
$ vim mall/service/product/api/etc/product.yaml
Name: Product
Host: 0.0.0.0
Port: 8001

...

Telemetry:
  Name: product.api
  Endpoint: http://jaeger:14268/api/traces
  Sampler: 1.0
  Batcher: jaeger
9.2.4 add to product rpc service Telemetry To configure
$ vim mall/service/product/rpc/etc/product.yaml
Name: product.rpc
ListenOn: 0.0.0.0:9001

...

Telemetry:
  Name: product.rpc
  Endpoint: http://jaeger:14268/api/traces
  Sampler: 1.0
  Batcher: jaeger
9.2.5 add to order api service Telemetry To configure
$ vim mall/service/order/api/etc/order.yaml
Name: Order
Host: 0.0.0.0
Port: 8002

...

Telemetry:
  Name: order.api
  Endpoint: http://jaeger:14268/api/traces
  Sampler: 1.0
  Batcher: jaeger
9.2.6 add to order rpc service Telemetry To configure
$ vim mall/service/order/rpc/etc/order.yaml
Name: order.rpc
ListenOn: 0.0.0.0:9002

...

Telemetry:
  Name: order.rpc
  Endpoint: http://jaeger:14268/api/traces
  Sampler: 1.0
  Batcher: jaeger
9.2.7 add to pay api service Telemetry To configure
$ vim mall/service/pay/api/etc/pay.yaml
Name: Pay
Host: 0.0.0.0
Port: 8003

...

Telemetry:
  Name: pay.api
  Endpoint: http://jaeger:14268/api/traces
  Sampler: 1.0
  Batcher: jaeger
9.2.8 add to pay rpc service Telemetry To configure
$ vim mall/service/pay/rpc/etc/pay.yaml
Name: pay.rpc
ListenOn: 0.0.0.0:9003

...

Telemetry:
  Name: pay.rpc
  Endpoint: http://jaeger:14268/api/traces
  Sampler: 1.0
  Batcher: jaeger
Tips : After configuration modification , You need to restart the service to take effect .
9.3 Use Jaeger UI View link
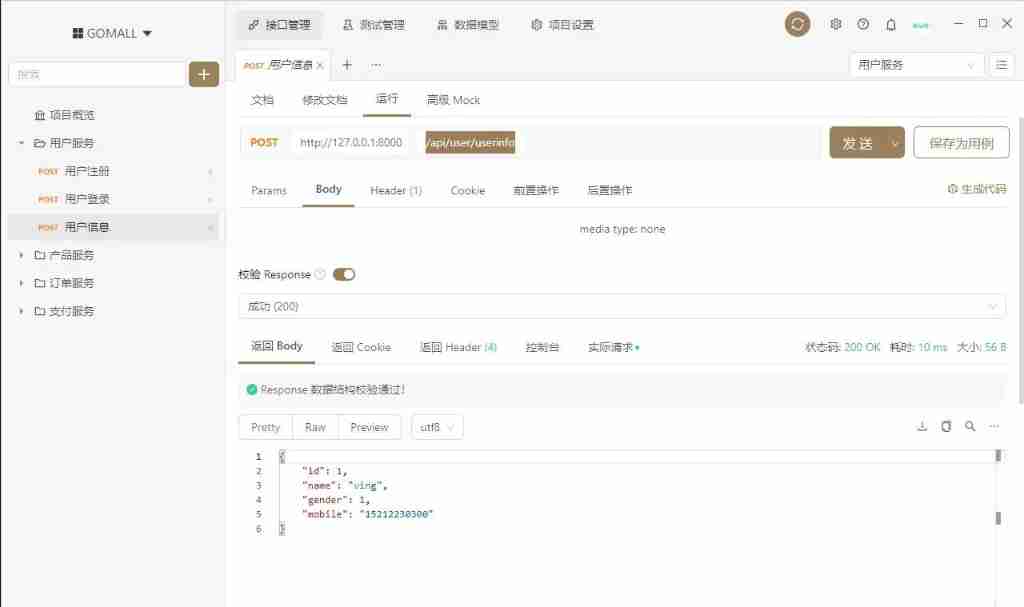
- visit
/api/user/userinfoapi Interface
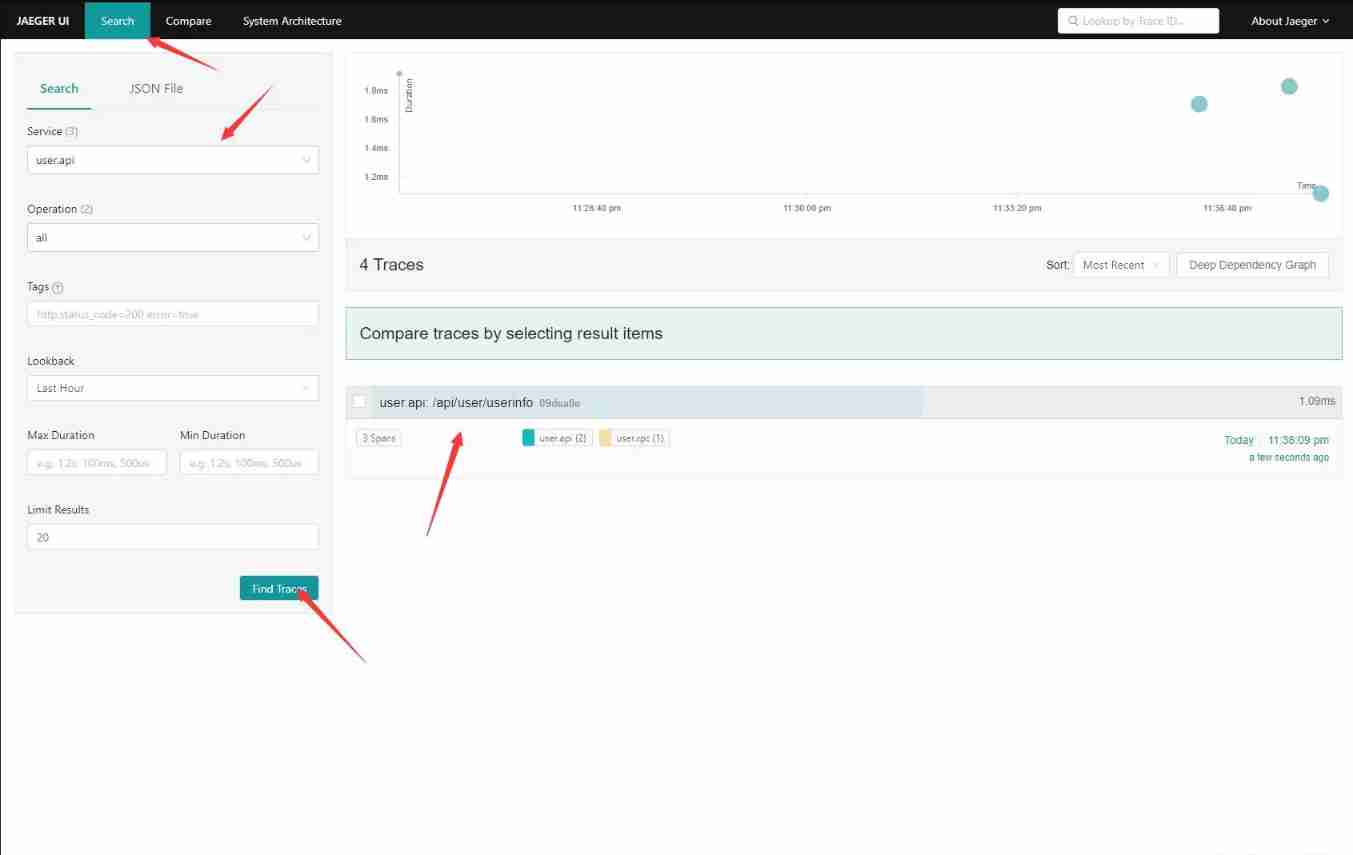
- stay Chapter one Environment building We integrated
Jaegerservice , And for itJaeger UIPort number16686Made the host port5000The mapping relation of , So enter... In the browserhttp://127.0.0.1:5000/visitJaeger UIInterface . choiceSearchmenu , stayServiceSelect from the drop-down boxuser.api, Finally, clickFind TracesButton , You can query the just accessed/api/user/userinfoLink tracking data of the interface .
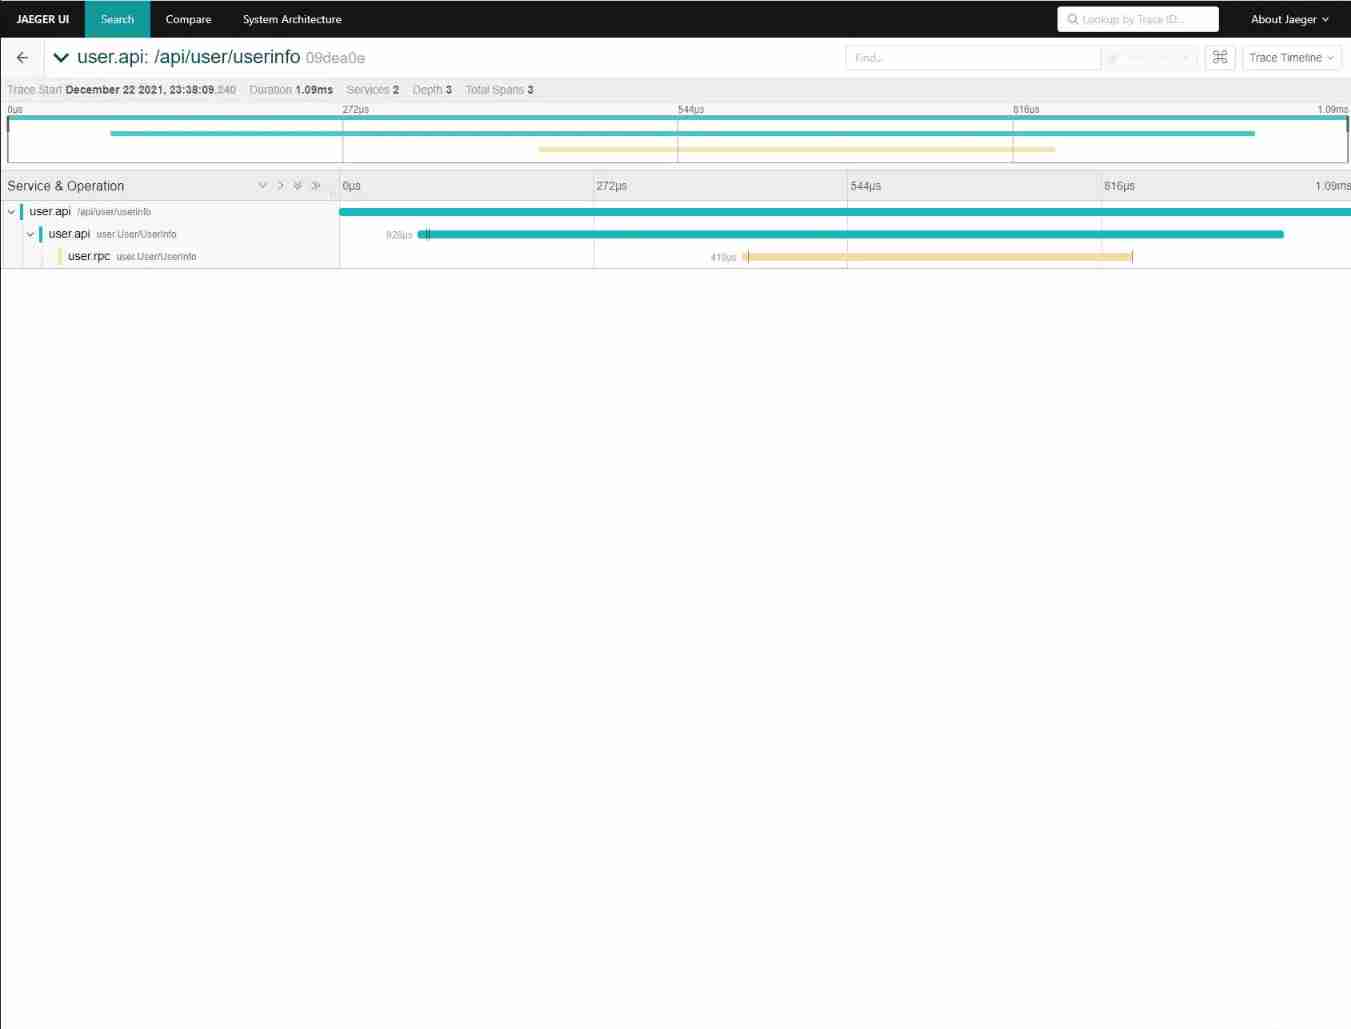
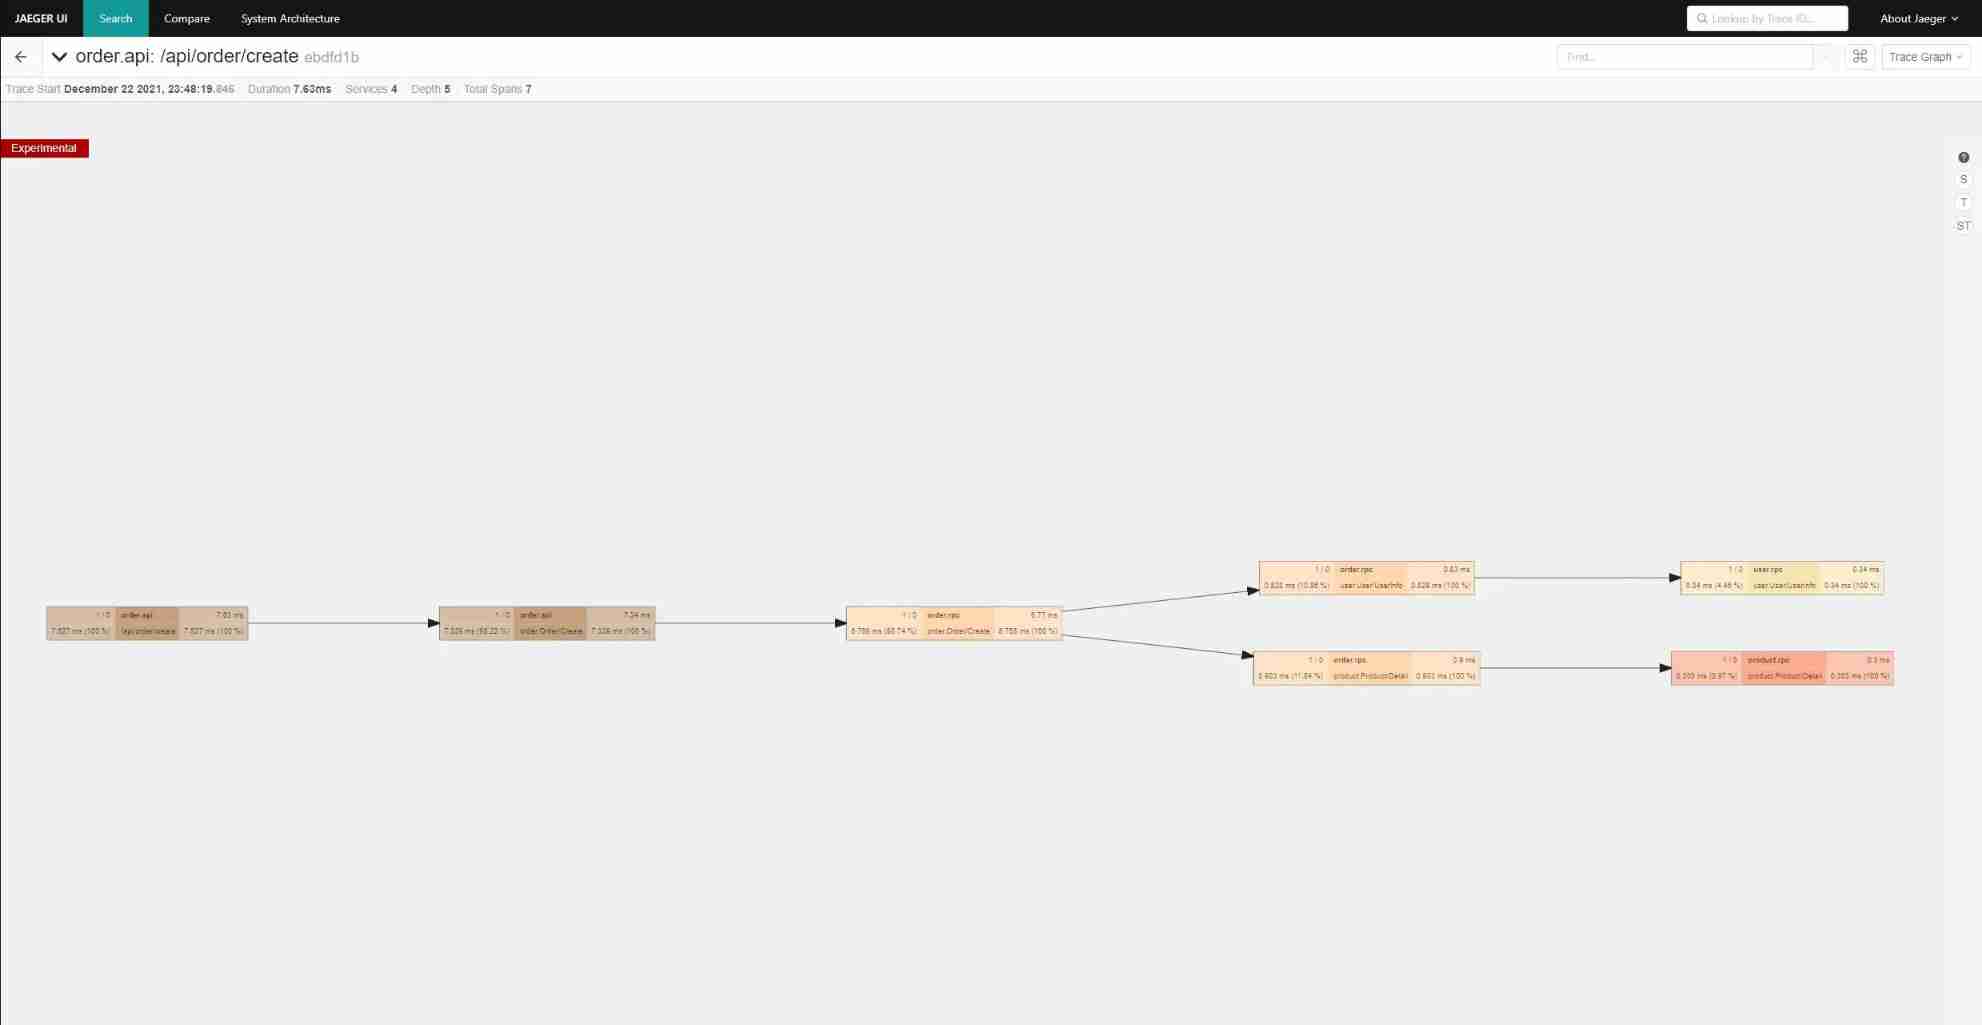
- Click in , You can see this
/api/user/userinfoLink sequence diagram of interface , And service dependencies , And time consuming .
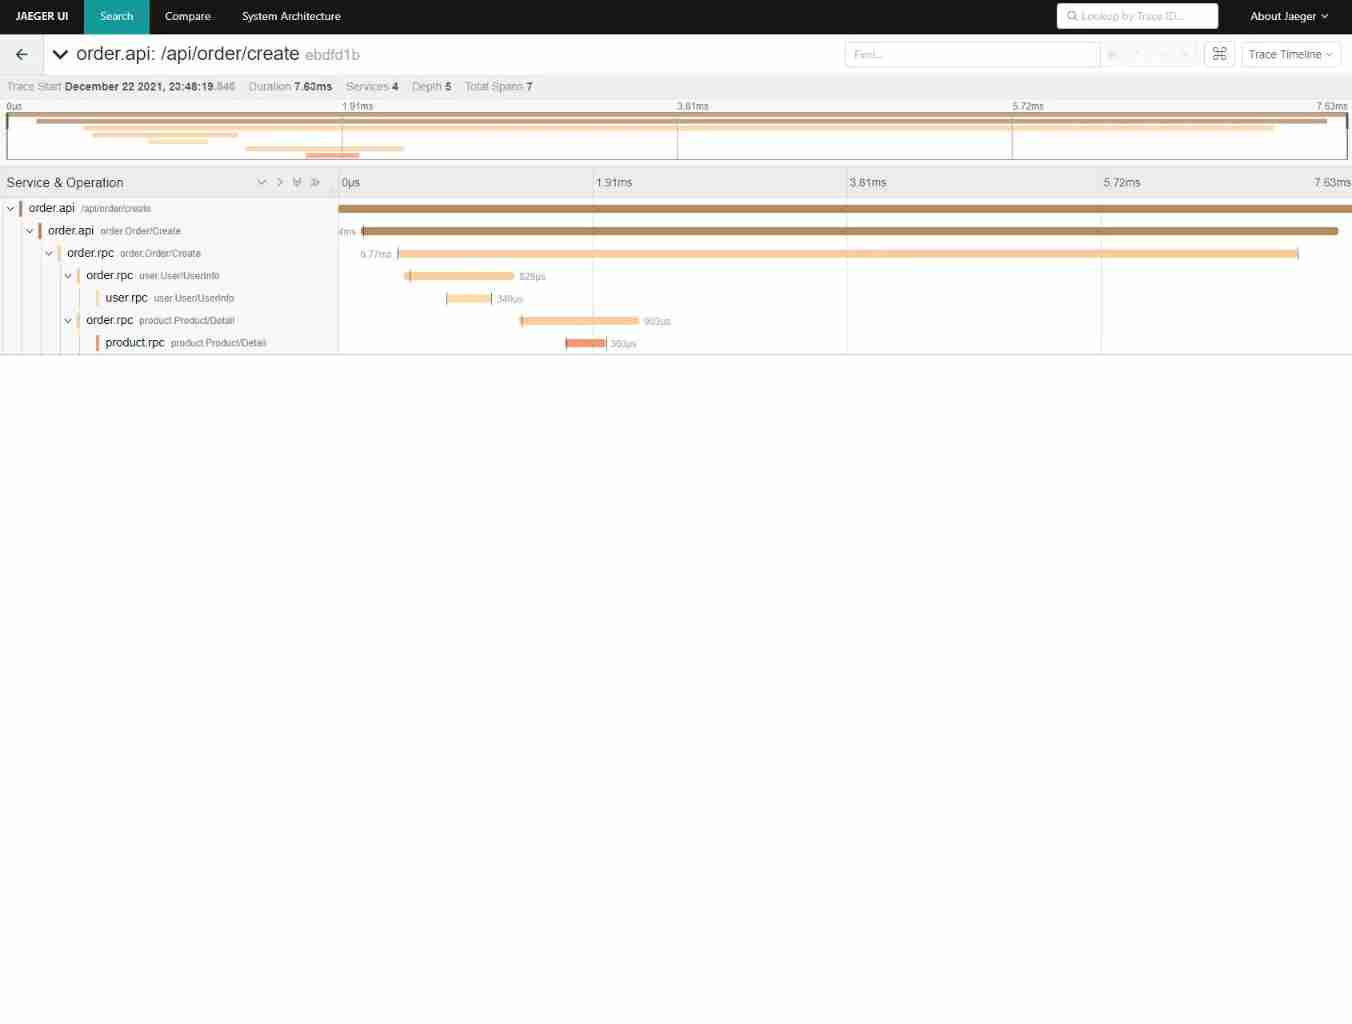
- Different data display styles can be selected from the drop-down menu in the upper right corner .

- Effect drawing of other interface link tracking
Project address
https://github.com/zeromicro/go-zero
Welcome to use go-zero and star Support us !
WeChat ac group
Focus on 『 Microservice practice 』 Official account and click Communication group Get community group QR code .
![抓包整理外篇——————状态栏[ 四]](/img/88/8267ab92177788ac17ab665a90b781.png)
![[wave modeling 3] three dimensional random real wave modeling and wave generator modeling matlab simulation](/img/22/6d3867015811aae29b8a7df5ee3d0b.png)