当前位置:网站首页>Elfk deployment
Elfk deployment
2022-07-05 13:48:00 【[email protected]】
List of articles
Environmental preparation
| Server type | Systems and IP Address | Components that need to be installed | Hardware aspect |
|---|---|---|---|
| node1 node | 192.168.16.10 | JDK、elasticsearch-6.7.2 | 2 nucleus 4G |
| node2 node | 192.168.16.20 | JDK、elasticsearch-6.7.2 | 2 nucleus 4G |
| apache node | 192.168.16.30 | JDK、apache、logstash-6.7.2、kabana-6.7.2、filebeat-6.7.2 | 2 nucleus 4G |
All nodes turn off the firewall
systemctl stop firewalld.service
systemctl disable firewalld.service
setenforce 0
1 Elasticsearch Deploy ( stay Node1、Node2 Operation on node )
1. install elasticsearch—rpm package
# Upload elasticsearch-6.7.2.rpm To /opt Under the table of contents
cd /opt
rpm -ivh elasticsearch-6.7.2.rpm
2. modify elasticsearch Master profile
cp /etc/elasticsearch/elasticsearch.yml /etc/elasticsearch/elasticsearch.yml.bak
vim /etc/elasticsearch/elasticsearch.yml
--17-- uncomment , Specify the cluster name
cluster.name: my-elk-cluster
--23-- uncomment , Specify the node name :Node1 The node is node1,Node2 The node is node2
node.name: node1
node.master: true		# whether master node ,false Why not
node.data: true			# Whether the data node ,false Why not
--35-- uncomment , Specify the data storage path
path.data: /var/lib/elasticsearch
--39-- uncomment , Specify the log storage path
path.logs: /var/log/elasticsearch
--45-- uncomment , avoid es Use swap Swap partition
bootstrap.memory_lock: true
--57-- uncomment , Set listening address ,0.0.0.0 For all addresses
network.host: 0.0.0.0
--51-- uncomment ,ES  The default listening port of the service is 9200
http.port: 9200					# Appoint es The cluster provides an interface for external access
transport.tcp.port: 9300		# Appoint es Internal communication interface of the cluster
--71-- uncomment , Cluster discovery is realized by unicast , Specify the nodes to discover
discovery.zen.ping.unicast.hosts: ["192.168.16.10:9300", "192.168.2.11:9300"]

grep -v "^#" /etc/elasticsearch/elasticsearch.yml
es Performance tuning parameters
3. Optimize the maximum memory size and the maximum number of file descriptors
vim /etc/security/limits.conf
......

*  soft    nofile          65536
*  hard    nofile          131072
*  soft    memlock         unlimited
*  hard    memlock         unlimited
systemctl daemon-reexec

vim /etc/sysctl.conf
# The maximum number of memory mapped areas a process can have , Reference data ( Distribute  2g/262144,4g/4194304,8g/8388608)
vm.max_map_count=262144

sysctl -p
sysctl -a | grep vm.max_map_count
4. start-up elasticsearch Is it successfully opened
systemctl start elasticsearch
systemctl enable elasticsearch
netstat -antp | grep 9200
5. View node information
 Browser access  http://192.168.16.10:9200 、 http://192.168.16.20:9200  Look at the node  Node1、Node2  Information about .

 Browser access  http://192.168.16.10:9200/_cluster/state?prettyhttp://192.168.239.10:9200http://192.168.239.10:9200/_cluster/state?pretty  Check the cluster status information .
2 Logstash Deploy ( stay Apache Operation on node )
1. install Apahce service (httpd)、 install Java Environmental Science 、 install logstash、 install Kiabana
# install Apahce service (httpd)
yum -y install httpd
systemctl start httpd

# install Java Environmental Science
yum -y install java
java -version

# install logstash
# Upload package  logstash-6.7.2.rpm  To /opt Under the table of contents
cd /opt
rpm -ivh logstash-6.7.2.rpm
systemctl start logstash.service
systemctl enable logstash.service

ln -s /usr/share/logstash/bin/logstash /usr/local/bin/

# install  Kiabana
# Upload package  kibana-6.7.2-x86_64.rpm  To /opt Catalog
cd /opt
rpm -ivh kibana-6.7.2-x86_64.rpm
2. Set up Kibana Primary profile for
vim /etc/kibana/kibana.yml

--2-- uncomment ,Kiabana  The default listening port of the service is 5601
server.port: 5601
--7-- uncomment , Set up  Kiabana  The monitoring address of ,0.0.0.0 For all addresses
server.host: "0.0.0.0"
--28-- uncomment , To configure es Server's ip, If it is a cluster, configure it master Node ip
elasticsearch.url:  ["http://192.168.16.10:9200","http://192.168.16.20:9200"]
--37-- uncomment , Set in the  elasticsearch  Add .kibana Indexes
kibana.index: ".kibana"
--96-- uncomment , To configure kibana Log file path for ( You need to create... Manually ), Otherwise, the default is messages Keep a log in the library
logging.dest: /var/log/kibana.log
3. Create a log file , start-up Kibana service
touch /var/log/kibana.log
chown kibana:kibana /var/log/kibana.log
systemctl start kibana
systemctl enable kibana
netstat -natp | grep 5601
4. Create index
take Apache Log of the server ( Access to the 、 FALSE ) Add to Elasticsearch And pass Kibana Show
vim /etc/logstash/conf.d/apache_log.conf

input {

    file{

        path => "/etc/httpd/logs/access_log"  # Specify the exact directory location
        type => "access"
        start_position => "beginning"
    }
    file{

        path => "/etc/httpd/logs/error_log"   # Specify the error log directory
        type => "error"
        start_position => "beginning"
    }
}
output {

    if [type] == "access" {

        elasticsearch {

            hosts => ["192.168.16.10:9200","192.168.16.20:9200"]
            index => "apache_access-%{+YYYY.MM.dd}"
        }
    }
        if [type] == "error" {

        elasticsearch {

            hosts => ["192.168.16.10:9200","192.168.16.20:9200"]
            index => "apache_error-%{+YYYY.MM.dd}"
        }
    }
}
cd /etc/logstash/conf.d/
logstash -f apache_log.conf
 At this time, the browser accesses http://192.168.16.30 Add access log

 Browser access  http://192.168.16.10:5601/ Sign in  Kibana Create index
3 Filebeat+ELK Deploy
stay apache Operation on node
1. install Filebeat
# Upload package  filebeat-6.7.2-linux-x86_64.tar.gz  To /opt Catalog
tar zxvf filebeat-6.7.2-linux-x86_64.tar.gz
mv filebeat-6.7.2-linux-x86_64/ /usr/local/filebeat
2. Set up filebeat Primary profile for
vim filebeat.yml

filebeat.prospectors:

- type: log         # Appoint  log  type , Read message from log file
  enabled: true
  paths:
    - /var/log/messages       # Specify the log file to monitor
    - /var/log/*.log
      tags: ["sys"]		# Set index label
      fields:           # have access to  fields  Configure options to set some parameter fields to  output  in
        service_name: filebeat
        log_type: syslog
        from: 192.168.16.30

--------------Elasticsearch output-------------------
( Comment all out )

----------------Logstash output---------------------
output.logstash:
  hosts: ["192.168.16.30:5044"]      # Appoint  logstash  Of  IP  And port

# start-up  filebeat
nohup ./filebeat -e -c filebeat.yml > filebeat.out &
#-e: Output to standard output , Ban syslog/ File output
#-c: Specify profile
#nohup: Run commands without hanging up in the background of the system , Quitting the terminal will not affect the running of the program
3. stay Logstash Create a new node on the node where the component is located Logstash The configuration file
cd /etc/logstash/conf.d

vim filebeat.conf
input {

    beats {

        port => "5044"
    }
}
output {

    elasticsearch {

        hosts => ["192.168.16.10:9200","192.168.16.20:9200"]
        index => "%{[fields][service_name]}-%{+YYYY.MM.dd}"
    }
    stdout {

        codec => rubydebug
    }
}
# start-up  logstash
logstash -f filebeat.conf
Browser access http://192.168.16.30:5601 Sign in Kibana, single click “Create Index Pattern” Button to add an index “filebeat-*”, single click “create” Button to create , single click “Discover” Button to view chart information and log information .
At this time, add the cable
4 Filter plug-in unit
And for Logstash Of Filter, That's it Logstash The most powerful place .Filter There are many plug-ins , We often use it grok、date、mutate、mutiline Four plug-ins .
about filter The implementation process of each plug-in of , You can see the picture below :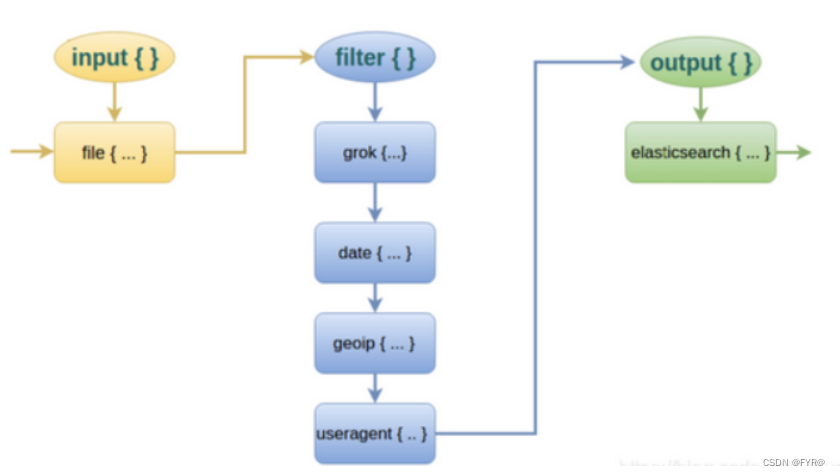
Filter Functions of common plug-ins
grok : Divide several large text fields into small fields
date: Unify and format the time format in the data
mutate: Eliminate some useless fields , Or add fields
mutiline : Arrange multiple rows of data in a unified way , Split multiple lines
grok plug-in unit
Match format :(?< Field name > Regular expressions )
I'm gonna use it here logstash Of filter Medium grok plug-in unit .filebeat Send to logstash The contents of the log will be put in message In the field ,logstash Match this message Fields are OK . The configuration items are as follows :
 Example 1
(?<remote_addr>%{
    IPV6}|%{
    IPV4} )(?<other_info>.+)
# Split the data ip Field called remote_addr,  Other fields are named other_info

 Example 2
(?<remote_addr>%{
    IPV6}|%{
    IPV4} )[\s\-]+\[(?<log_time>.+)\](?<other_info>.+)
# Add a match time field

 Example 3
# Split multiple fields
(?<remote_addr>%{
    IPV6}|%{
    IPV4})[\s\-]+\[(?<log_time>.+)\]\s+\"(?<http_method>\S+)\s+(?<url-path>.+)\"\s+(?<rev_code>\d+)(?<other_info>.+)

 Write this regular to the configuration file to filter the data
cd /etc/logstash/conf.d/
cp filebeat.conf filter.conf
vim filter.conf

input {

    beats {

        port => "5044"
    }
}
filter {

  grok {

     match =>["message","(?<remote_addr>%{IPV6}|%{IPV4} )[\s\-]+\[(?<log_time>.+)\]\s+\"(?<http_method>\S+)\s+(?<url-path>.+)\"\s+(?<rev_code>\d+)(?<other_info>.+)"]
  }
}
output {

    elasticsearch {

        hosts => ["192.168.16.10:9200","192.168.16.20:9200"]
        index => "{[filter][service_name]}-%{+YYYY.MM.dd}"
    }
    stdout {

        codec => rubydebug
    }
}
 logstash -f filter.conf# start-up
 At this time, enter kibana View and add index
版权声明
本文为[[email protected]]所创,转载请带上原文链接,感谢
https://yzsam.com/2022/186/202207051335384310.html
边栏推荐
- 【公开课预告】:视频质量评价基础与实践
- Intranet penetration tool NetApp
- Don't know these four caching modes, dare you say you understand caching?
- Solve the problem of "unable to open source file" xx.h "in the custom header file on vs from the source
- Nantong online communication group
- 那些考研后才知道的事
- French scholars: the explicability of counter attack under optimal transmission theory
- 几款分布式数据库的对比
- MySQL get time
- stm32逆向入门
猜你喜欢

MMSeg——Mutli-view时序数据检查与可视化
![[public class preview]: basis and practice of video quality evaluation](/img/d8/a367c26b51d9dbaf53bf4fe2a13917.png)
[public class preview]: basis and practice of video quality evaluation
uplad_ Labs first three levels
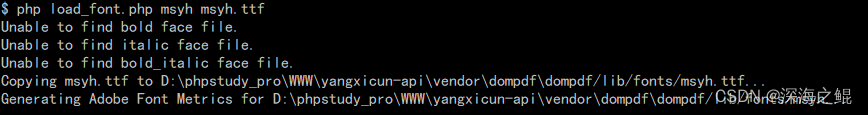
laravel-dompdf导出pdf,中文乱码问题解决
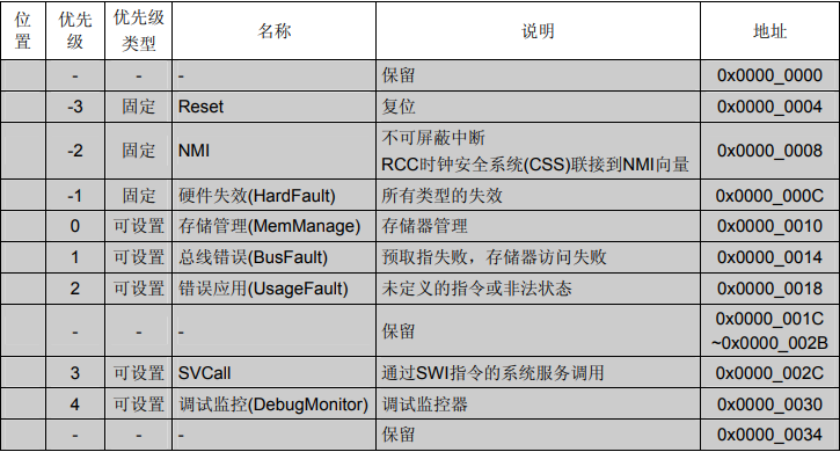
STM32 reverse entry

What about data leakage? " Watson k'7 moves to eliminate security threats

【华南理工大学】考研初试复试资料分享
Godson 2nd generation burn PMON and reload system
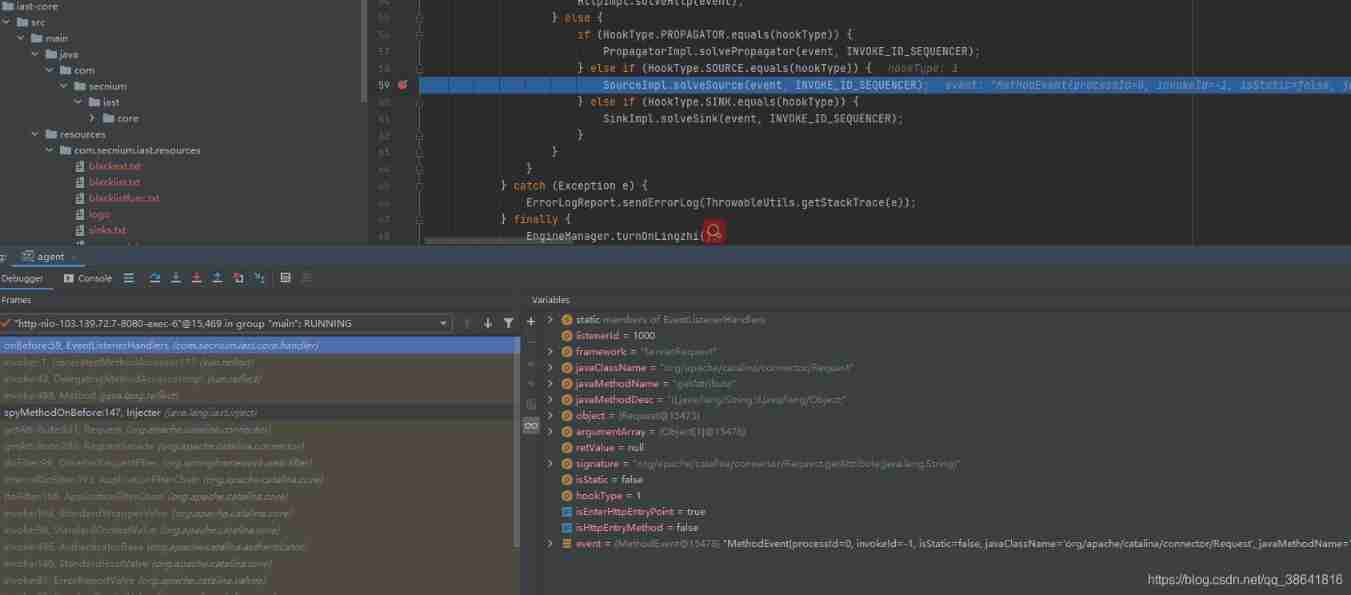
Idea remote debugging agent
Liar report query collection network PHP source code
随机推荐
mysql获得时间
How to divide a large 'tar' archive file into multiple files of a specific size
kafaka 日志收集
Personal component - message prompt
Data Lake (VII): Iceberg concept and review what is a data Lake
NFT value and white paper acquisition
私有地址有那些
几款分布式数据库的对比
When there are too many input boxes such as input transmitted at one time in the form, the post data is intercepted
What is information security? What is included? What is the difference with network security?
【Hot100】34. Find the first and last positions of elements in a sorted array
Zibll theme external chain redirection go page beautification tutorial
Mmseg - Mutli view time series data inspection and visualization
Introduction to Chapter 8 proof problem of njupt "Xin'an numeral base"
Programmer growth Chapter 8: do a good job of testing
Cloudcompare - point cloud slice
Laravel generate entity
asp. Net read TXT file
53. 最大子数组和:给你一个整数数组 nums ,请你找出一个具有最大和的连续子数组(子数组最少包含一个元素),返回其最大和。
Don't know these four caching modes, dare you say you understand caching?