当前位置:网站首页>Matplotlib(三)—— 实践
Matplotlib(三)—— 实践
2022-08-05 05:13:00 【share16】
Python模块 —— Matplotlib
Matplotlib(三)—— 实践
大家可以关注知乎或微信公众号的share16,我们也会同步更新此文章。
数据可视化的图表种类繁多,各式各样,因此我们需要掌握如何在特定场景下使用特定的图表。
数据可视化是为业务目的服务的,好的可视化图表可以起到清晰准确反映业务结果的目的;在选择使用何种图表时,通常我们需要首先考虑你想通过可视化阐述什么样的故事,受众是谁,以及打算如何分析结果。
本篇将介绍不同场景适合的可视化图表类型、使用注意事项以及如何用现成的绘图接口来呈现。我们将常见的场景分为5大类:
1. 展示趋势变化(Evolution)
2. 展示分布关系(Distribution)
3. 展示相关关系(Correlation)
4. 展示排序信息(Ranking)
5. 展示组成关系(Part of a whole)
五、matplotlib实践
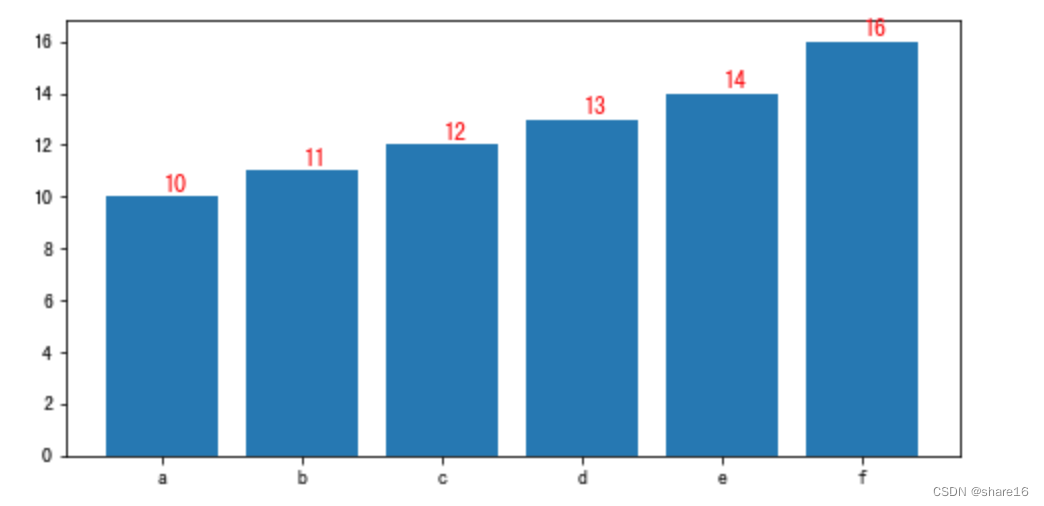
5.0 添加数据标签
''' 以柱状图为例, fig.patches:获取图表中每个小的图形的坐标,如‘Rectangle(xy=(0.6, 0), width=0.8, height=487.704, angle=0)’ i.get_xy:获取xy属性的值 '''

plt.figure(figsize=(8,4))
fig = plt.bar(x=['a','b','c','d','e','f'],height=[10,11,12,13,14,16])
for i in fig.patches:
    # print(i)
    plt.text(i.get_xy()[0]+0.4,i.get_height()+0.2,s=round(i.get_height(),2),color='r',fontsize=12)
5.1 展示趋势变化
5.1.1 线图(plt.plot)
线图可直接用plt.plot()函数绘制。
- 当只输入一列的时候,会默认为Y轴的值,然后自动生成X轴;亦可输入两列数,分别代表X轴和Y轴;
- 是否需要截断Y轴,即Y轴是否必须要从0点开始,可用plt.ylim();
- 要比较两个或多个不同变量的变化趋势,不要用双Y轴;
- 有很多线条的时候,建议用多子图形式(坐标轴要一致)或重点突出某几条线;
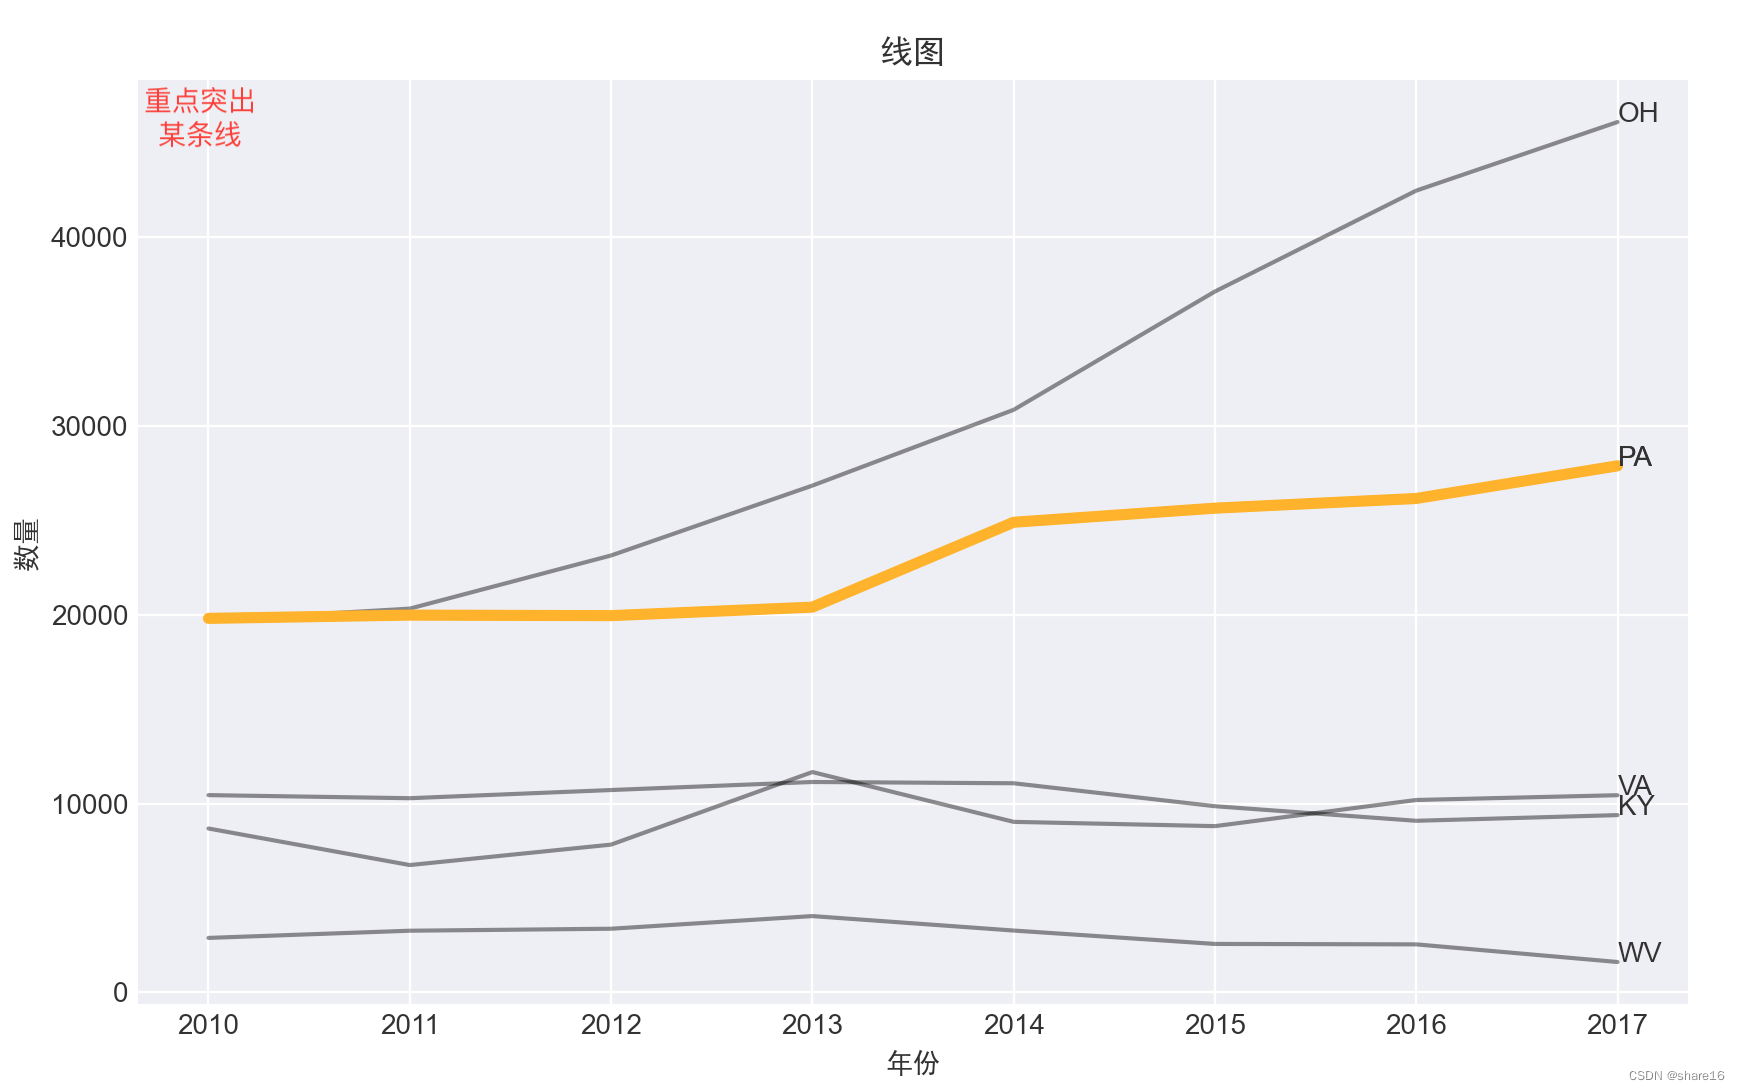
重点突出某一条线,如PA为橘色、其他的都为灰色
import matplotlib.pyplot as plt
import pandas as pd
df = pd.read_csv('/xxx/09 Drugs.csv')
df_status = df.pivot_table(index=['YYYY','State'],values='DrugReports',aggfunc='sum').reset_index('YYYY')

''' 重点突出某一条线,如PA为橘色、其他的都为灰色 '''
ls0 = df_status.index.unique() # 所有的status
ls1 = ['PA']  # 要重点突出的status

plt.figure(figsize=(10,6))
plt.style.use('seaborn-darkgrid') # 设定式样
for i in ls0:
    data = df_status.loc[i]
    plt.plot(data.YYYY,data.DrugReports,alpha=0.5,color='k',label=i) # 绘制每个status的折线
    plt.text(data.tail(1).YYYY,data.tail(1).DrugReports,i)
for j in ls1:
    data = df_status.loc[j]
    plt.plot(data.YYYY,data.DrugReports,linewidth=4,color='orange',label=j)
    plt.text(data.tail(1).YYYY,data.tail(1).DrugReports,j)
plt.title('线图',fontfamily='SimHei')
plt.xlabel('年份',fontfamily='SimHei')
plt.ylabel('数量',fontfamily='SimHei')
# plt.legend() # 必须在plt.plot后面 且 plt.plot必须定义label,否则提示错误
多子图形式
''' 多子图形式 '''
rows,cols = 1,5
ls2 = pd.Series(df_status.index).unique().reshape(rows,cols)

plt.style.use('seaborn-darkgrid') # 设定式样
fig,ax = plt.subplots(rows,cols,figsize=(15,3),sharex=True,sharey=True)
fig.suptitle('多子图',fontfamily='SimHei') # 此处,还可以是 plt.suptitle()
for i in range(rows):
    for j in range(cols):
        data = df_status.loc[ls2[i][j]]
        ax[j].plot(data.YYYY, data.DrugReports) # 注意查看ax;因rows=1,则用ax[j];若rows>1,则用ax[i][j]
        ax[j].set_title(ls2[i][j])   # 若要plt.title(),只有最后一个图有表头
fig.tight_layout() # 此处,还可以是 plt.tight_layout()

5.1.2 面积图(plt.fill_between)
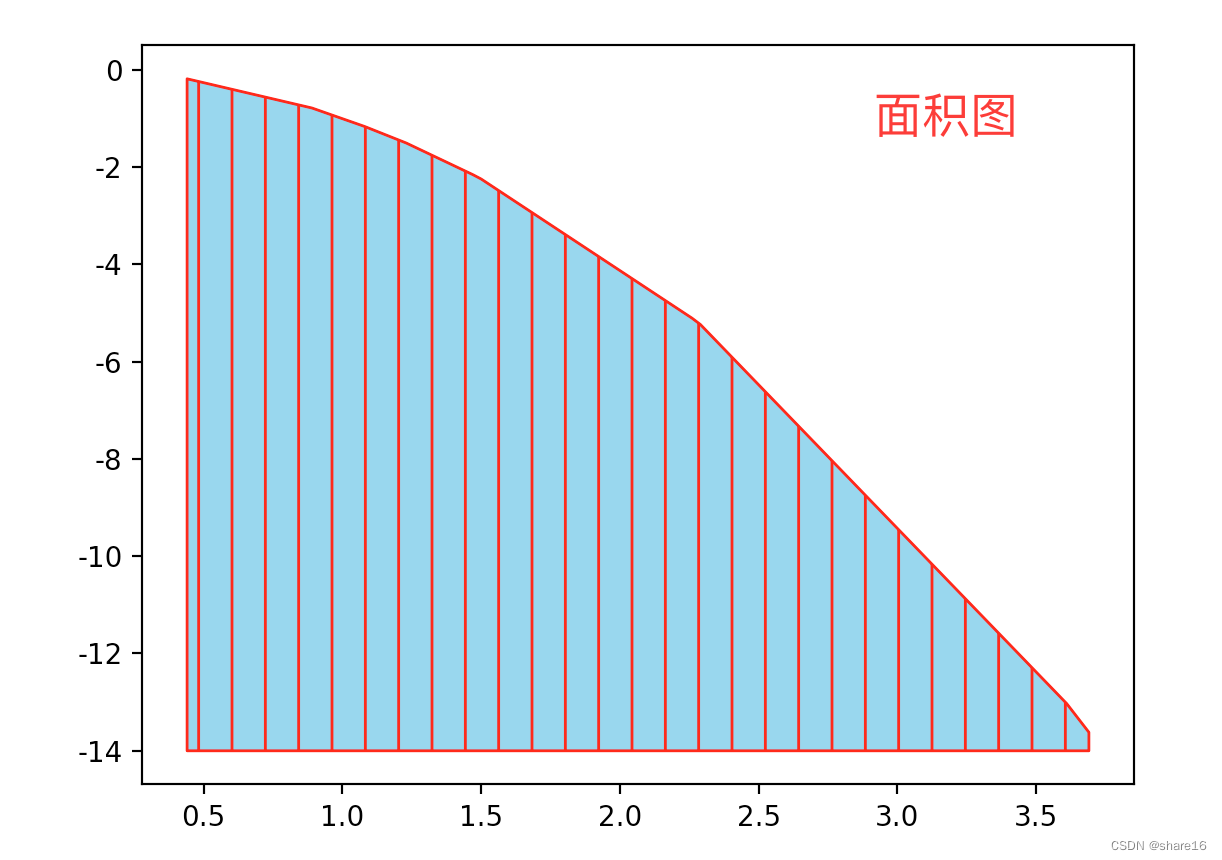
面积图和折线图从形式上看,非常相似;区别是面积图在折线图的基础上,填充折线下面的区域(可用颜色或阴影去填充),可用plt.fill_between()(适用于定制化)和plt.stackplot()(适用于堆积面积图)来实现。
- 若需要对比两个及其以上的类别,建议使用堆积面积图;若一定要在单一面积图上表示,注意填充颜色一定要是透明色的,可以看到所有的线条;
- 注意图形的长宽比,让图形更易读一点;
- 一个好的做法是:将线条和填充的颜色保持统一,填充的颜色设置一些透明度,这些的图形会更美观一点;
plt.fill_between(x,y1,y2,where,color,facecolor,hatch,···)
- 用于填充两条水平曲线之间的区域,两个点(x,y1)和(x,y2)定义了曲线,y2的默认值是0;
- where:定义是否需要排除某些垂直区域以使其不被填充;
- color:必须在facecolor前面,其表示的填充区域边框的颜色;若在facecolor后面,则是填充区域的整体颜色;
- facecolor:填充区域的颜色,可取值red / skyblue / blue等;
- hatch:控制阴影式样,可取值{‘/’, ‘\’, ‘|’, ‘-’, ‘+’, ‘x’, ‘o’, ‘O’, ‘.’, ‘*’}
import matplotlib.pyplot as plt
x = [0.44,0.89,1.08,1.23,1.47,1.5,2.26,2.29,3.61,3.69]
y = [-0.19,-0.79,-1.17,-1.51,-2.16,-2.25,-5.11,-5.24,-13.03,-13.62]
plt.fill_between(x,y,y2=-14,color='r',facecolor='skyblue',hatch='|')
5.1.3 堆积面积图(plt.stackplot或plt.bar)
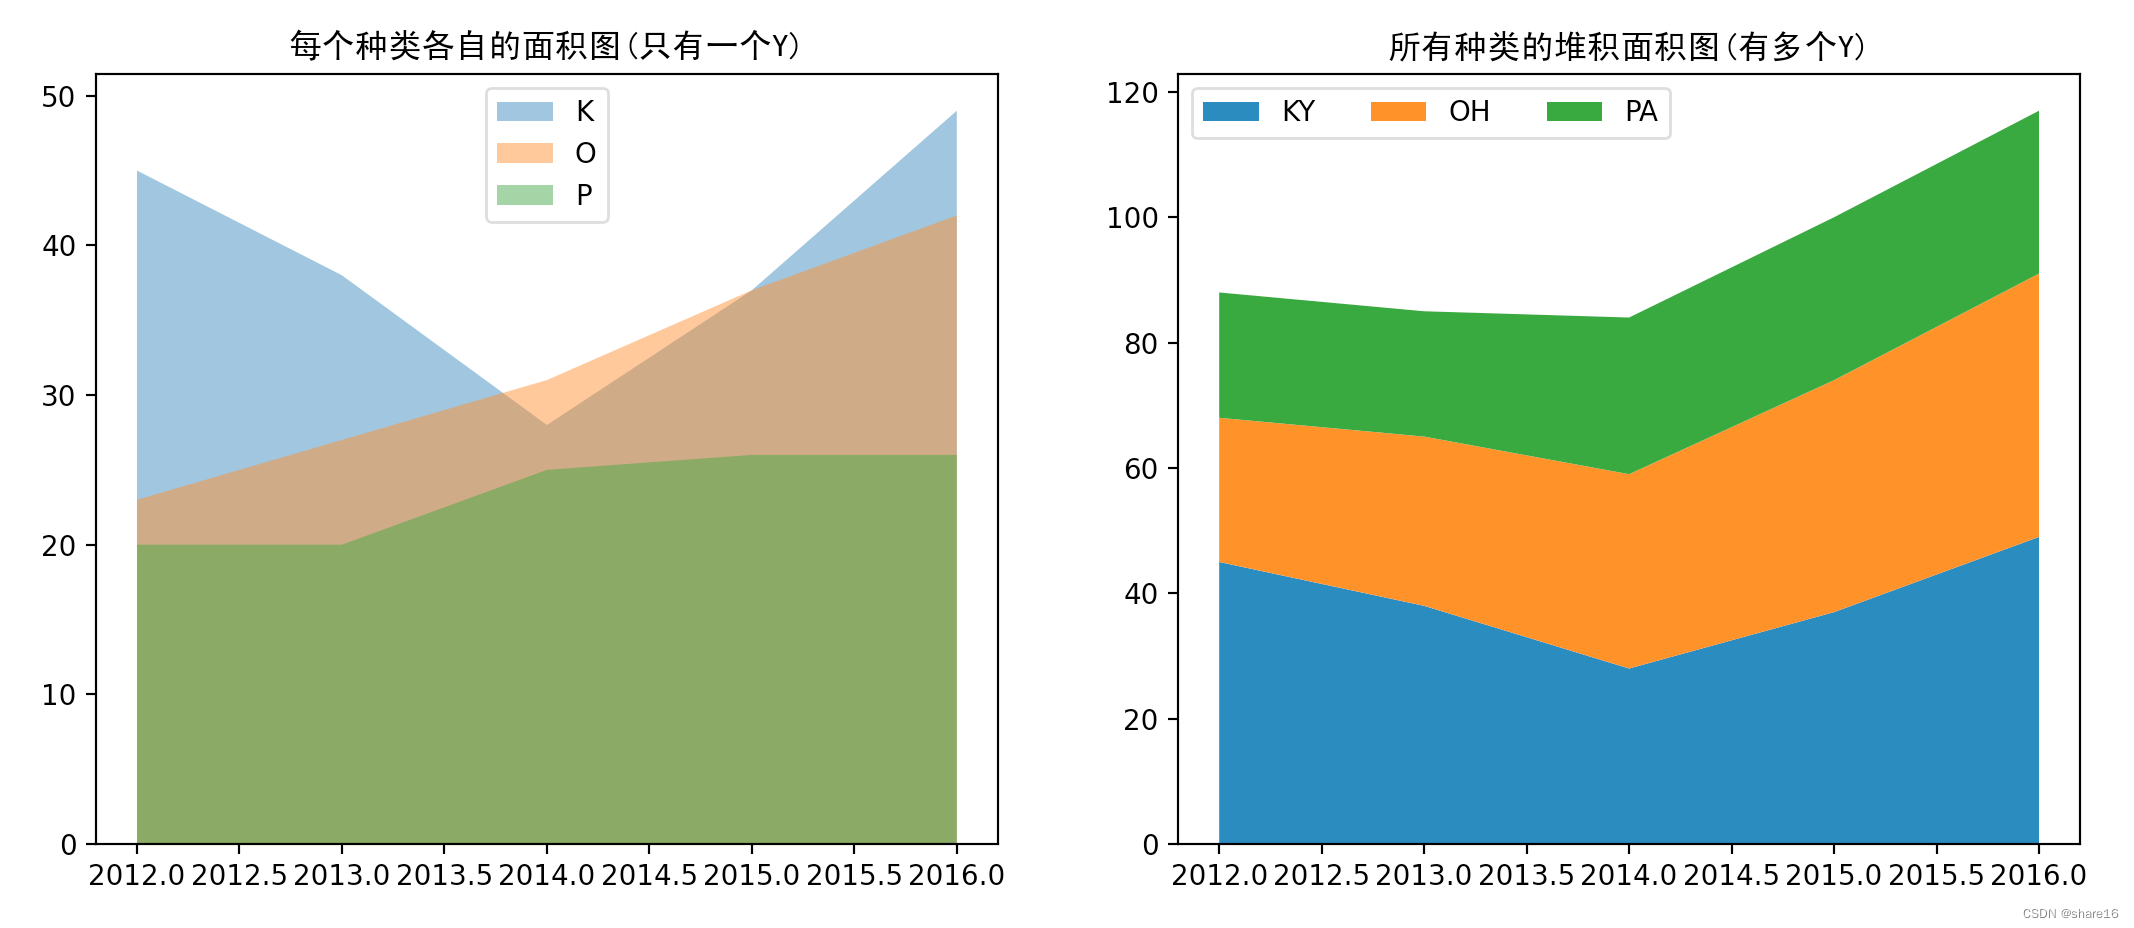
堆积面积图是基础面积图的一个延伸,它将多个类别的数据变化都显示在了一个图形中;可用plt.stackplot()函数绘制,它的数据输入方式可以是一个X和多个Y,也可以将多列Y的数据合并成一个。
- 不同于多折线图的线条可能相互交叉,堆积面积图不会出现不同分类的数据点被遮盖、被隐藏的状况,每个类别都是堆积在下面类别面积图之上的;
- 堆积面积图与标准面积图不同,某一分类的值并非与纵坐标完全对应,而是通过折线之间的相对高度来表达;
- 堆积面积图不仅可以展示各类的发展趋势(面积图和折线图都能表示这个),可以表达总体的发展趋势和个种类间的关系,比如重要程度/大致占比等;
import matplotlib.pyplot as plt
import pandas as pd
df = pd.DataFrame([[2012,45,23,20],[2013,38,27,20],[2014,28,31,25],[2015,37,37,26],[2016,49,42,26]],columns=['year','KY','OH','PA'])

plt.figure(figsize=(15,5))
plt.subplot(1,2,1)
ls = df.columns.drop('year')
for i in ls:
    plt.stackplot(df.year,df[i],alpha=0.5,labels=i)
plt.title('每个种类各自的面积图(只有一个Y)',fontfamily='SimHei')
plt.legend(loc='upper center')

plt.subplot(1,2,2)
plt.stackplot(df.year,df.KY,df.OH,df.PA,labels=df.columns[1:])
plt.title('所有种类的堆积面积图(有多个Y)',fontfamily='SimHei')
plt.legend(loc='upper left',ncol=3)
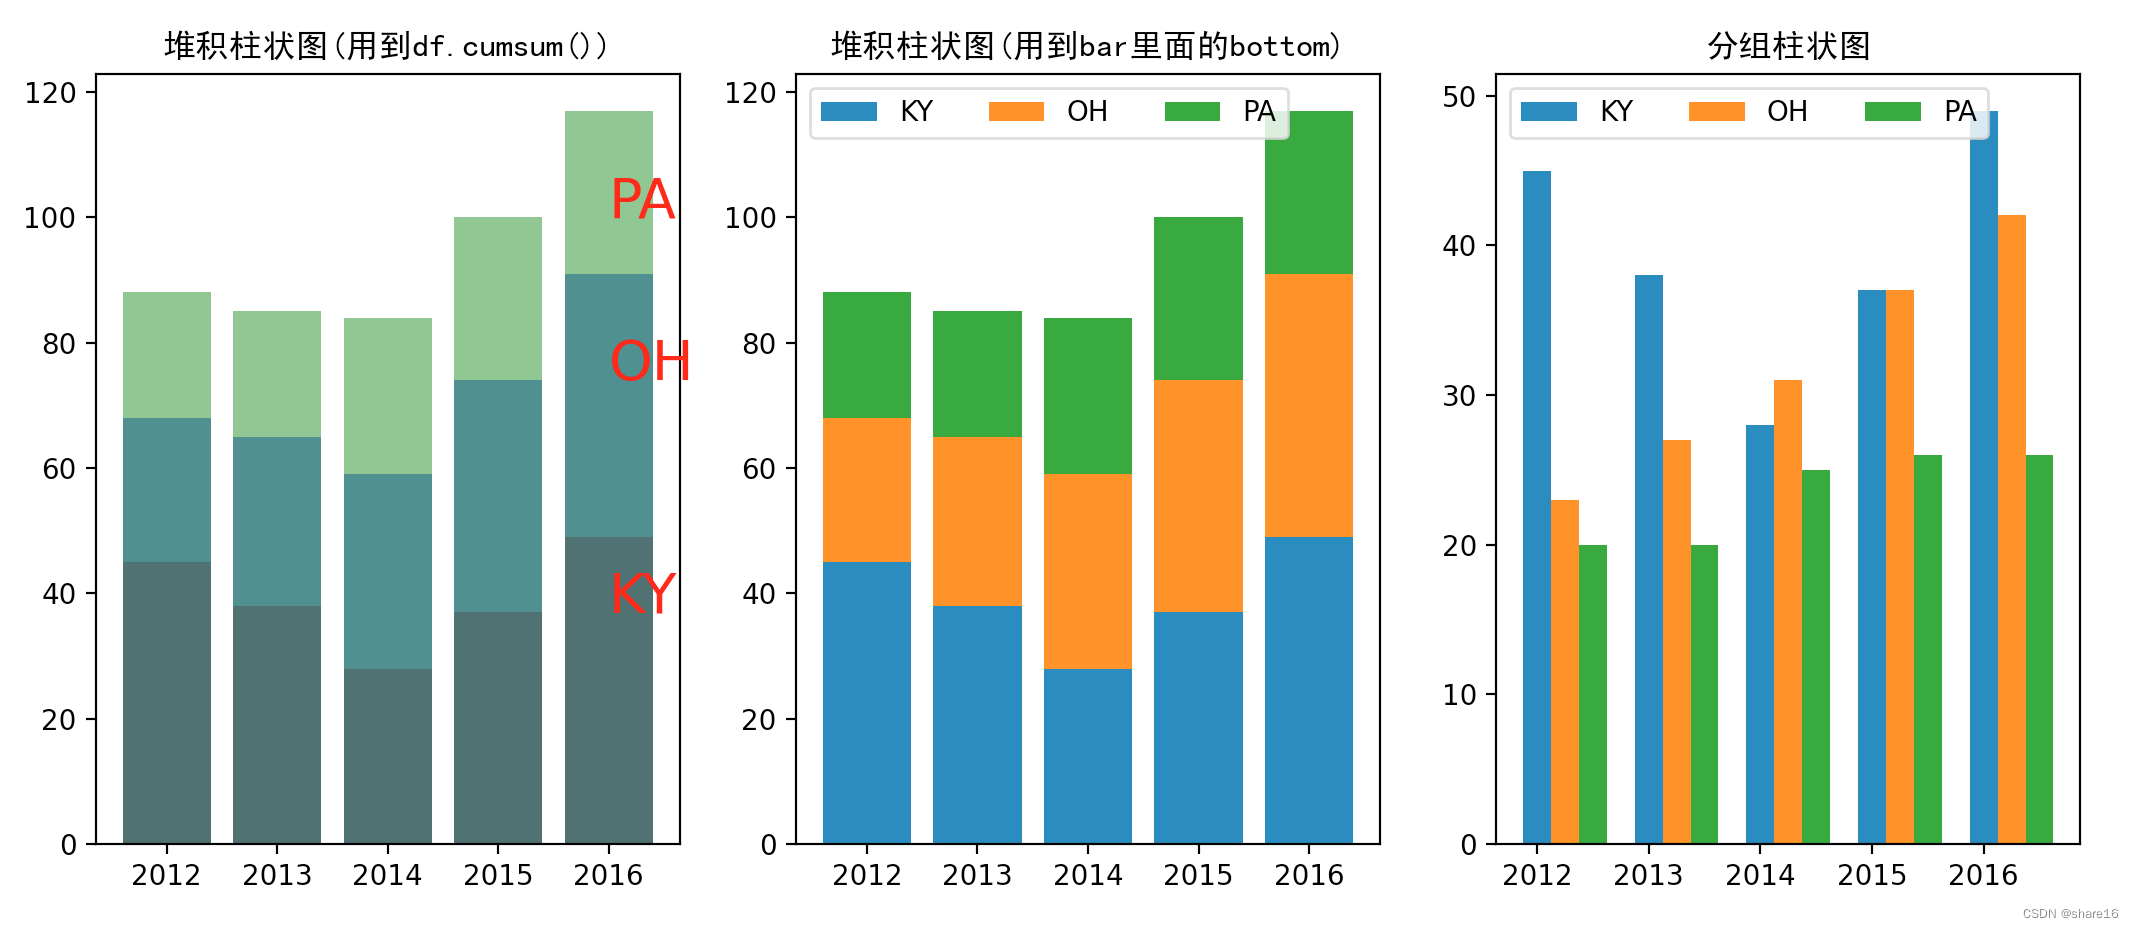
堆积柱状图 & 分组柱状图
import matplotlib.pyplot as plt
import pandas as pd
df = pd.DataFrame([[2012,45,23,20],[2013,38,27,20],[2014,28,31,25],[2015,37,37,26],[2016,49,42,26]],columns=['year','KY','OH','PA'])

plt.figure(figsize=(18,5))
plt.subplot(1,3,1)
df1 = df.set_index('year').T.cumsum()
ls = df1.index
color = ['r','b','g'] # 颜色种类等于len(ls)
for i in range(len(ls)):
    data = df1.loc[ls[i]]
    plt.bar(data.index,data.values,alpha=0.5,color=color[i],label=ls[i])
    plt.text(data.index[-1],data.values[-2],ls[i],color='r',size=20)
plt.title('堆积柱状图(用到df.cumsum())',fontfamily='SimHei')

plt.subplot(1,3,2)
df2 = df.set_index('year')
plt.bar(df2.index,df2.KY,label='KY')
plt.bar(df2.index,df2.OH,bottom=df2.KY,label='OH')
plt.bar(df2.index,df2.PA,bottom=(df2.KY+df2.OH),label='PA')
plt.title('堆积柱状图(用到bar里面的bottom)',fontfamily='SimHei')
plt.legend(loc='upper left',ncol=3)

plt.subplot(1,3,3)
df2 = df.set_index('year')
plt.bar(df2.index,df2.KY,width=0.25,label='KY')
plt.bar(df2.index+0.25,df2.OH,width=0.25,label='OH')
plt.bar(df2.index+0.50,df2.PA,width=0.25,label='PA')
plt.title('分组柱状图',fontfamily='SimHei')
plt.legend(loc='upper left',ncol=3)
5.2 展示分布关系
5.2.1 小提琴图(sns.violinplot)
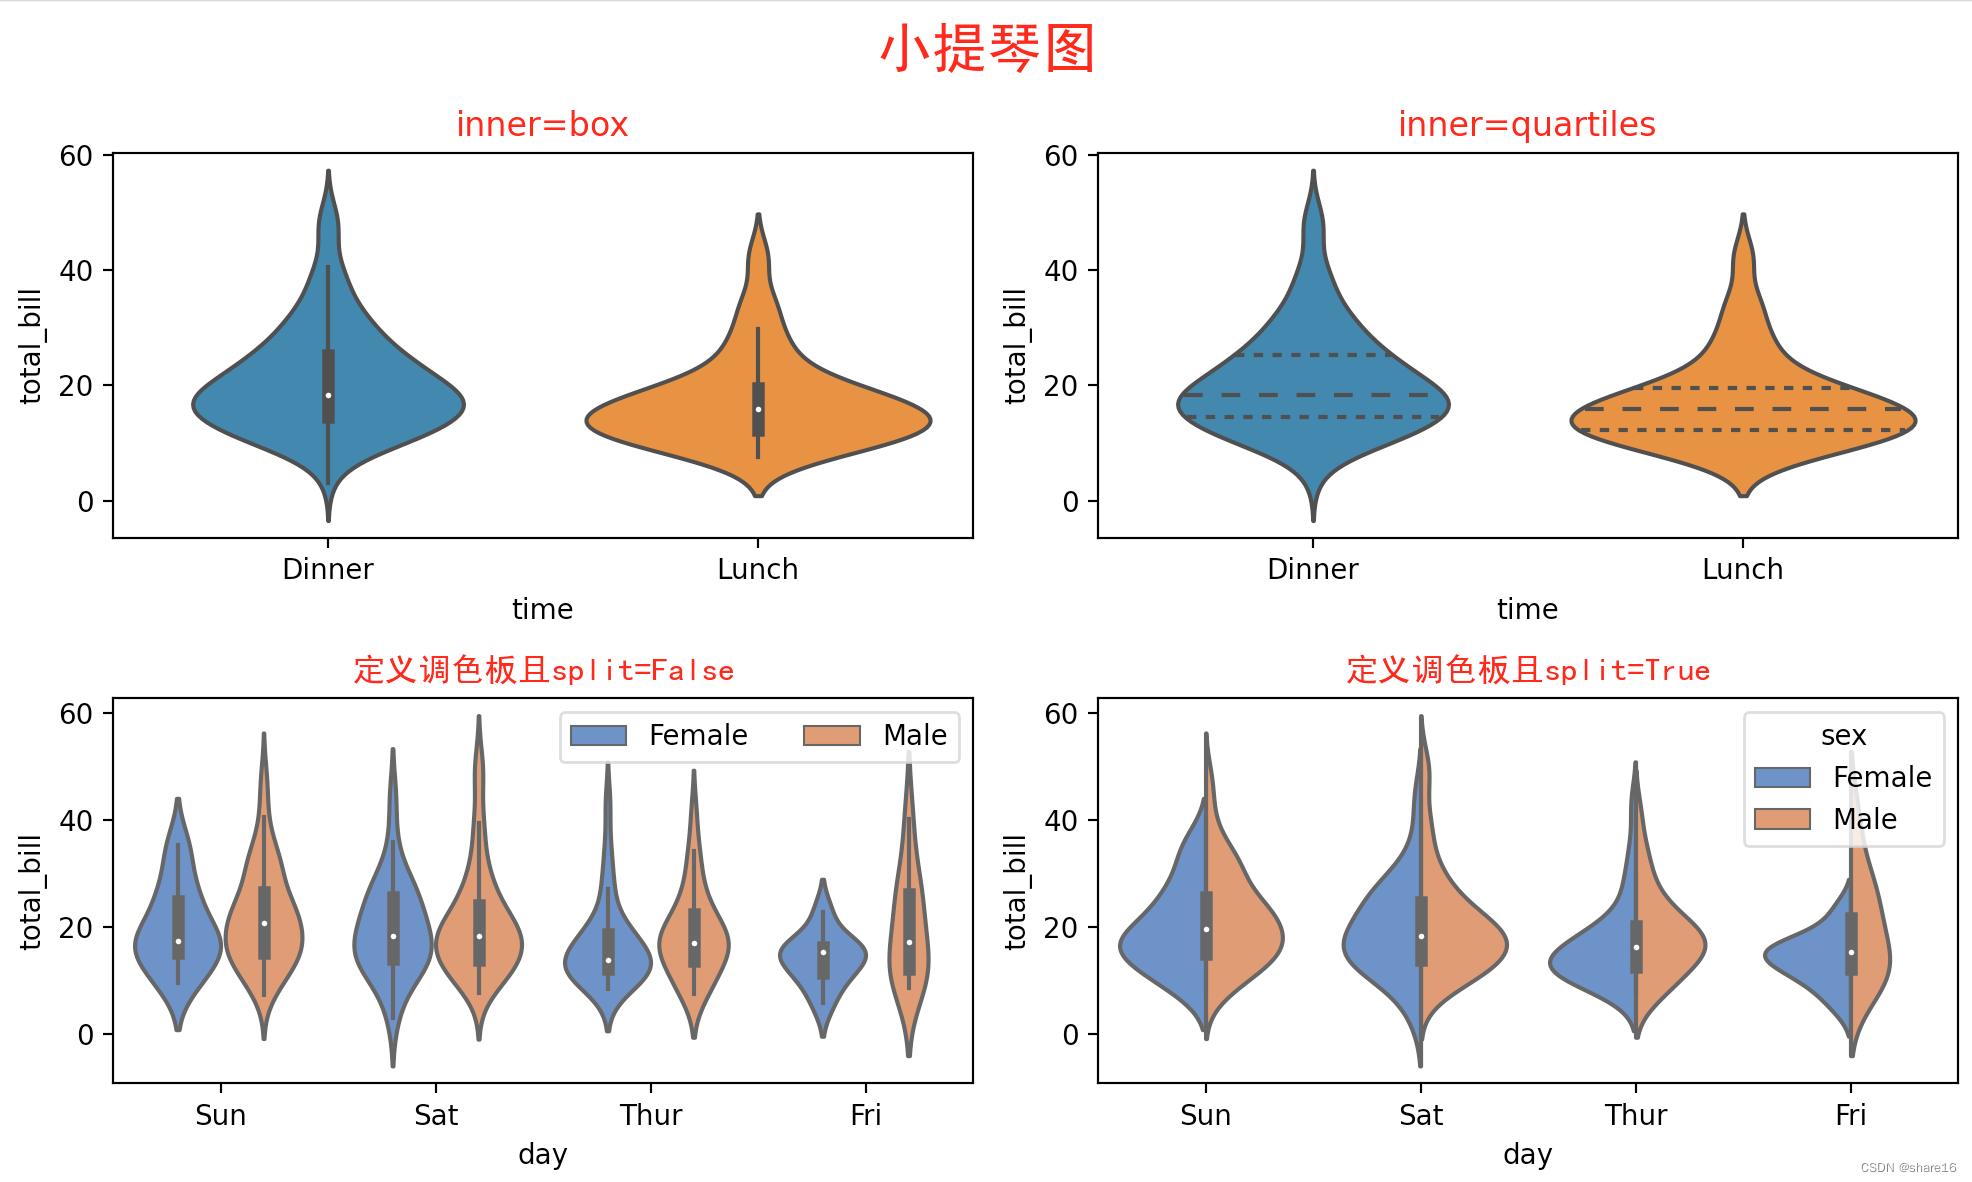
小提琴图是用来展示多组数据的分布状态以及概率密度,此图表结合了箱形图和密度图的特征;它显示了一个或多个分类变量多个属性上的定量数据的分布,从而可以比较这些分布。
与箱形图不同,其中所有绘图单元都与实际数据点对应,小提琴图描述了基础数据分布的核密度估计;可用seaborn.violinplot()方法实现。
seaborn.violinplot(x,y,hue,data,order,hue_order,bw,cut,scale,scale_hue,gridsize,width,inner,split,dodge,orient,linewidth,color,palette,saturation,ax)
- 不适合展示只有很少组别的数据,按照中位数排序能让数据看起来更直观;
- x/y/hue:dataframe的列或矢量数据; data:dataframe、数组或数组列表;
- order/hue_order:字符串列表,控制分类变量(对应的条形图)的绘制顺序,若缺失则从数据中推断分类变量的顺序;
- bw:默认scott,还可为silverman/float; cut:默认2; scale_hue:默认True;gridsize:默认100;width:默认0.8;
- scale:默认area,若为area,每张小提琴图具有相同的面积;若为count,小提琴的宽度会根据分箱中观察点的数量进行缩放;若为width,每张小提琴图具有相同的宽度;
- inner:默认box,若为box,则绘制一个微型箱型图;若为quartiles,则显示四分位数线;若为point或stick,则显示具体数据点或数据线;若为None,则绘制不加修饰的小提琴图;
- split:默认False,当使用带有两种颜色的变量且split值为True时,则会为每种颜色绘制对应半边小提琴;
- dodge:使用色调嵌套时,元素是否应沿分类轴移动;
- orient:{v,h},控制绘图的方向(垂直或水平); palette:调色板名称/列表/字典;
- saturation:默认0.75,用于控制颜色的原始饱和度比;
import matplotlib.pyplot as plt
import seaborn as sns
import pandas as pd
df = pd.read_csv('/xxx/10 tips.csv')

plt.figure(figsize=(10,6))
plt.suptitle('小提琴图',fontsize=20,fontfamily='SimHei',color='r')
plt.subplot(2,2,1)
sns.violinplot(x=df.time,y=df.total_bill)
plt.title('inner=box',color='r')

plt.subplot(2,2,2)
sns.violinplot(x=df.time,y=df.total_bill,inner='quartiles')
plt.title('inner=quartiles',color='r')

plt.subplot(2,2,3)
sns.violinplot(x=df.day,y=df.total_bill,hue=df.sex,palette="muted")
plt.title('定义调色板且split=False',color='r',fontfamily='SimHei')
plt.legend(ncol=3)

plt.subplot(2,2,4)
sns.violinplot(x=df.day,y=df.total_bill,hue=df.sex,palette="muted",split=True)
plt.title('定义调色板且split=True',color='r',fontfamily='SimHei')
plt.tight_layout()
5.2.2 箱形图(sns.boxplot或plt.boxplot)
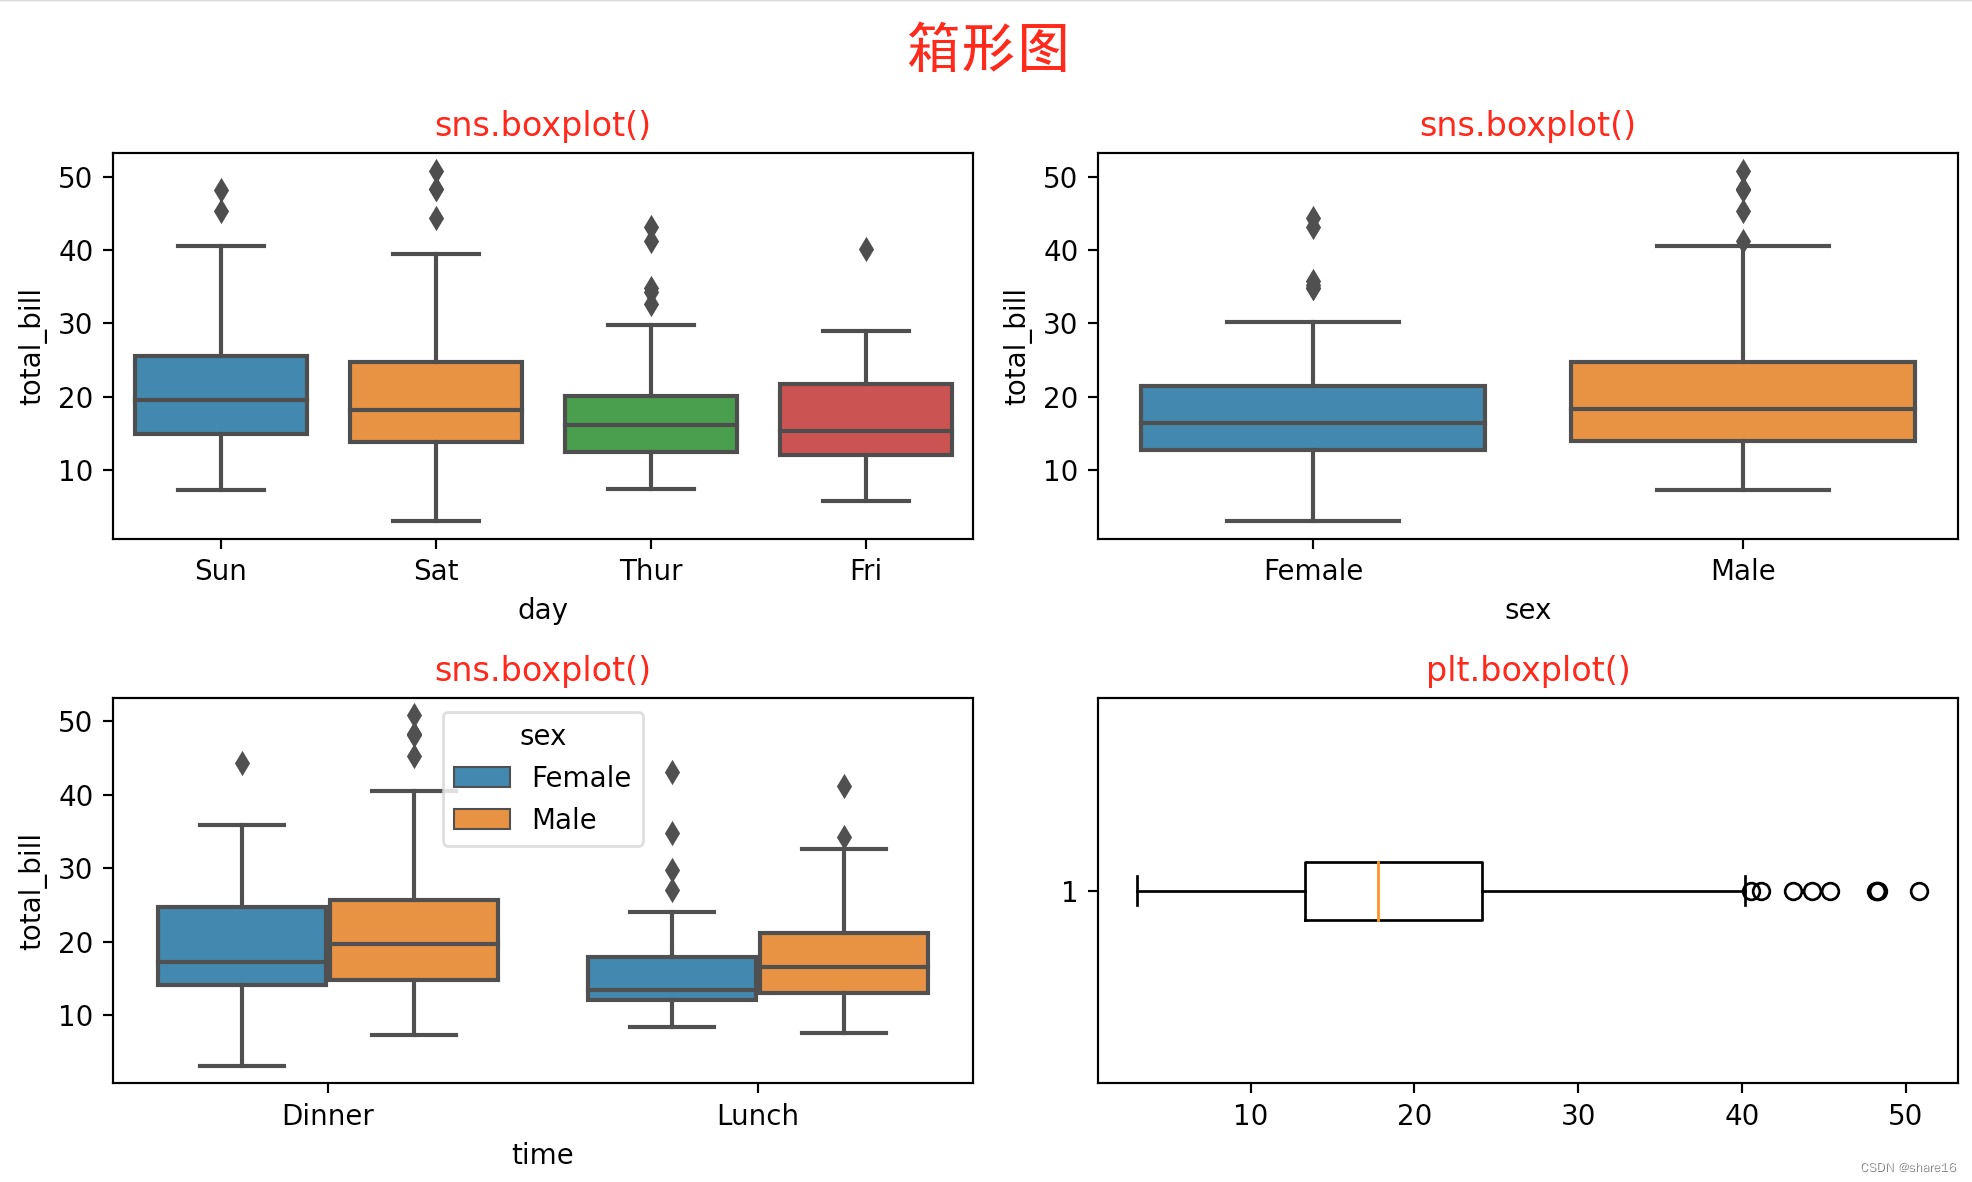
箱形图(或盒须图)以一种利于变量之间比较或不同分类变量层次之间比较的方式来展示定量数据的分布,可用seaborn.boxplot()方法实现。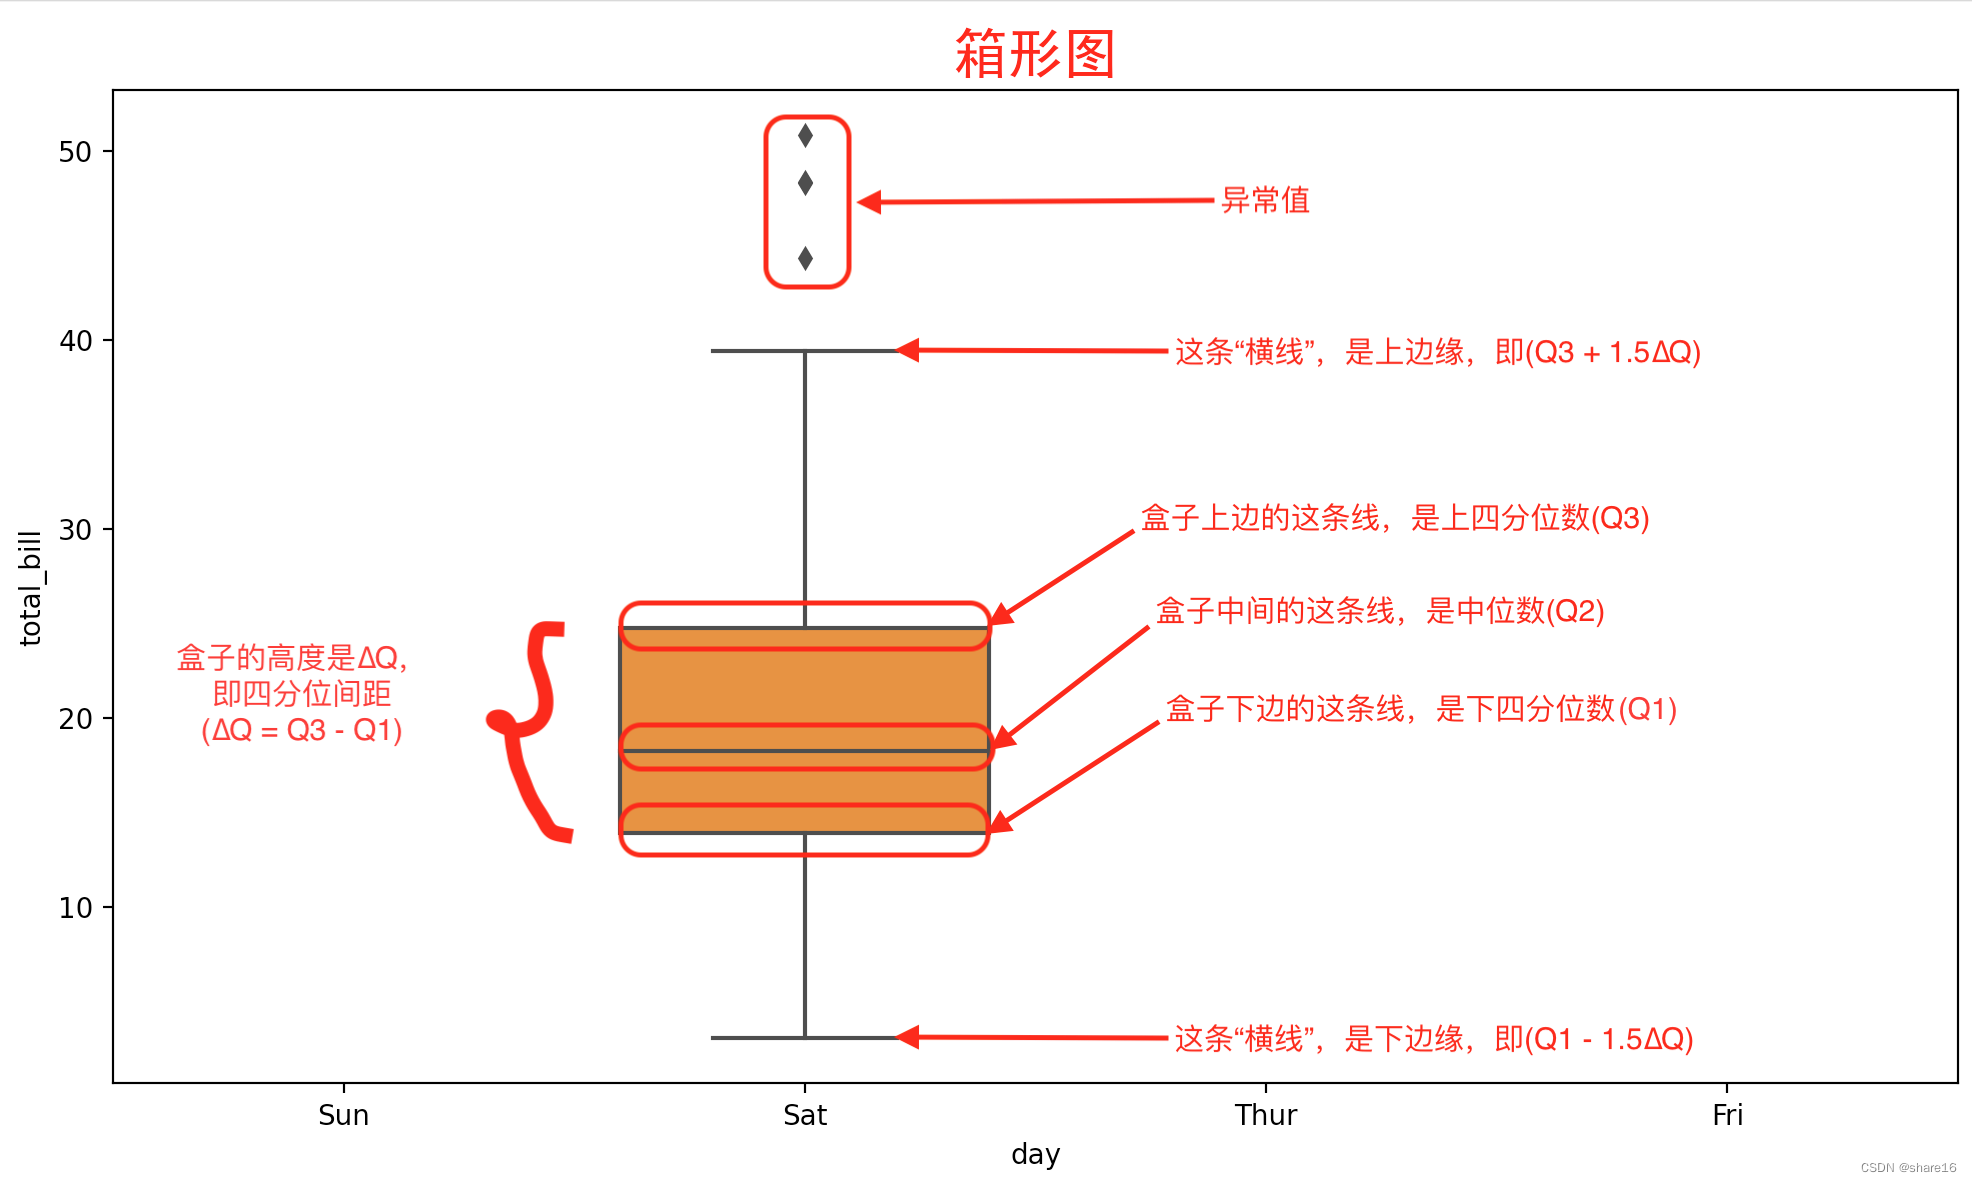
- 数据异常值:定义 小于下边缘(Q1-1.5∆Q) 或 大于上边缘(Q3+1.5∆Q) 的值为异常值;
- 偏态和尾重:箱型图揭示了数据分布偏态和尾重的部分信息,尽管不能给出偏态和尾重程度的精确度量,但可作为粗略估计的依据;
- 数据的形状:同一数轴上,几批数据的箱形图并行排列,几批数据的中位数、尾长、异常值、分布区间等形状信息便一目了然。在一批数据中,哪几个数据点出类拔萃,哪些数据点表现不及一般,这些数据点放在同类其它群体中处于什么位置,可以通过比较各箱形图的异常值看出;
- 箱型图隐藏了每个分组的数据量信息,可以通过标注或箱子宽度来展现;
- 箱型图隐藏了背后的分布信息,当数据量较少时,可用数据抖动(jitter);当数据量较大时,可用小提琴图来展现;
sns.boxplot(x,y,hue,data,order,hue_order,orient,color,palette,saturation,width,dodge,fliersize,linewidth,whis,ax)
import matplotlib.pyplot as plt
import seaborn as sns
import pandas as pd
df = pd.read_csv('/xxx/10 tips.csv')

plt.figure(figsize=(10,6))
plt.suptitle('箱形图',fontsize=20,fontfamily='SimHei',color='r')
plt.subplot(2,2,1)
sns.boxplot(x='day',y='total_bill',data=df)
plt.title('sns.boxplot()',color='r')

plt.subplot(2,2,2)
sns.boxplot(x=df.sex,y=df.total_bill)
plt.title('sns.boxplot()',color='r')

plt.subplot(2,2,3)
sns.boxplot(x=df.time,y=df.total_bill,hue=df.sex)
plt.title('sns.boxplot()',color='r')

plt.subplot(2,2,4)
plt.boxplot(x=df.total_bill,vert=False)
plt.title('plt.boxplot()',color='r')
plt.tight_layout()
5.2.3 直方图(sns.histplot或plt.hist)
直方图只能接收数值类型的变量数据,该变量被切割成几个箱子,每个箱子的高度代表分箱中的数量,可用seaborn.histplot()方法实现。
sns.histplot(x,y,data,hue,weights,stat,bins,binwidth,binrange,discrete,cumulative,common_bins,common_norm,multiple,element,fill,shrink,kde,kde_kws,line_kws,thresh,pthresh,pmax,cbar,cbar_ax,cbar_kws,palette,hue_order,hue_norm,color,log_scale,legend,ax)
- 要注意分箱数量的选择、不要用直方图展示超过5个变量的分布情况、避免使用彩色;
- weights:默认None,权重; stat:每个bin中的统计方式,默认count,还可取值为frequency(个数/箱宽度)、probability(标准化使条形高度总和为1)、percent(标准化使条形高度总和为100)、density(归一化使直方图的总面积为1);
- discrete:若为True,则binwidth=1并绘制条形图;cumulative:若为True,则绘制随着箱数增加的累积计数;multiple:默认layer,还可取值为dodge、stack、fill;
- element:直方图可视化的展现形式,默认bars,还可取值为step、poly; fill:填充,默认True; kde:若为True,计算密度曲线并在图上显示为一条或多条线;
import matplotlib.pyplot as plt
import seaborn as sns
import pandas as pd
df = pd.read_csv('/xxx/10 tips.csv')

plt.figure(figsize=(10,6))
plt.suptitle('直方图',fontsize=20,fontfamily='SimHei',color='r')
plt.subplot(2,2,1)
sns.histplot(x=df.total_bill,stat='count',bins=10)
plt.title('sns.histplot - stat=count',color='r')

plt.subplot(2,2,2)
sns.histplot(x=df.total_bill,stat='frequency',bins=10)
plt.title('sns.histplot - stat=frequency',color='r')

plt.subplot(2,2,3)
sns.histplot(x=df.total_bill,bins=10,kde=True)
plt.title('sns.histplot - kde=True',color='r')

plt.subplot(2,2,4)
plt.hist(x=df.total_bill,bins=10)
plt.title('plt.hist',color='r')
plt.tight_layout()
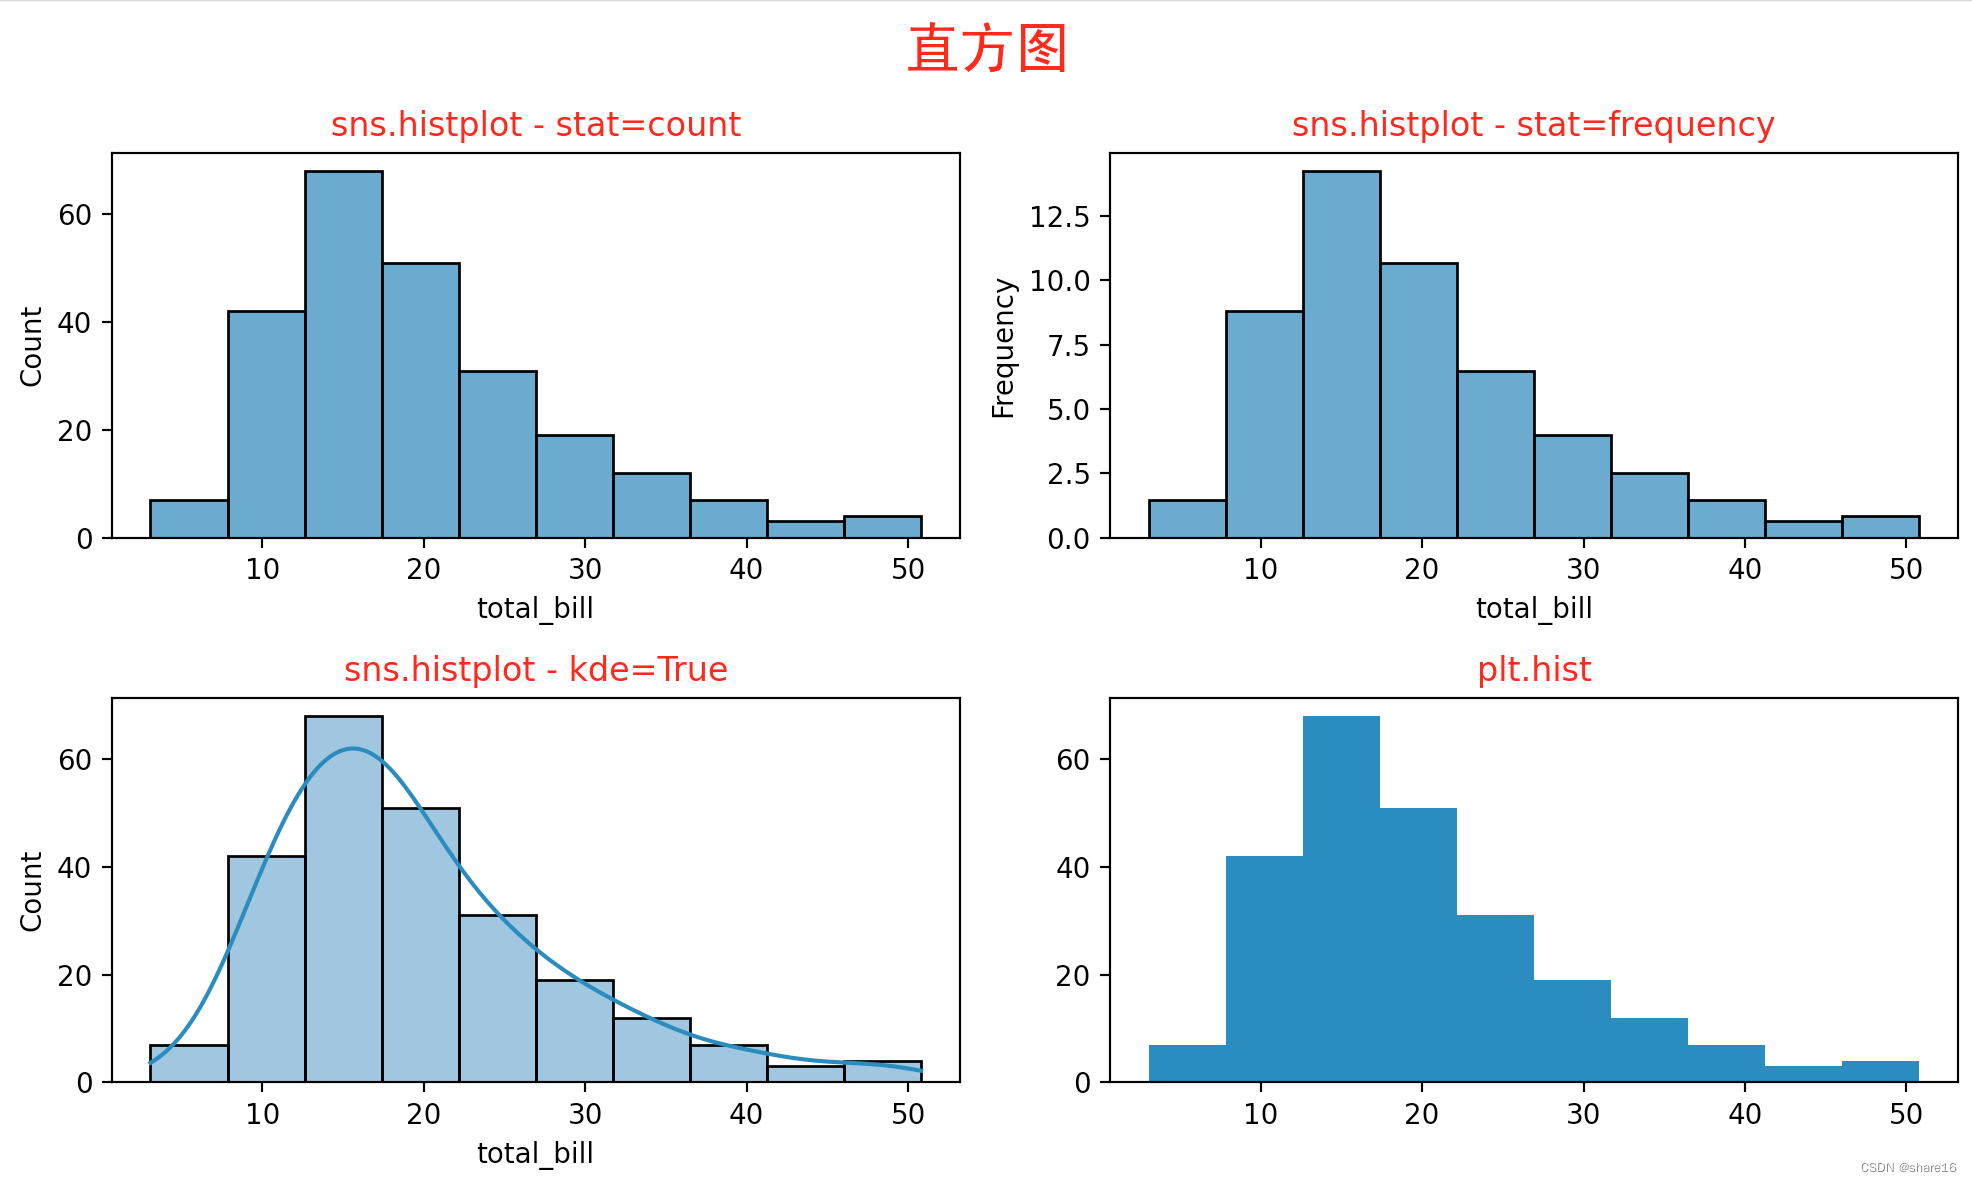
5.2.4 密度图(sns.kdeplot或sns.jointplot)
密度图和直方图很类似,同样是用来展示数值型变量的分布情况,可用seaborn.kdeplot()或sns.jointplot()方法实现。
sns.kdeplot(x,y,hue,shade,vertical,kernel,bw,gridsize,cut,clip,legend,cumulative,shade_lowest,cbar,cbar_ax,cbar_kws,ax,weights,palette,hue_order,hue_norm,multiple,common_norm,common_grid,levels,thresh,bw_method,bw_adjust,log_scale,fill,data,warn_singular)
sns.jointplot(x,y,hue,data,kind,height,ratio,space,dropna,xlim,ylim,marginal_ticks,joint_kws,marginal_kws,palette,hue_order,hue_norm)
- 注意密度函数的带宽、不要用直方图展示超过5个变量的分布情况、避免使用彩色;
- shade:若为True,则在kde曲线下面的区域中进行阴影处理,color控制曲线及阴影的颜色;
- vertical、kernel、bw:分别为垂直方向参数(默认False)、定义内核的函数、平滑参数;
- cbar:若为True,则会添加一个颜色棒(颜色帮在二元kde图像中才有);
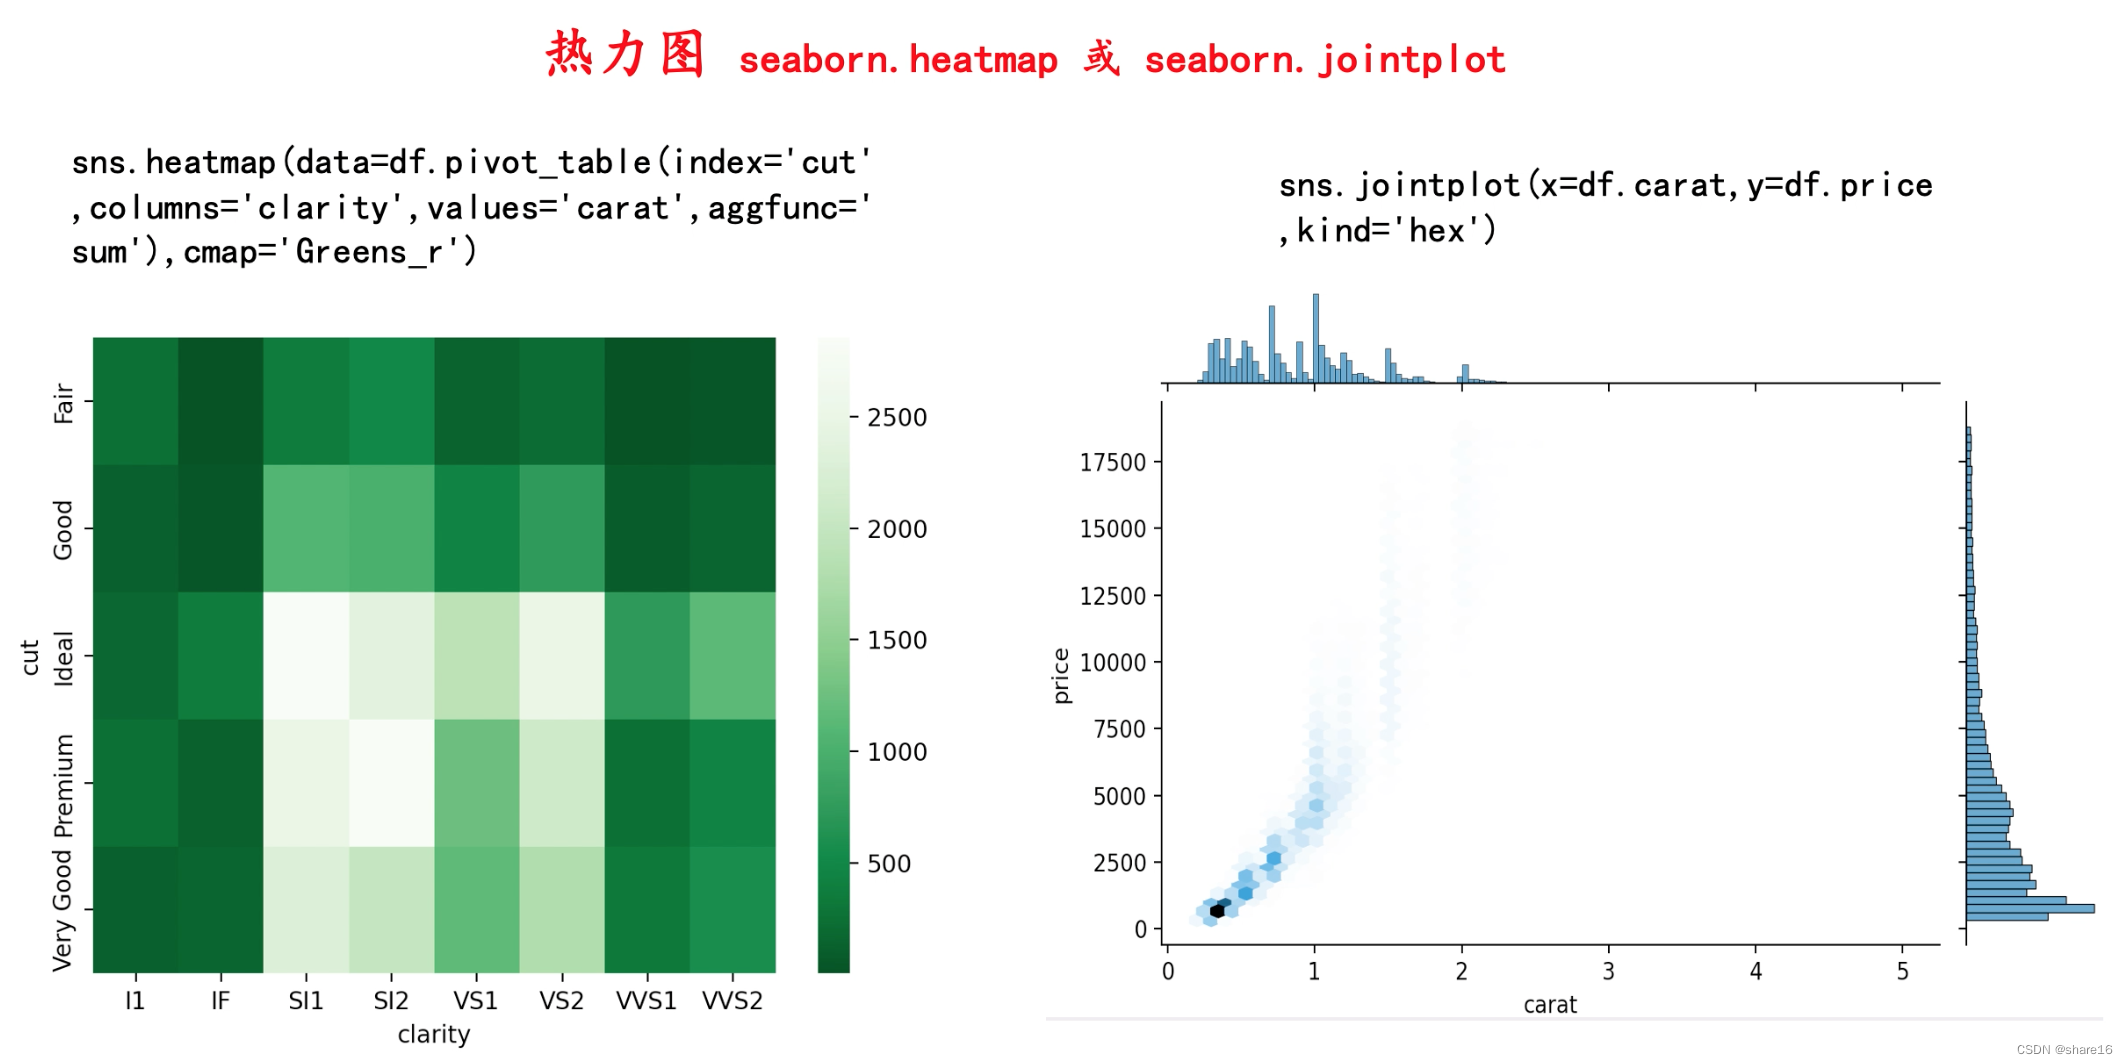
- kind:默认scatter,还可取值为kde、hist、hex(蜂窝热力图)、reg、resid,详见下图;
import matplotlib.pyplot as plt
import seaborn as sns
import pandas as pd
df = pd.read_csv('/xxx/10 tips.csv')

plt.figure(figsize=(18,5))
plt.suptitle('密度图',fontsize=20,fontfamily='SimHei',color='r')
plt.subplot(1,3,1)
sns.kdeplot(x=df.total_bill,label='bw:default')
sns.kdeplot(x=df.total_bill,bw_method=2,label='bw:2')
sns.kdeplot(x=df.total_bill,bw_method=0.5,label='bw:0.5')
plt.legend()
plt.title('sns.kdeplot',color='r')

plt.subplot(1,3,2)
sns.kdeplot(x=df.total_bill,shade=True,color='skyblue')
plt.title('sns.kdeplot - shade&color',color='r')

plt.subplot(1,3,3)
sns.kdeplot(x=df.total_bill,y=df.tip,shade=True,cbar=True)
plt.title('sns.kdeplot - shade&cbar',color='r')

plt.tight_layout()
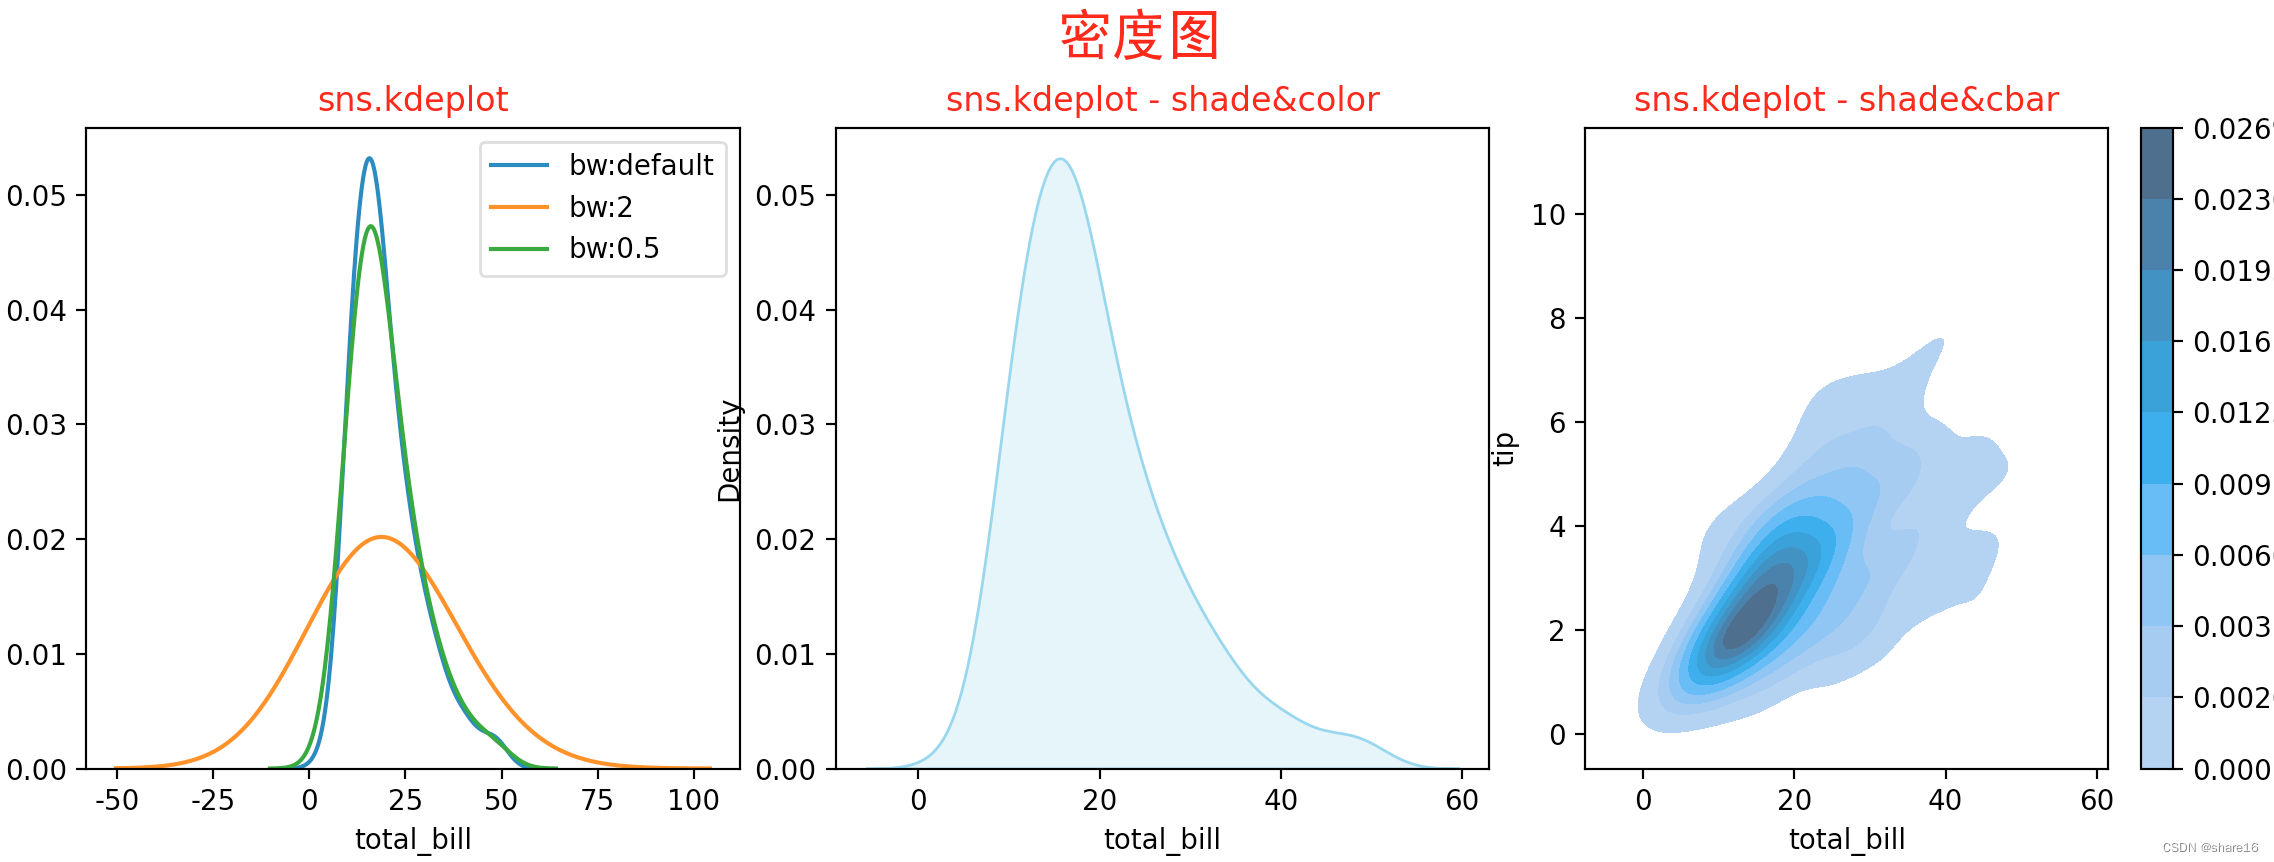
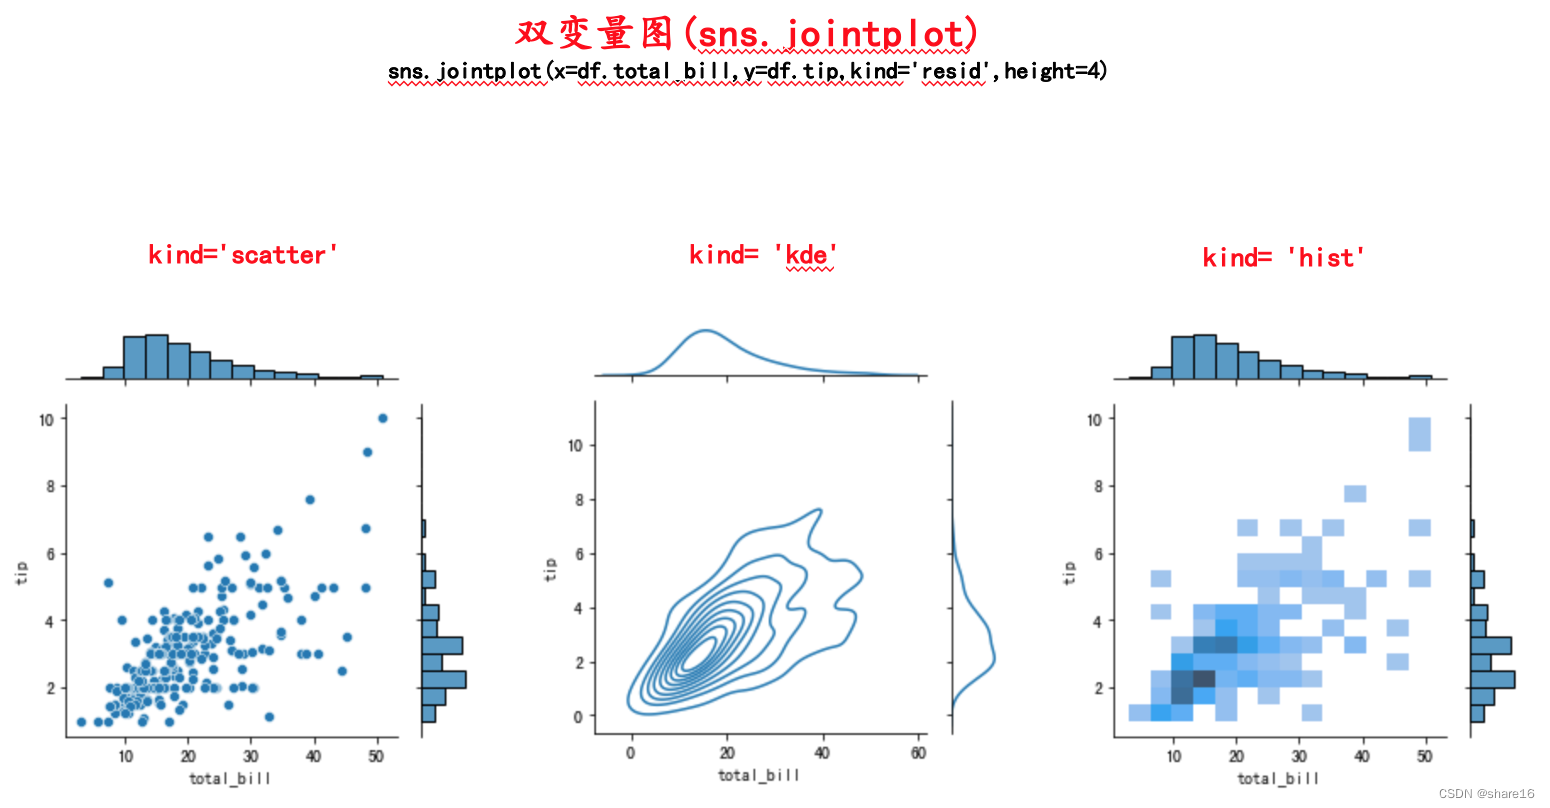
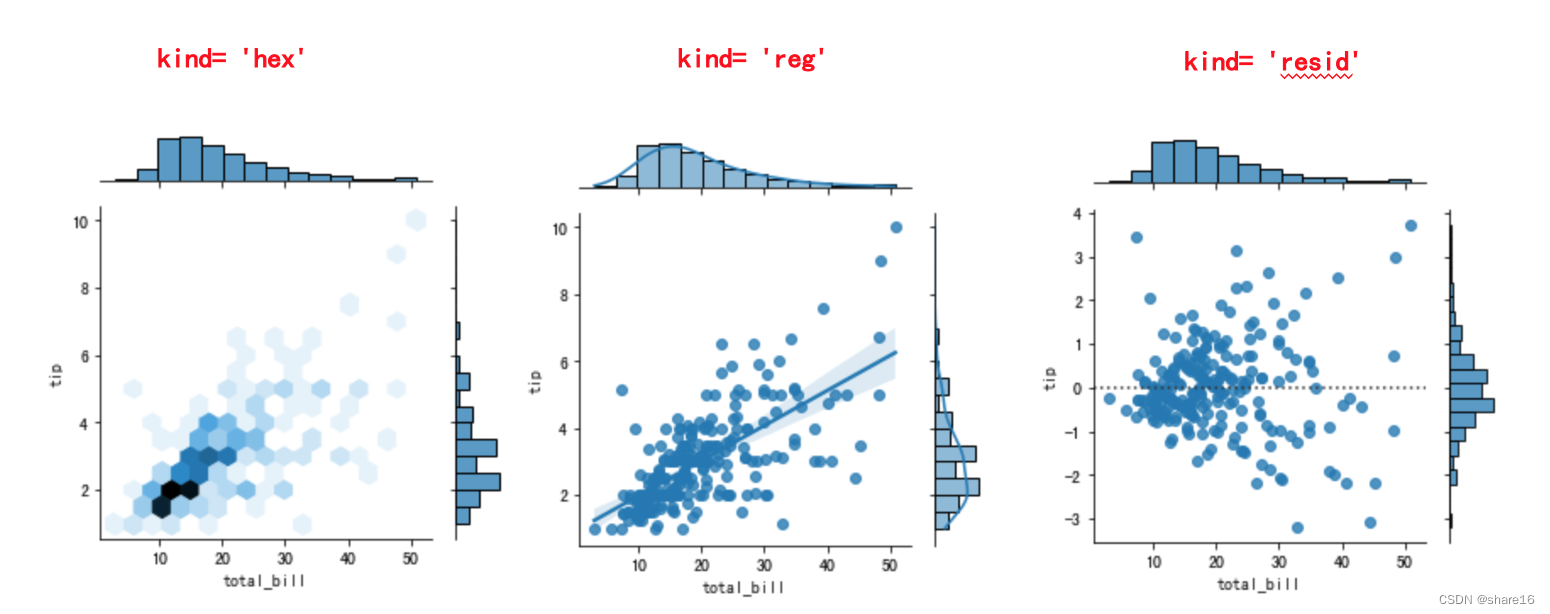
5.3 展示相关关系
5.3.1 散点图(plt.scatter或sns.lmplot)
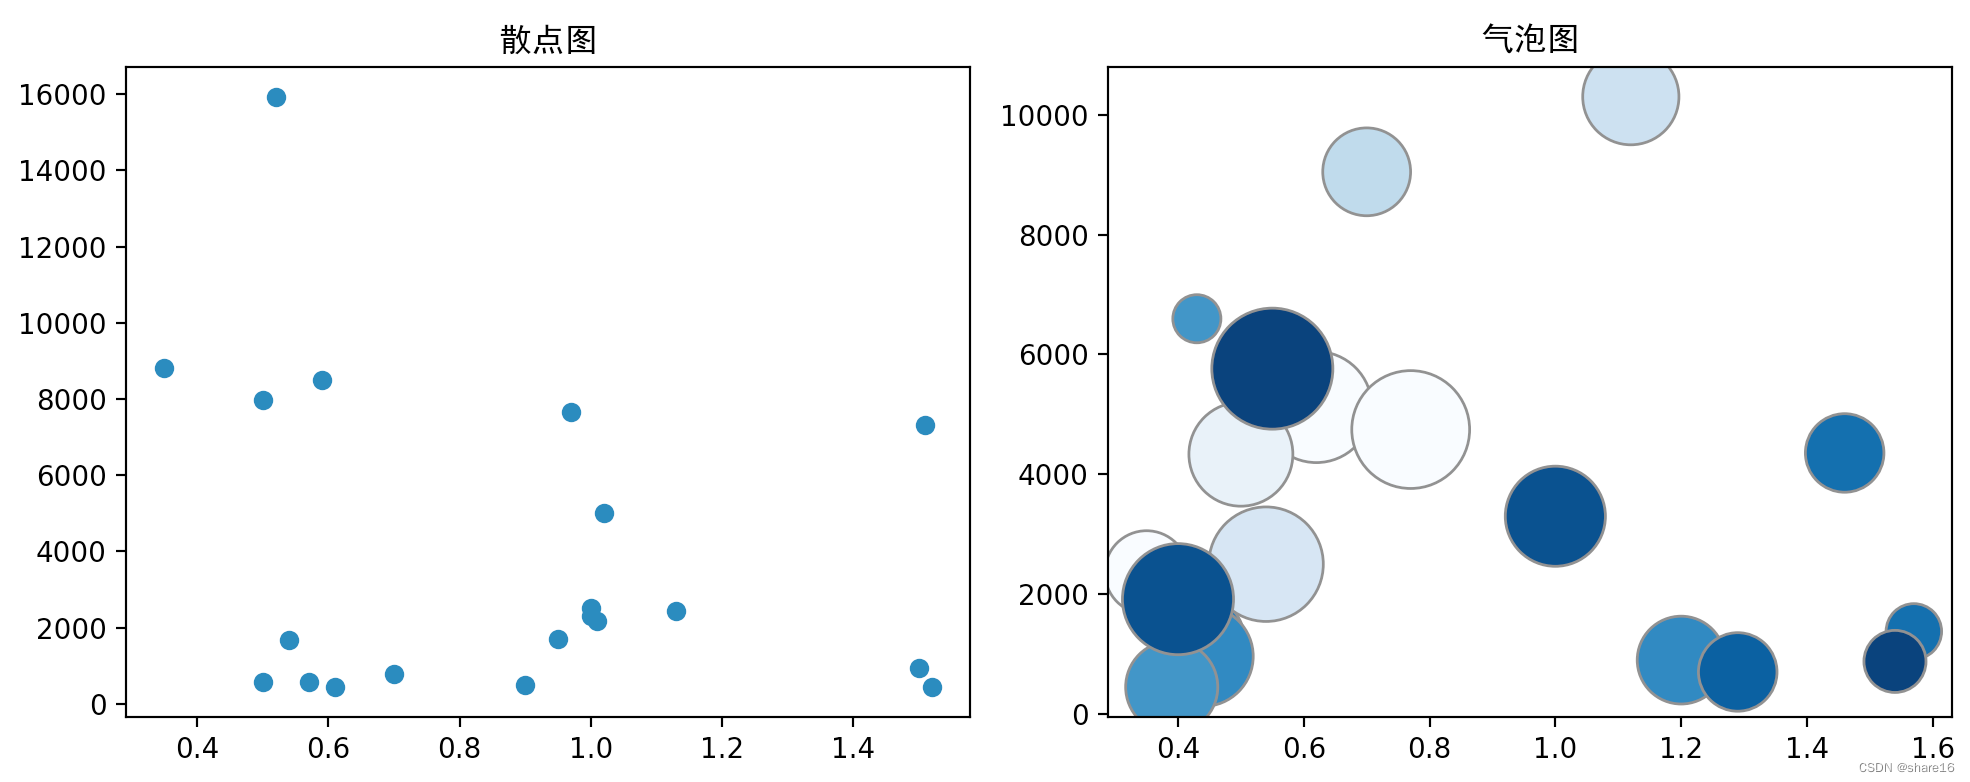
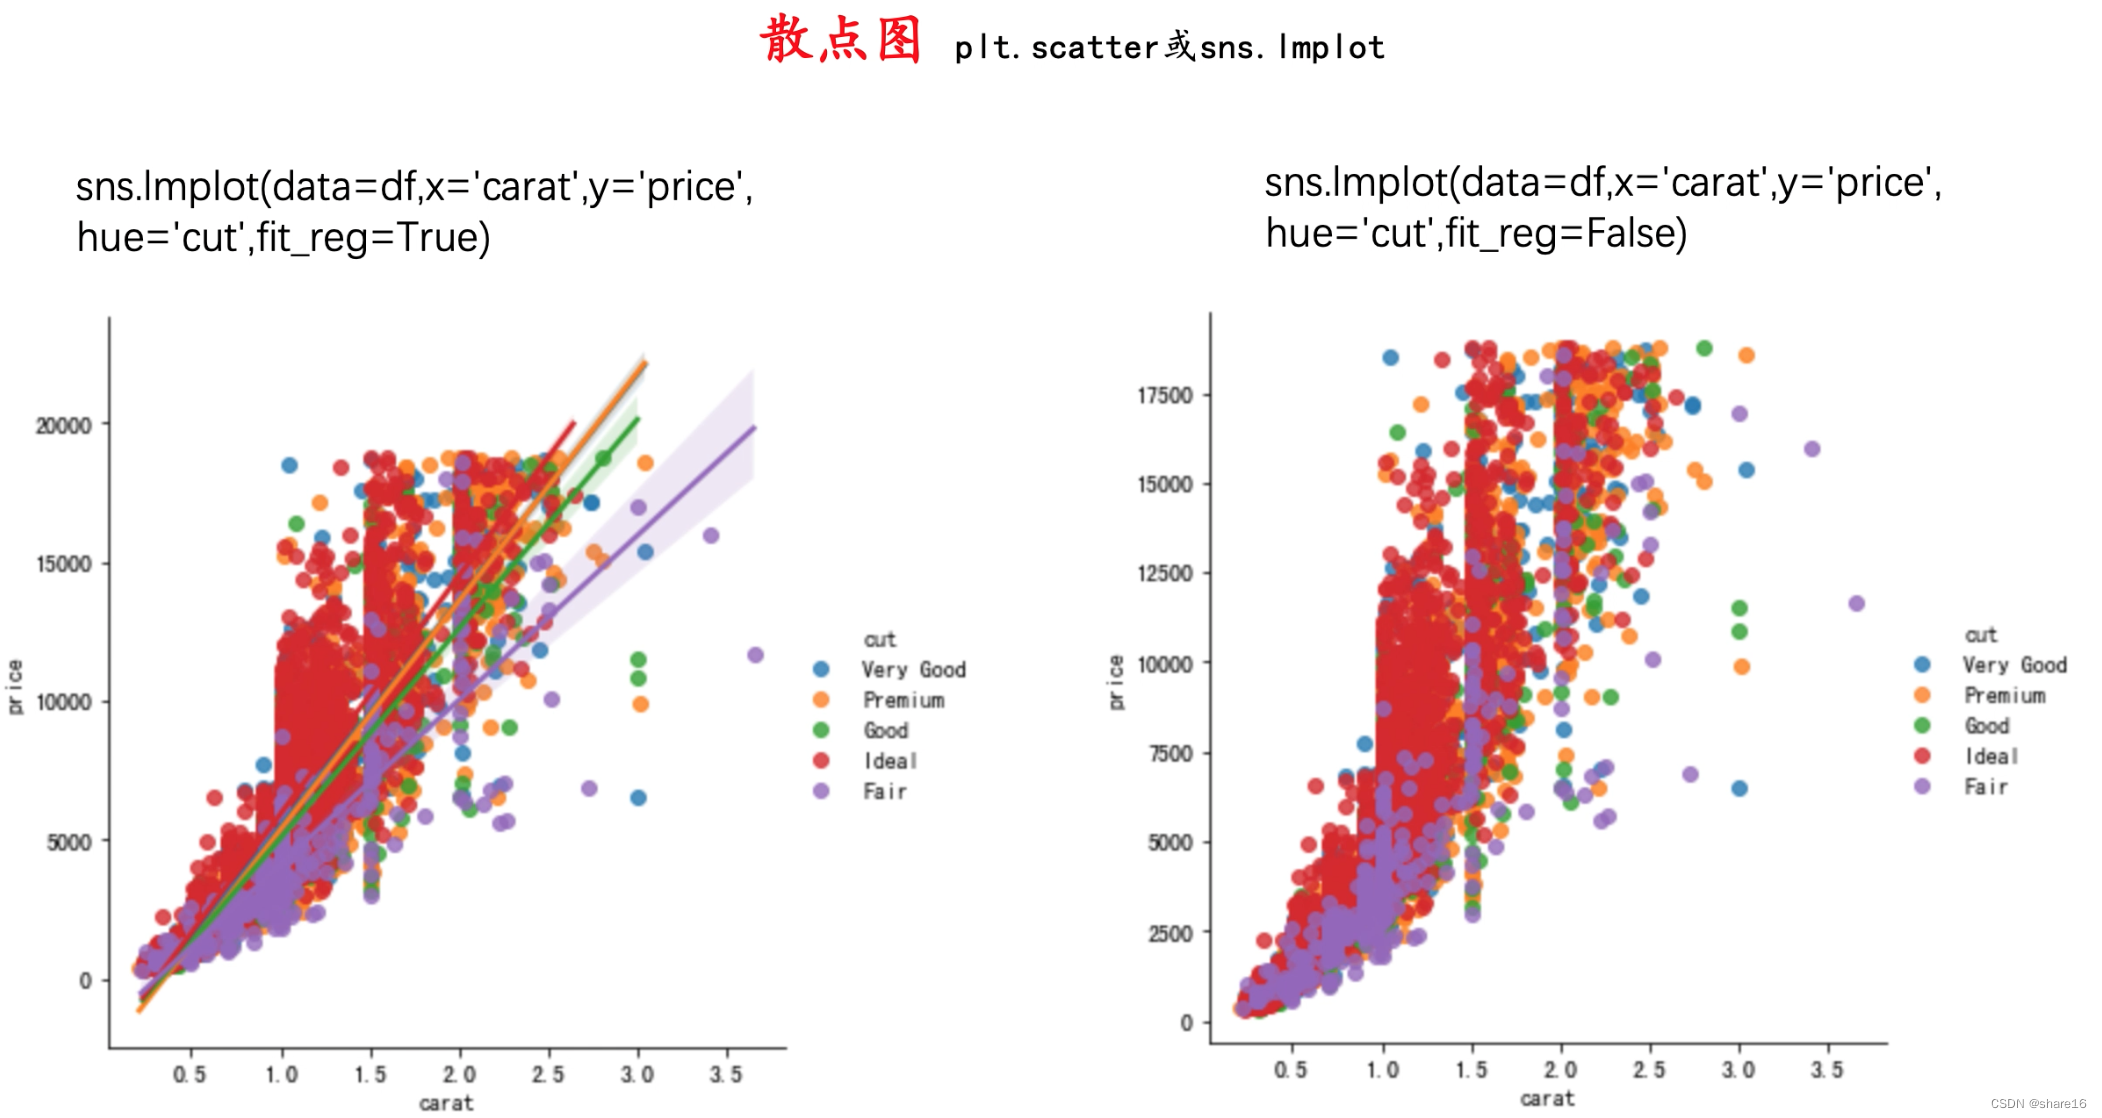
散点图常用于查看数值型变量之间的相关性,同时可利用不同颜色来区分样本所属的类别,可用plt.scatter()或seaborn.lmplot()方法实现。
plt.scatter(x,y,s,c,marker,cmap,norm,vmin,vmax,alpha,linewidths,edgecolors,plotnonfinite,data,**kwargs)
sns.lmplot(x,y,data,hue,palette,markers,sharex, sharey,···)
- 绘制散点图时,要避免Overplotting,意思是由于散点数量过多导致图中的样例点过度重合;为了避免overplotting,可以通过抽样来作图、可以用热力图代替、调节样本点的size;
- x/y:x/y轴上的数据; s/c:标记的大小/颜色,用来绘制气泡图;
- marker:标记的类型,如实心圆、点、上三角等;
- cmap:默认 None,标量或一个colormap的名字,只有c是一个浮点数数组的时才使用;如果没有申明就是image.cmap;
- norm:默认 None,数据亮度在 0-1 之间,只有c是一个浮点数的数组的时才使用;
- vmin/vmax:亮度设置,在norm参数存在时会忽略;
import matplotlib.pyplot as plt
import seaborn as sns
import pandas as pd
import numpy as np
df = pd.read_csv('/xxx/11 diamonds.csv')
new_feature1 = np.random.randint(0,20,20) # 用气泡大小显示该feature大小
new_feature2 = np.random.randint(0,20,20) # 用气泡深浅显示该feature大小

plt.figure(figsize=(10,4))
plt.subplot(1,2,1)
plt.scatter(x=df.carat.sample(20),y=df.price.sample(20))
plt.title('散点图',fontfamily='SimHei')

plt.subplot(1,2,2)
plt.scatter(x=df.carat.sample(20),y=df.price.sample(20),s=new_feature1*100,c=new_feature2,cmap="Blues",edgecolors="grey")
plt.title('气泡图',fontfamily='SimHei')
plt.tight_layout()
5.3.2 热力图(sns.heatmap或sns.jointplot)
密度图对于一组数值变量,可理解为先对其进行二维分箱,再分别统计每个箱子的对应指标;对于分类变量而言,箱子一般可指定为对应的类别。但通常,热力图更多用来表示数值变量的总体信息,可用seaborn.heatmap()或seaborn.jointplot()方法实现。
seaborn.heatmap(data,vmin,vmax,cmap,center,robust,annot,fmt,annot_kws,linewidths,linecolor,cbar,cbar_kws,cbar_ax,square,xticklabels,yticklabels,mask,ax)
- data:若是数组,其必须是二维的(ndarray.ndim=2);若是DataFrame,df的index/column分别是heatmap的columns和rows,一般会用pivot_table加工一下;
- cmap:颜色,取值为:Accent、Accent_r、hot、hot_r、binary、rainbow、Set1、Set2等;
- cbar:是否画一个颜色条,默认True;
5.4 展示排序信息
5.4.1 柱状图(plt.bar或sns.barplot)
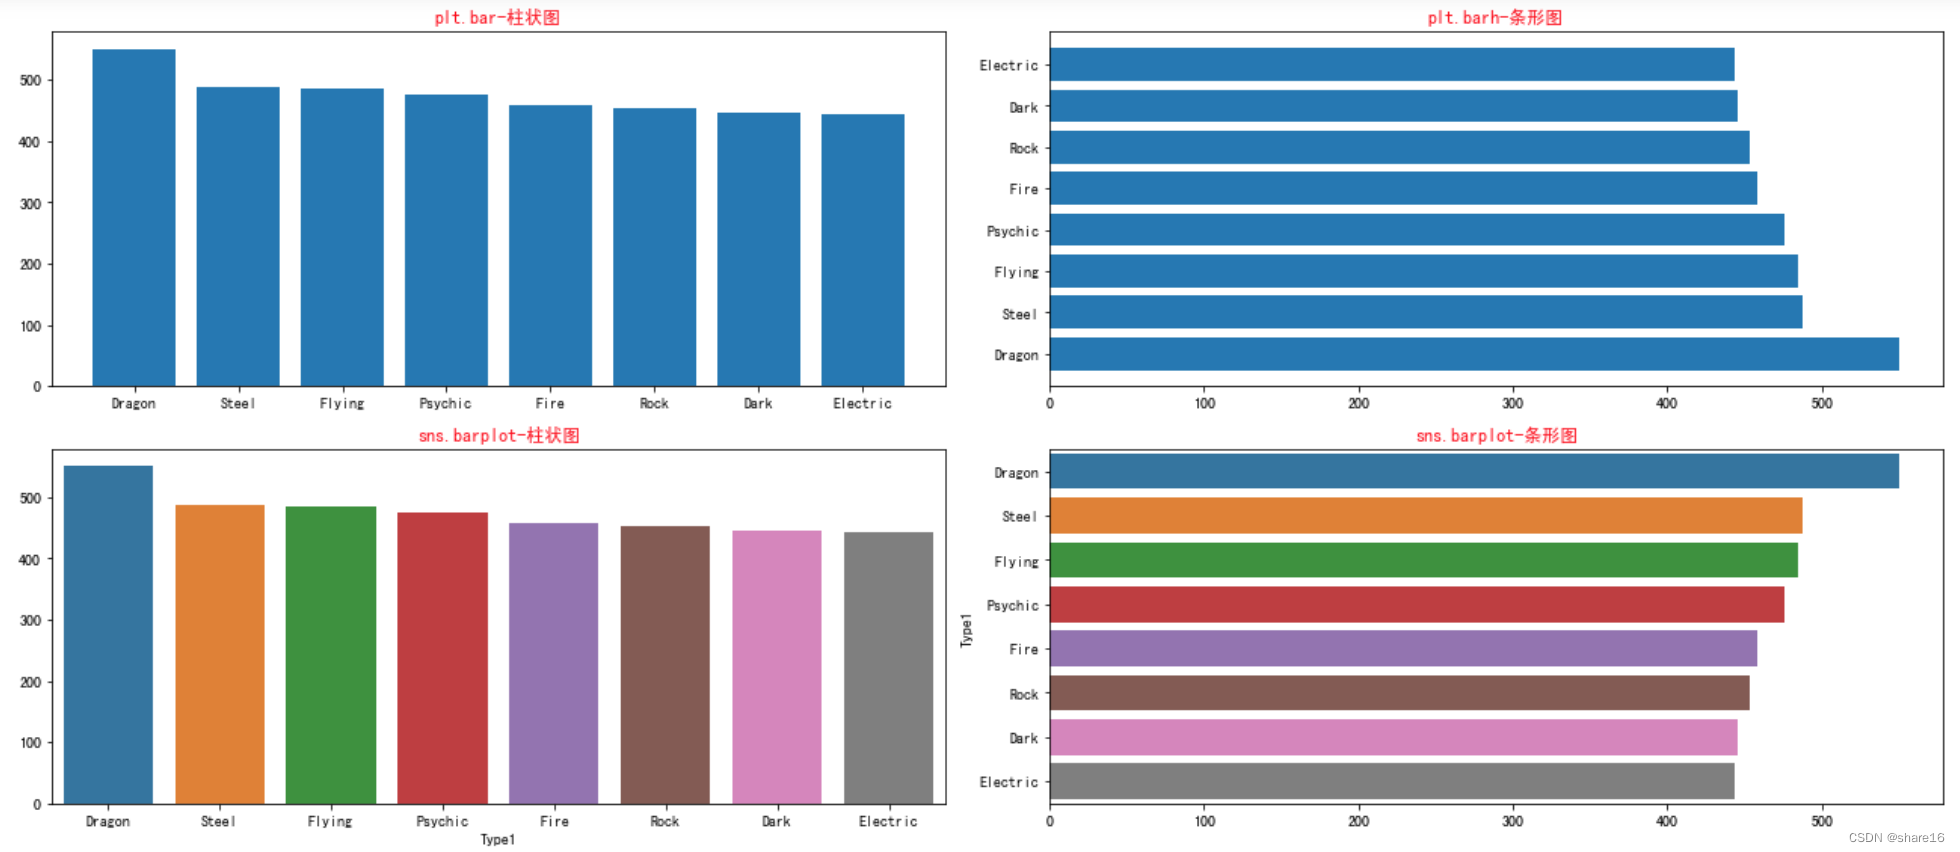
柱状图是用来展示一个类别变量和一个数值变量之间的关系,每个柱子代表一个类别,柱子的长度代表这个类别的数值;可用plt.bar()或plt.barh()方法实现。
注意:不要和直方图混淆;当类别标签较长时,可用横向柱状图;给柱子排序,更有利于展示信息;
import matplotlib.pyplot as plt
import seaborn as sns
import pandas as pd
df = pd.read_csv('/xxx/01 口袋妖怪.csv',encoding='Windows-1252')
a = df.groupby('Type1').Total.mean().sort_values(ascending=False)[:8]

plt.figure(figsize=(18,8))
plt.subplot(2,2,1)
plt.bar(x=a.index,height=a.values)
plt.title('plt.bar-柱状图',color='r')

plt.subplot(2,2,2)
plt.barh(y=a.index,width=a.values)
plt.title('plt.barh-条形图',color='r',)

plt.subplot(2,2,3)
sns.barplot(x=a.index,y=a.values)
plt.title('sns.barplot-柱状图',color='r')

plt.subplot(2,2,4)
sns.barplot(y=a.index,x=a.values)
plt.title('sns.barplot-条形图',color='r',)
plt.tight_layout()
5.4.2 雷达图(plt.polar)
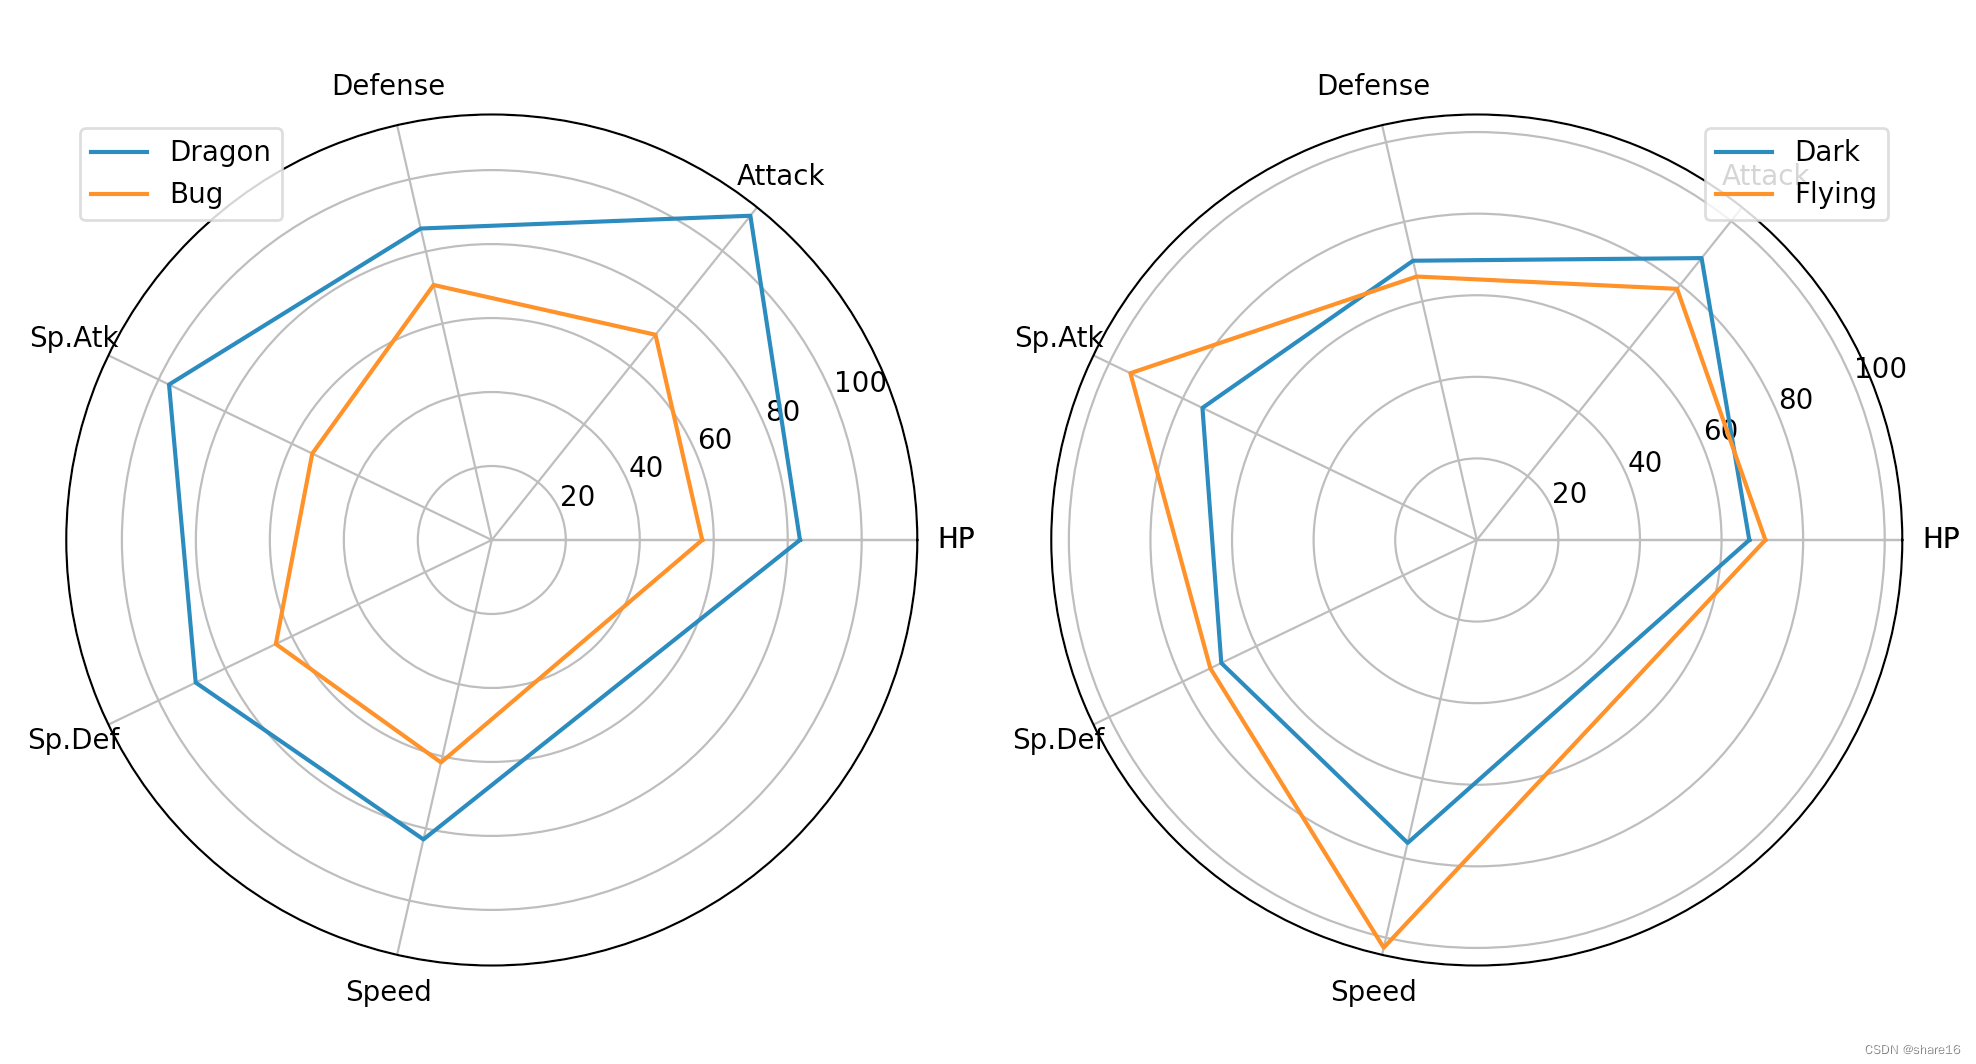
雷达图是一种展示多个定量变量的二维图表,所有变量交汇在中心同一点,由于使用限制较多,在可视化中一般较少用到。可用plt.polar()方法实现。 注意:不要在一张图显示超过5个组别;当不同组别标度差别很大时,谨慎使用雷达图;
import matplotlib.pyplot as plt
import pandas as pd
from math import pi
df = pd.read_csv('/xxx/01 口袋妖怪.csv',encoding='Windows-1252')
a = df.groupby('Type1').agg('mean').drop(columns=['#','Total'])
cols = ['HP','Attack','Defense','Sp.Atk','Sp.Def','Speed','HP']
theta = [2*pi*(list(a.columns).index(i))/len(cols) for i in cols]
angle = [i*180/pi for i in theta]

plt.figure(figsize=(10,6))
plt.subplot(1,2,1,projection='polar')
plt.plot(theta,a.loc['Dragon',cols],label='Dragon')
plt.plot(theta,a.loc['Bug',cols],label='Bug')
plt.thetagrids(angle,cols)
plt.legend()

plt.subplot(1,2,2,projection='polar')
plt.polar(theta,a.loc['Dark',cols],label='Dark')
plt.polar(theta,a.loc['Flying',cols],label='Flying')
plt.thetagrids(angle,cols)
plt.legend()

plt.tight_layout()
5.4.3 其他的图(平行坐标图/棒棒糖图/圆形柱状图)
平行坐标图用来比较样本在一组数值型变量上的特征,它是雷达图的另一种表现形式,在可视化中更推荐被使用;可用parallel_coordinates()方法实现(from pandas.plotting import parallel_coordinates)。注意:不适合用于组别过多的情况;可在X轴对数据排序,避免曲线之间的交叉;
棒棒糖图本质上是柱状图的另一种表现形式,区别是把柱子用线和点来代替,但是从视觉上表现效果更好。可以使用pyplot.hlines()方法来展示棒棒糖图。注意:排序会使得显示效果更好;如果因为某种原因不能保持排序状态,那么宁愿选择柱状图;
圆形柱状图相比于柱状图更吸引眼球,但同时也更难识别出柱子尺寸的差别,因此只有当你有大量类别需要展示,并且有一些明显突出的类别时才会使用。
import matplotlib.pyplot as plt
import pandas as pd
from pandas.plotting import parallel_coordinates
from math import pi
df = pd.read_csv('/xxx/01 口袋妖怪.csv',encoding='Windows-1252')
a = df.groupby('Type1').agg('mean').drop(columns=['#','Total']).reset_index()
b = a[['Type1','HP']].sort_values('HP',ignore_index=True)

plt.figure(figsize=(18,4))
plt.subplot(1,3,1)
parallel_coordinates(frame=a.sample(5),class_column='Type1')
plt.title('平行坐标图',fontfamily='SimHei',color='r')

plt.subplot(1,3,2)
plt.hlines(data=b,y='Type1',xmin=0,xmax='HP') # 画棒棒糖的糖棍儿
plt.plot(b.HP,range(len(b)),'o')  # 画棒棒糖的糖球
plt.title('棒棒糖图',fontfamily='SimHei',color='r')

plt.subplot(1,3,3,polar=True)
theta = [2*pi*i/len(b) for i in range(len(b))]
width = 2*pi/len(b)-0.02
fig = plt.bar(theta, b.HP, width=width, bottom=50)
for i,j in zip(fig.patches,b.Type1):
    plt.text(i.get_xy()[0]+0.1,i.get_height()+60,s=j)
plt.axis('off')
plt.title('圆形柱状图',fontfamily='SimHei',color='r')

5.5 展示组成关系
5.5.1 饼图(plt.pie)
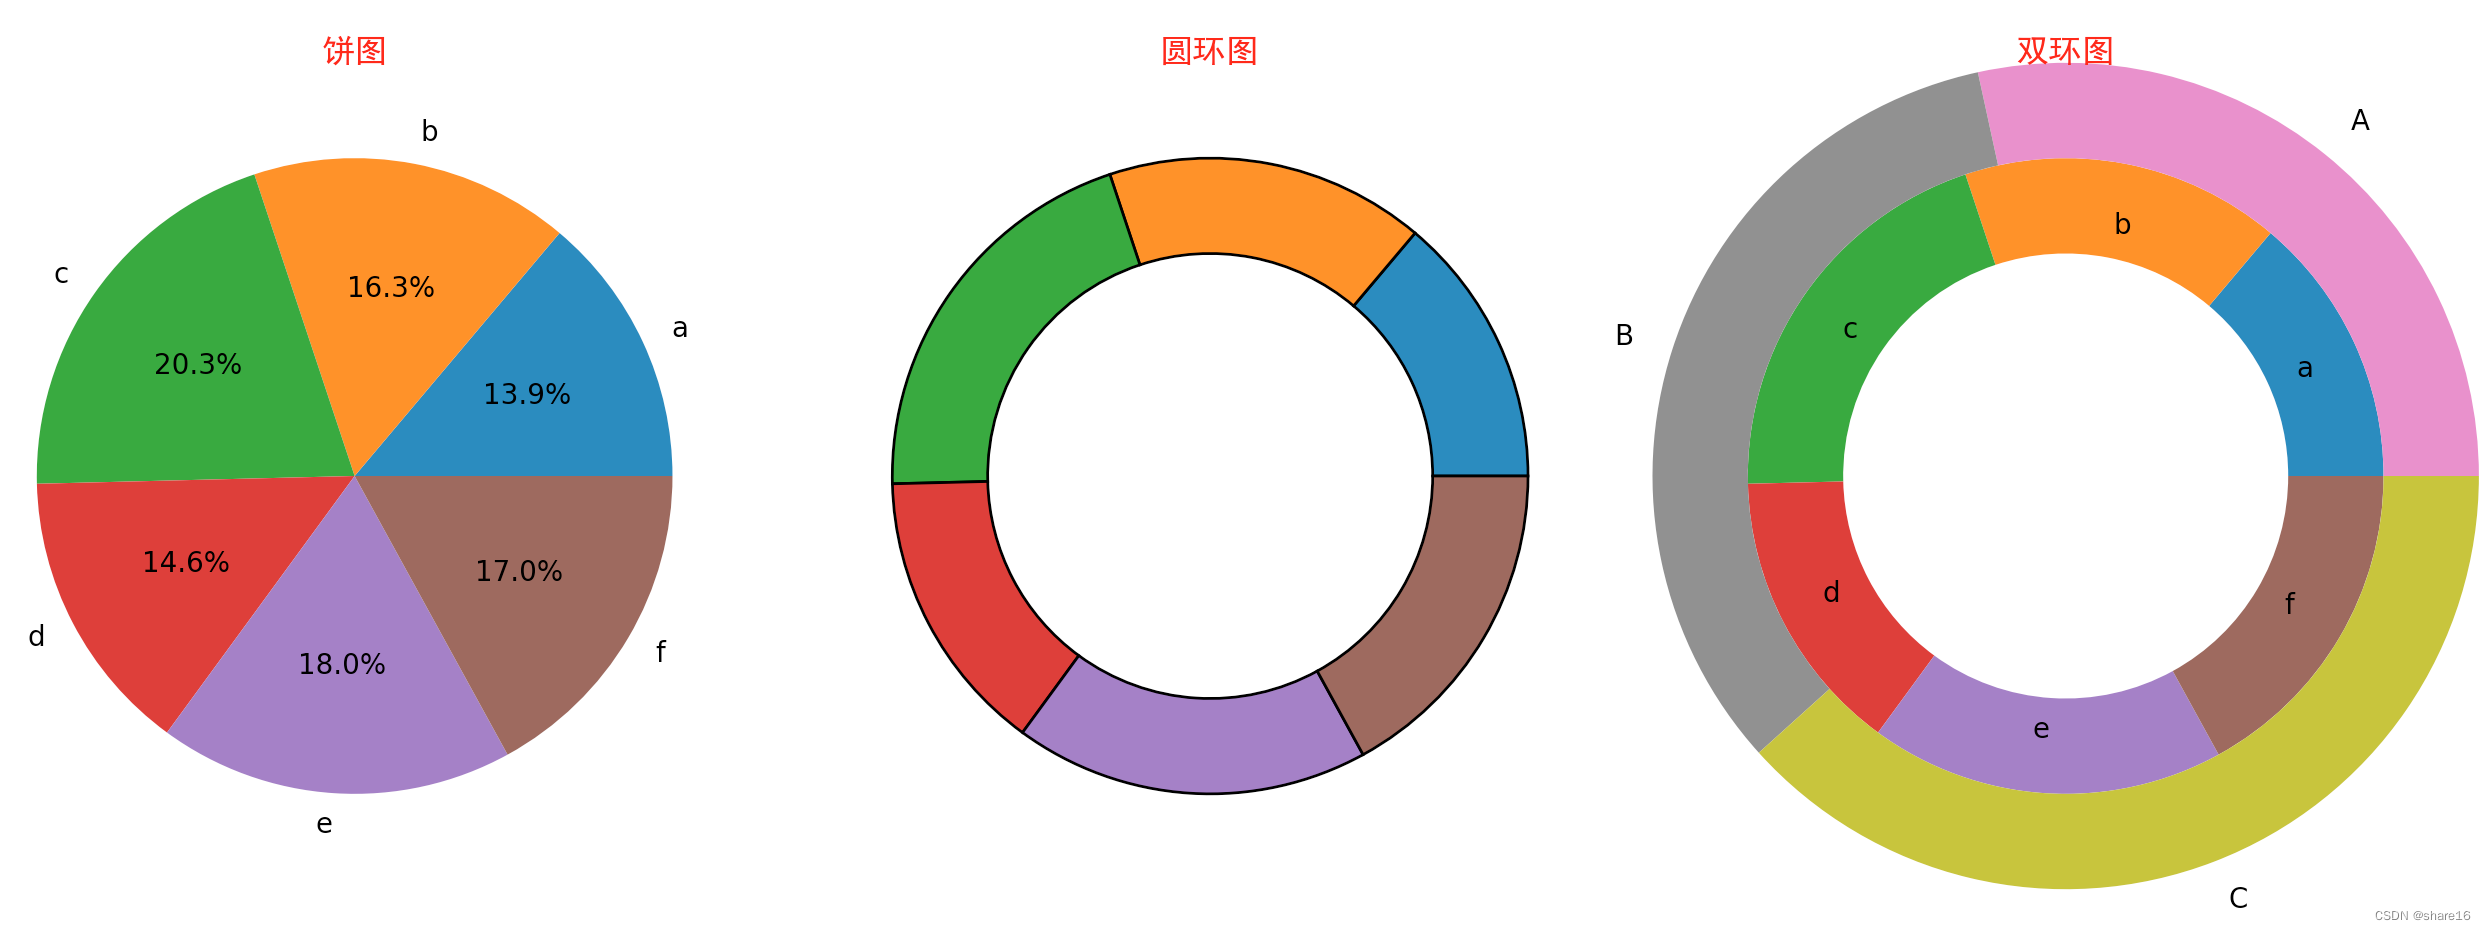
饼图在图像上是一个被分成若干部分的圆,用于反映每个部分对于整体所占的比重;可用plt.pie()方法实现。
plt.pie(data,x,explode,labels,colors,autopct,pctdistance,shadow,labeldistance,startangle,radius,counterclock,wedgeprops,textprops,center,frame,rotatelabels,normalize)
- explode:饼图中每一块离圆心的距离; autopct:控制饼图中数值的百分比格式;
- pctdistance:饼图中百分比数值距离中心的距离; labeldistance:labels距离饼图的距离;
- startangle:饼图的初始角度; radius:半径; center:饼图中心位置,如(0,0);
- wedgeprops:饼图内外边界属性; textprops:饼图中文本相关属性; frame:是否显示饼图后面的图框; counterclock:是否让饼图逆时针显示;
import matplotlib.pyplot as plt
import pandas as pd
df = pd.DataFrame([['A','a',13.85],['B','b',16.26],['C','c',20.28],['A','d',14.56],['C','e',18.04],['B','f',17.01]],columns=['group','name','score'])
a = df.groupby('group').sum().reset_index()

plt.figure(figsize=(18,6))
plt.subplot(1,3,1)
plt.pie(data=df,x='score',labels='name',autopct='%1.1f%%')
plt.title('饼图',color='r')

plt.subplot(1,3,2)
plt.pie(data=df,x='score',wedgeprops={
    'width':0.3,'edgecolor':'black'})
plt.title('圆环图',color='r')

plt.subplot(1,3,3)
plt.pie(data=df,x='score',labels='name',labeldistance=0.8,wedgeprops={
    'width':0.3})
plt.pie(data=a,x='score',radius=1.3,labels='group',labeldistance=1.1,wedgeprops={
    'width':0.3})
plt.title('双环图',color='r')

plt.tight_layout()
5.5.2 其他的图(文氏图/树状图)
文氏图用于表示不同集合之间所有可能的逻辑关系,每个集合用一个圆表示,圆的大小反映了该组的重要性,组与组之间通常会有交叠,交叠的部分体现了不同组之间的交叉数据;可用matplotlib_venn包中的venn2和venn3方法绘制两个集合或三个集合的之间的逻辑关系;文氏图的数据类型可以是set或tuple。
- 不建议绘制超过3个集合的venn图,超过3个集合的venn图不便于理解;
- 图中的数字是指集合之间交集的元素个数;
- venn2方法中可以指定两个set的取值,venn2方法中可以指定3个set的取值;
- 可以通过一个tuple指定集合之间的重叠关系,且在venn2方法中tuple只有前3个元素会被用于venn图绘制,在venn3方法中tuple只有前7个元素会被用于venn图绘制;
树图将数据显示为一组嵌套的矩形,通过矩形的面积反映其取值大小,使用配色方案,可以表示多个维度:组、子组;可用squarify包绘制树图。
- 树图的优势是充分利用了空间,使得在有限的空间内展示大量数据;
- 不要在层次结构中注释超过3个级别,这会使图形不可读;优先考虑层次结构的最高层次;
from matplotlib_venn import venn2
from matplotlib_venn import venn3
import matplotlib.pyplot as plt
import squarify
L,M,N = {
    -1,-2,-3,0,6},{
    1,2,3,4,5},{
    1,3,5,7,9}

plt.figure(figsize=(18,4))
plt.subplot(1,3,1)
venn2(subsets=(L,M),set_labels=('L','M'))
plt.title('文氏图',color='r',fontfamily='SimHei')

plt.subplot(1,3,2)
venn3(subsets=(L,M,N),set_labels=('L','M','N'))
plt.title('文氏图',color='r',fontfamily='SimHei')

plt.subplot(1,3,3)
squarify.plot(sizes=[28.41,33.27,38.32,40],label=['A','B','C','D'])
plt.title('树状图',color='r',fontfamily='SimHei')
plt.axis('off')

plt.tight_layout()

谢谢大家
边栏推荐
猜你喜欢
随机推荐
MySQL基础(一)---基础认知及操作
电话溥功能
A blog clears the Redis technology stack
ES6 生成器
【过一下 17】pytorch 改写 keras
coppercam primer [6]
uva1325
Flutter真机运行及模拟器运行
Flutter learning - the beginning
Returned object not currently part of this pool
How to quickly upgrade your Taobao account to a higher level
Flex layout frog game clearance strategy
Detailed Explanation of Redis Sentinel Mode Configuration File
Multi-threaded query results, add List collection
SQL(一) —— 增删改查
Flutter学习5-集成-打包-发布
CAP+BASE
【Transfer】What is etcd
redis 持久化
Judgment statement _switch and case
