当前位置:网站首页>Introduction of ArcGIS grid resampling method
Introduction of ArcGIS grid resampling method
2022-07-05 21:04:00 【GIS thinking】
Introduction to grid resampling method
Grid resampling is the process of assigning the pixel value or derived value of the input image to each pixel in the output image . The image mentioned here is grid data , Including grid (GRID) And image (IMAGE) Two types of . When the position of input image and output image ( After geometric transformation or projection setting and other operations ) Or pixel size ( Grid image resolution ) When something changes , Grid resampling is required .
Besides , Grid resampling is a common data processing method for grid data to deal with grid resolution matching in spatial analysis , For the convenience of analysis , Usually, different resolutions are converted to the same resolution through grid resampling . For a given spatial resolution of grid data , You can resample , Resample the grid data into larger pixels , That is, reduce the spatial resolution . This process will lose some details of the original high spatial resolution ; It can also be resampled into smaller pixels , But it will not add more information . Resample the multispectral remote sensing image with geospatial resolution into the same resolution as the panchromatic image with high spatial resolution , Then fuse the two images , The resulting image will have both high spectral resolution and high spatial resolution information , It can be used for topic extraction and Application , It is a common way of remote sensing data fusion .
Grid resampling mainly includes three methods : Nearest neighbor method 、 Bilinear interpolation and cubic convolution interpolation . The nearest neighbor method is to fill the nearest pixel value in the original image into the new image ; Bilinear interpolation and cubic convolution interpolation fill the pixel values near the original image into the new image by distance weighted average . These three resampling methods will be introduced in detail below .
Nearest neighbor method
The nearest neighbor method takes the nearest pixel value in the input grid data set as the input value , Assign the corresponding pixels to the output grid dataset .
The advantage of this method is that the original grid value will not be changed , And it's fast , But this method will have a displacement of half a pixel . It is suitable for discrete data representing classification or a certain topic , Such as land use 、 Vegetation type, etc .
|
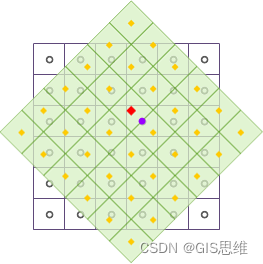
As shown in the figure above , After geometric transformations such as translation and rotation for grid data , Resample the output grid dataset , Adopt the nearest neighbor method . among , The black wireframe indicates the input grid dataset , A light green fill indicates the output grid dataset , The Red Square dot indicates the central position of a pixel in the output grid data set , Its pixel value will be recalculated . Find the center point of the pixel closest to the Red Square point , That is, the purple dots shown in the figure , Fill the pixel value represented by the purple dot into the Red Square dot , Complete the resampling of a grid pixel .
Bilinear interpolation
Bilinear interpolation is a method based on cubic linear interpolation , Will be input into 4 The nearest pixel (4 Neighborhood ) Calculate the new pixel value by weighted average of the pixel value of , And assign it to the corresponding pixel of the output grid dataset . among , The weight is determined by 4 The distance between the center of each pixel in the neighborhood and the interpolation point .
The resampling result of this method will be smoother than that of the nearest neighbor method , But it will change the original grid value . It is applicable to express the distribution of a certain phenomenon 、 Continuous data of topographic surface , Such as DEM、 Temperature or rainfall distribution 、 Slope, etc , These data are originally continuous surfaces obtained by interpolation of sampling points .
|
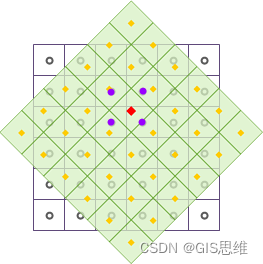
As shown in the figure above , After geometric transformations such as translation and rotation for grid data , Resample the output grid dataset , Bilinear interpolation method is adopted . among , The black wireframe indicates the input grid dataset , A light green fill indicates the output grid dataset , The Red Square dot indicates the central position of a pixel in the output grid data set , Its pixel value will be recalculated . Take the... Around the Red Square dot 4 Adjacent points , this 4 The center point of the adjacent points is the position indicated by the purple dot in the figure , Through the distance weighted average calculation , Fill the calculation result into the Red Square dot , Complete the resampling of a grid pixel .
Cubic convolution interpolation
Similar to bilinear interpolation , Cubic convolution interpolation is a method based on quintic polynomial interpolation , Will be input into 16 The nearest pixel (16 Neighborhood ) Calculate the new pixel value by weighted average of the pixel value of , And assign it to the corresponding pixel of the output grid dataset . among , The weight is determined by 16 The distance between the center point of each pixel in the neighborhood and the interpolation point .
Cubic convolution interpolation method obtains the best interpolation function by adding adjacent points , It can further improve the interpolation accuracy , The algorithm is more complex , Large amount of computation , Longer processing time . Because this method uses 16 The neighborhood is weighted , The processing result will be clearer , The boundary of grid data will be sharpened . This method will also change the original grid value , And it may exceed the value range of the input grid . It is suitable for resampling aerial photos and remote sensing images .
|
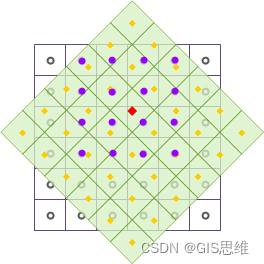
As shown in the figure above , After geometric transformations such as translation and rotation for grid data , Resample the output grid dataset , Using cubic convolution interpolation . among , The black wireframe indicates the input grid dataset , A light green fill indicates the output grid dataset , The Red Square dot indicates the central position of a pixel in the output grid data set , Its pixel value will be recalculated . Take the... Around the Red Square dot 16 Adjacent points , this 16 The center point of the adjacent points is the position indicated by the purple dot in the figure . Through the distance weighted average calculation , Fill the calculation result into the Red Square dot , Complete the resampling of a grid pixel .
Recommend learning
ArcGIS Model builder for (ModelBuilder) Video tutorial
ArcGIS10.X Video tutorial for getting started (GIS thinking )
ArcGIS Remote sensing image classification and results application video course
ArcPy Combined with the batch drawing of data-driven module
ArcGIS And Data Reviewer Spatial data quality inspection
GIS thinking GIS Series of technical courses
边栏推荐
猜你喜欢
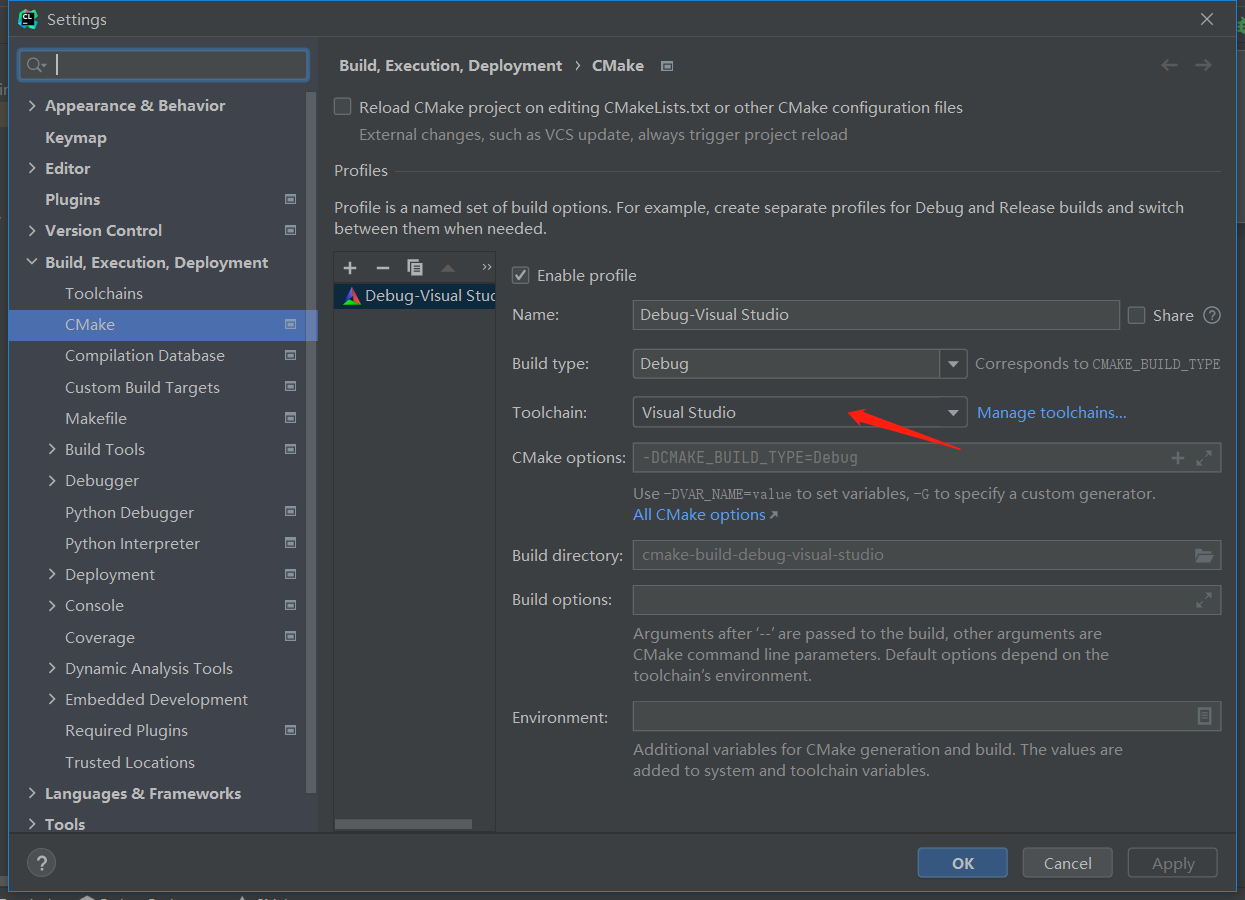
Clion configures Visual Studio (MSVC) and JOM multi-core compilation
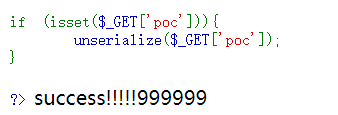
PHP反序列化+MD5碰撞
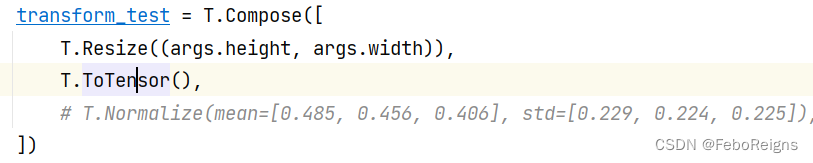
教你自己训练的pytorch模型转caffe(三)

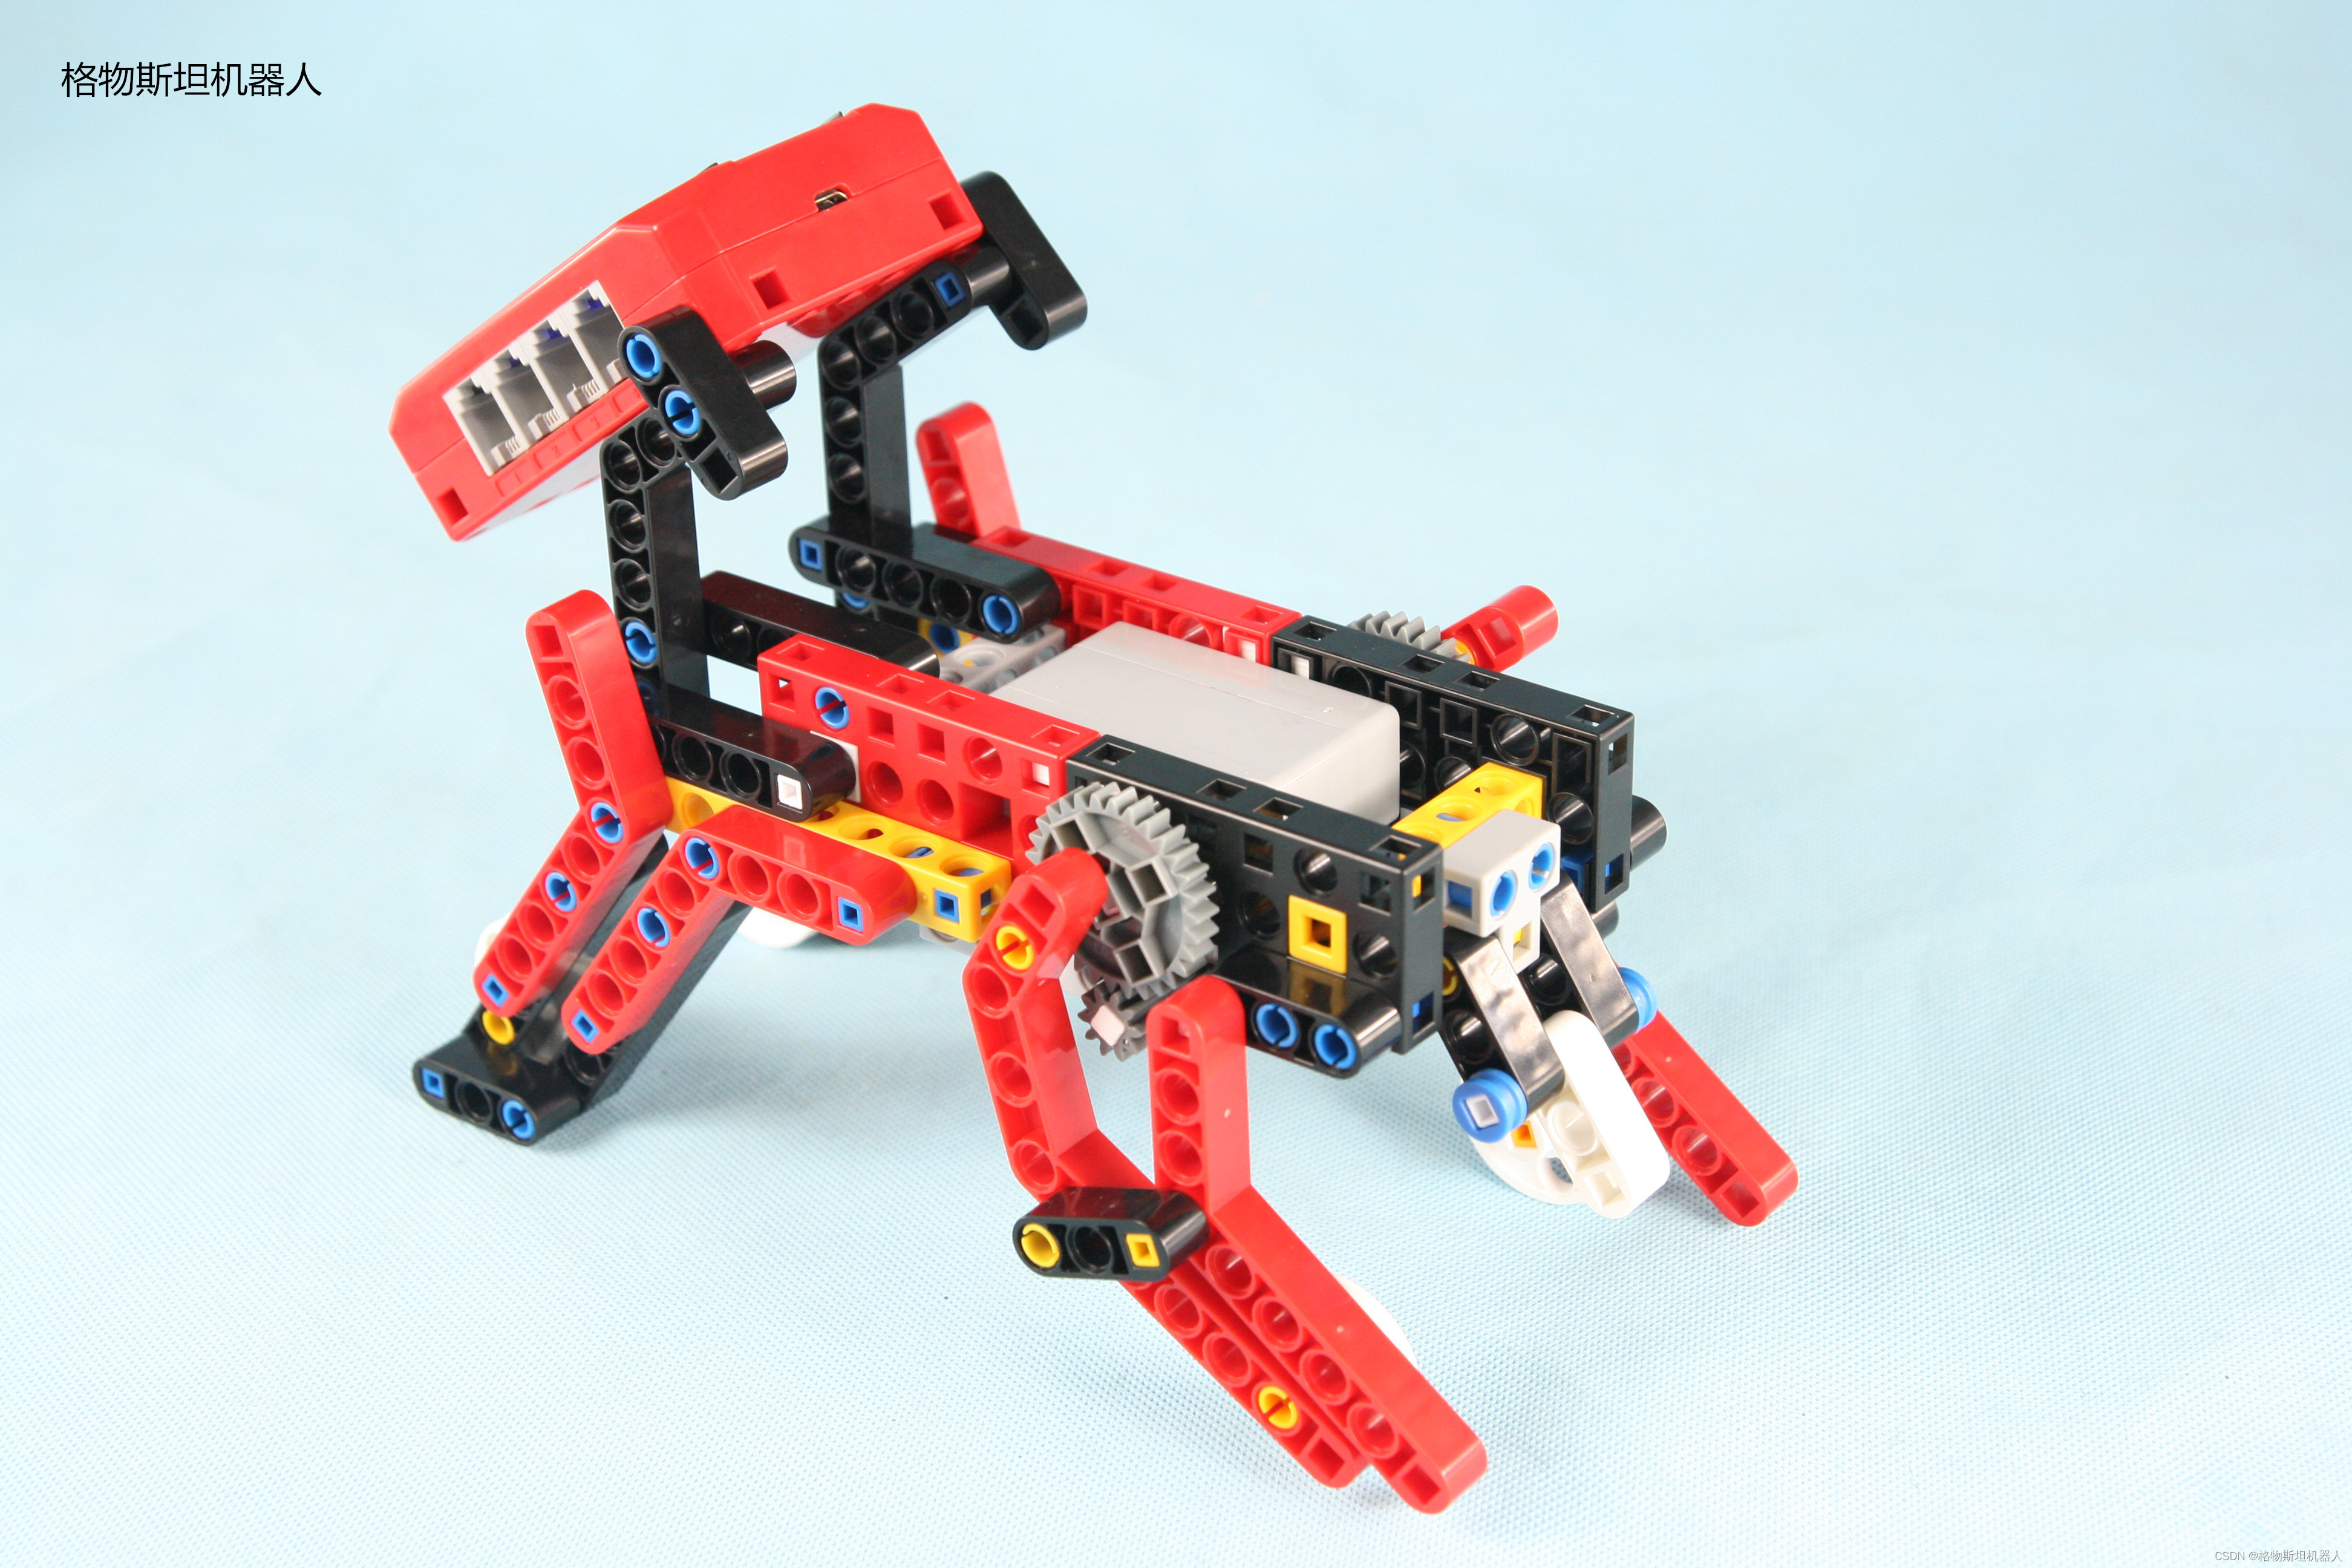
Learning robots have no way to start? Let me show you the current hot research directions of robots
Analysis of steam education mode under the integration of five Education

请查收.NET MAUI 的最新学习资源

Duchefa low melting point agarose PPC Chinese and English instructions
使用WebAssembly在浏览器端操作Excel
R语言【数据管理】
EN 438-7 laminated sheet products for building covering decoration - CE certification
随机推荐
Five layer network protocol
Sophomore personal development summary
CareerCup它1.8 串移包括问题
Utils/index TS tool function
Which is the best online collaboration product? Microsoft loop, notion, flowus
木板ISO 5660-1 热量释放速率摸底测试
wpf 获取datagrid 中指定行列的DataGridTemplateColumn中的控件
Aitm 2-0003 horizontal combustion test
Research and development efficiency improvement practice of large insurance groups with 10000 + code base and 3000 + R & D personnel
Monorepo管理方法论和依赖安全
Popular science | does poor English affect the NPDP exam?
Web Service简单入门示例
Analyze the knowledge transfer and sharing spirit of maker Education
Learning notes of SAS programming and data mining business case 19
Abnova CD81 monoclonal antibody related parameters and Applications
字典树简单入门题(居然是蓝题?)
Comparison table of foreign lead American abbreviations
Add ICO icon to clion MinGW compiled EXE file
Phpstudy Xiaopi's MySQL Click to start and quickly flash back. It has been solved
五层网络协议