当前位置:网站首页>Establishment of graphical monitoring grafana
Establishment of graphical monitoring grafana
2022-07-06 17:40:00 【Oh, no, I forgot my paper】
Graphical monitoring grafana Build
List of articles
Tips : The following is the main body of this article , The following cases can be used for reference
One 、grafana Introduction to
grafana It's one that uses go Open source applications written in language , It is mainly used for visualization of large scale index data , It is the most popular time series data display tool in network architecture and application analysis , At present, it has supported most of the commonly used time series databases . The best reference is the official website (http://docs.grafana.org/)
Grafana Supports many different data sources . Each data source has a specific query editor , The editor's custom features and functions are open to specific data sources . The following data sources are officially supported :Graphite,Elasticsearch,InfluxDB,Prometheus,Cloudwatch,MySQL and OpenTSDB etc.
DashBoard: The dashboard , It's like a car dashboard that shows a lot of information , Including speed , Water tank temperature, etc .Grafana Of DashBoard It's to show in various graphic ways from Datasource The data we got .
Row: That's ok ,DashBoard The basic unit of composition , One DashBoard It can contain many row. One row It can show one kind of information or a combination of many kinds of information , For example, the system memory utilization rate ,CPU Five minute and ten minute average load, etc . So in a DashBoard A lot of content can be displayed on the Internet .
Panel: panel , It's actually row The way information is presented , Support forms (table), list (alert list), Thermogram (Heatmap) And so on , You can go to the official website for details .
Query Editor: Query editor , It is used to specify which part of the data to get . Be similar to sql Query statement , For example, you're going to be in a row It shows test The data in this table , that Query Editor It can be written as select *from test. It's just an analogy , Actually every DataSource The way to get data is different , So it's written differently (http://docs.grafana.org/features/datasources/), Such as zabbix, Data is obtained by specifying a monitoring item .
Organization: organization ,org It's a big concept , Each user can have multiple org,grafana There is a default main org. Users can log in at different org Switch between , The premise is that the user has multiple org. Different org It's totally different , Include datasource,dashboard It's not the same . Create a org It's like opening a whole new view , be-all datasource,dashboard We have to start again .
User: user , The concept should be simple , Needless to say .Grafana There are three roles for users admin,editor,viewer.admin The highest authority , You can do anything , Include creating users , newly added Datasource, establish DashBoard.editor Roles cannot create users , You can't add Datasource, You can create DashBoard.viewer Characters can only be viewed DashBoard. stay 2.1 A new role has been added to the version and beyond read only editor( Read only edit mode ), This mode allows users to modify DashBoard, But it's not allowed to keep . Every user You can have multiple organization.
Two 、Grafana Installation
1. Download what you need rpm package
The code is as follows ( Example ):
wget https://dl.grafana.com/oss/release/grafana-6.7.1-1.x86_64.rpm
2. Local installation rpm package
The code is as follows ( Example ):
yum -y localinstall grafana-6.7.1-1.x86_64.rpm
3. Reload and start
systemctl daemon-reload
systemctl start grafana-server
Browser input localhost:3000 You can visit grafana Home page ,grafana Default port 3000、 The default username and password are admin/admin
3、 ... and 、Grafana Graphical configuration prometheus
Install well grafana After that, we need to add data sources 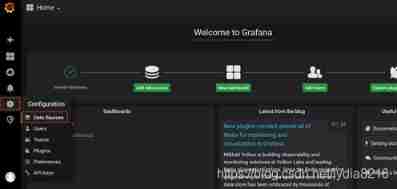
Add data sources 
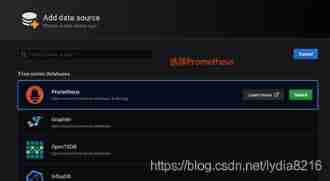
Next, we start to configure :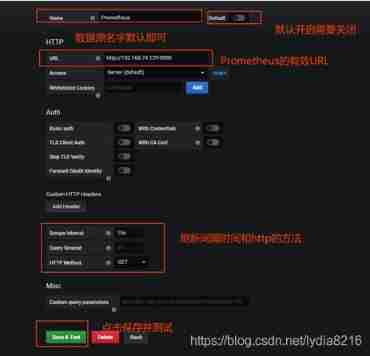
After configuration, click on the bottom left save&test( Save and test )
If the test passes, two green pop-up windows will be displayed .


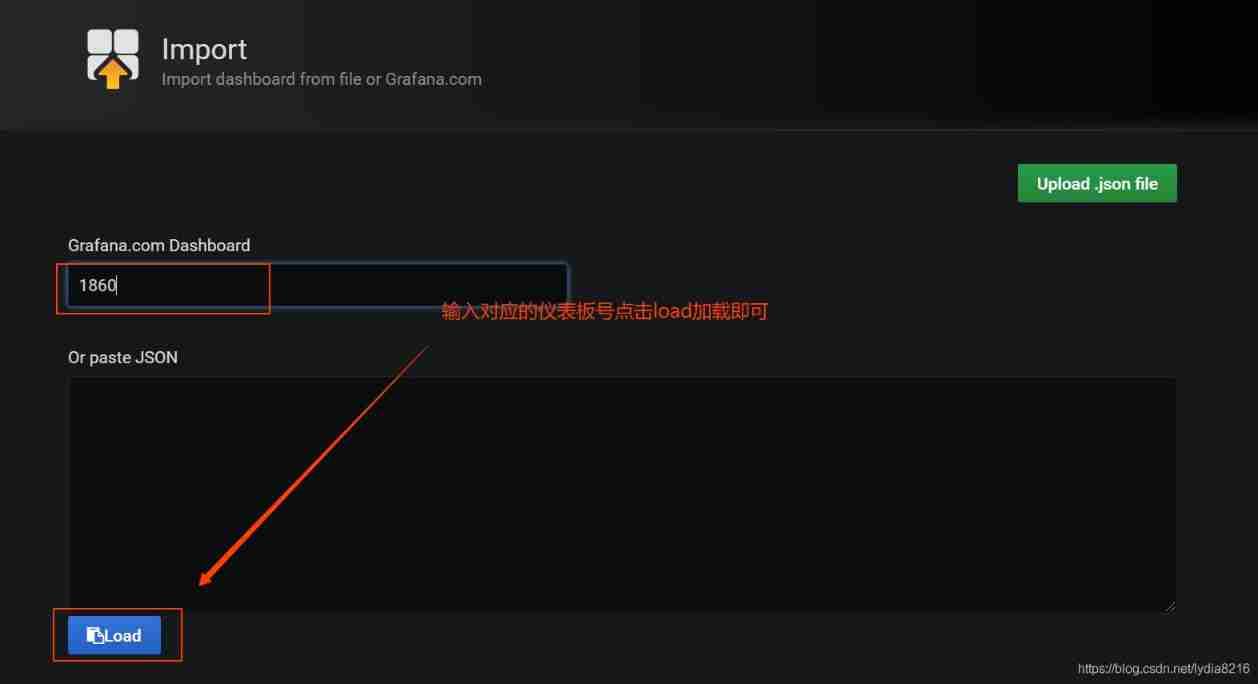
Four 、 Import dashboard (dashboards)
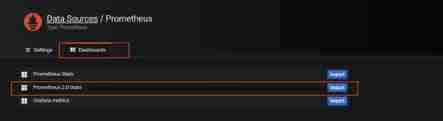
Finally, click view to display the graphical interface .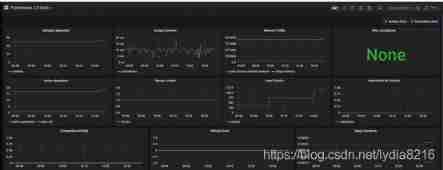
Import dashboards for other services .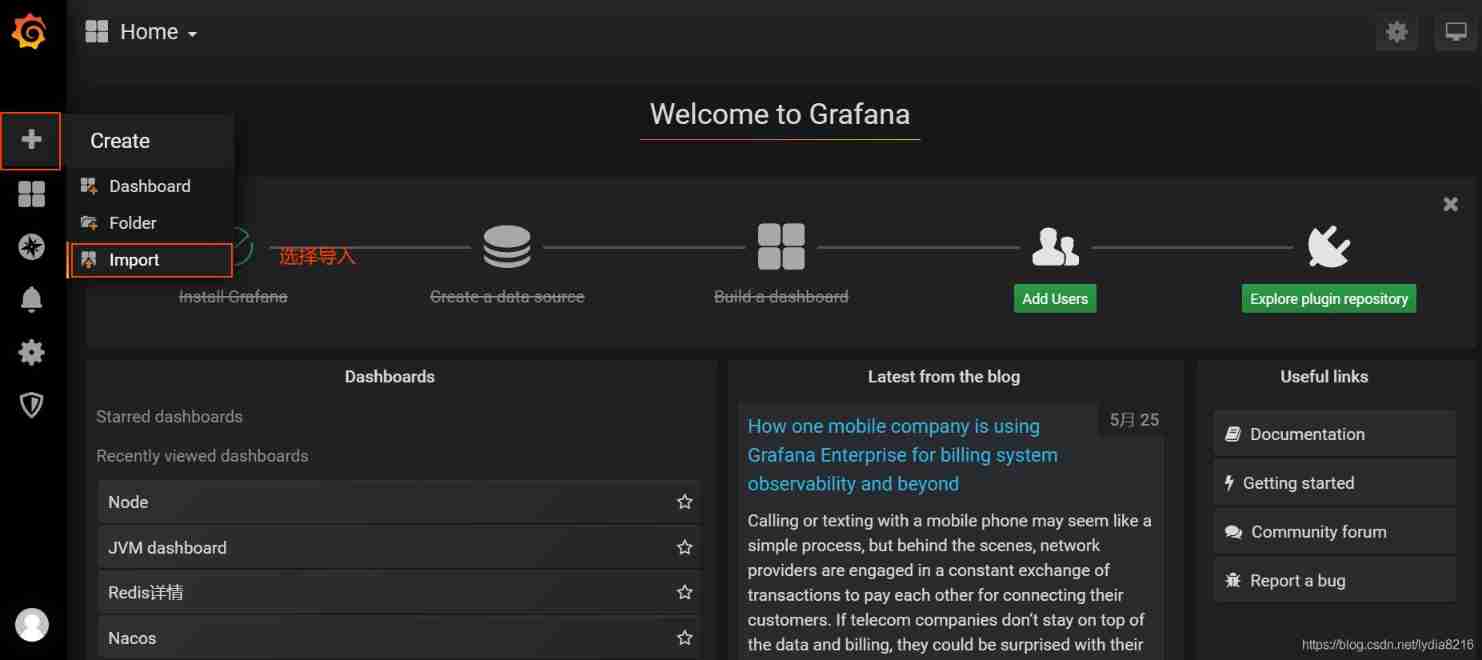
The effect is as follows 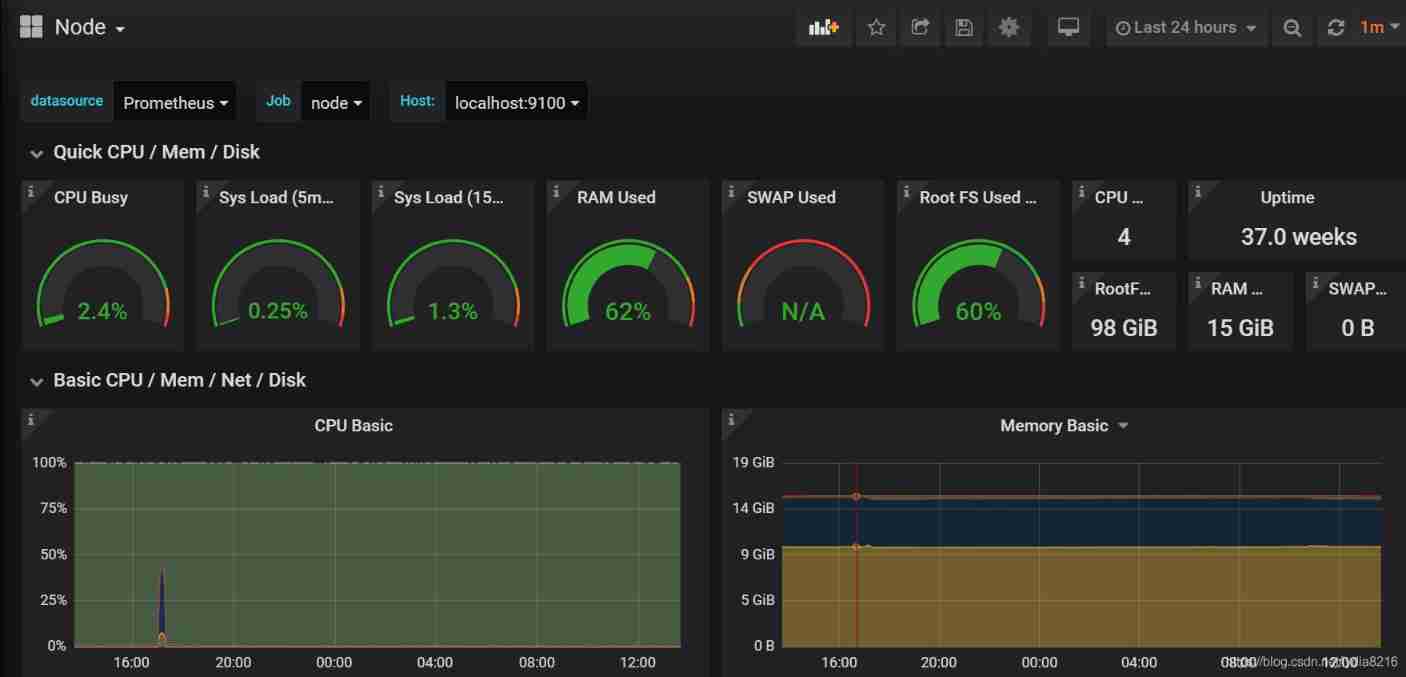
边栏推荐
- The art of Engineering (1): try to package things that do not need to be exposed
- Pyspark operator processing spatial data full parsing (4): let's talk about spatial operations first
- CTF逆向入门题——掷骰子
- Unity小技巧 - 绘制瞄准准心
- Final review of information and network security (full version)
- 关于Selenium启动Chrome浏览器闪退问题
- Spark calculation operator and some small details in liunx
- The problem of "syntax error" when uipath executes insert statement is solved
- Virtual machine startup prompt probing EDD (edd=off to disable) error
- Unity粒子特效系列-闪星星的宝箱
猜你喜欢
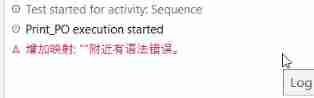
The problem of "syntax error" when uipath executes insert statement is solved
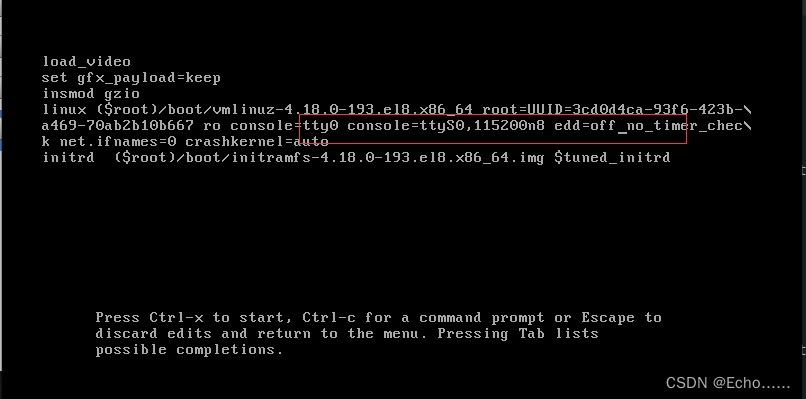
虚拟机启动提示Probing EDD (edd=off to disable)错误
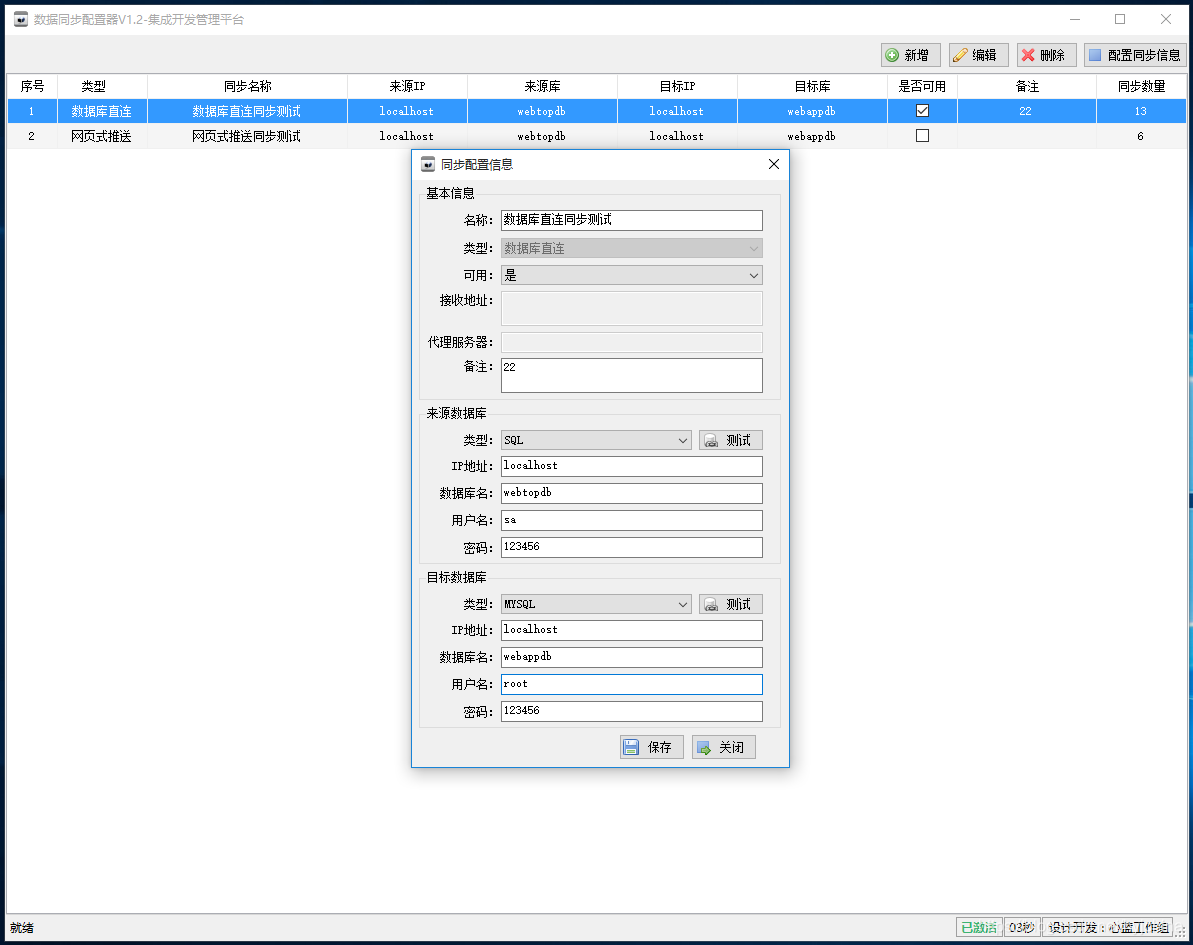
05个人研发的产品及推广-数据同步工具
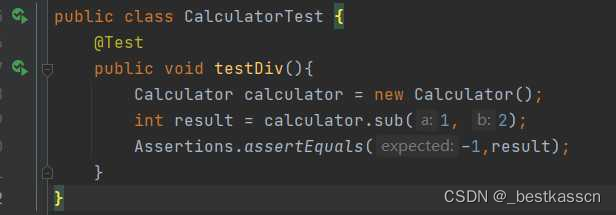
Junit单元测试
![[rapid environment construction] openharmony 10 minute tutorial (cub pie)](/img/b5/feb9c56a65c3b07403710e23078a6f.jpg)
[rapid environment construction] openharmony 10 minute tutorial (cub pie)
Virtual machine startup prompt probing EDD (edd=off to disable) error

【MySQL入门】第三话 · MySQL中常见的数据类型
Re signal writeup
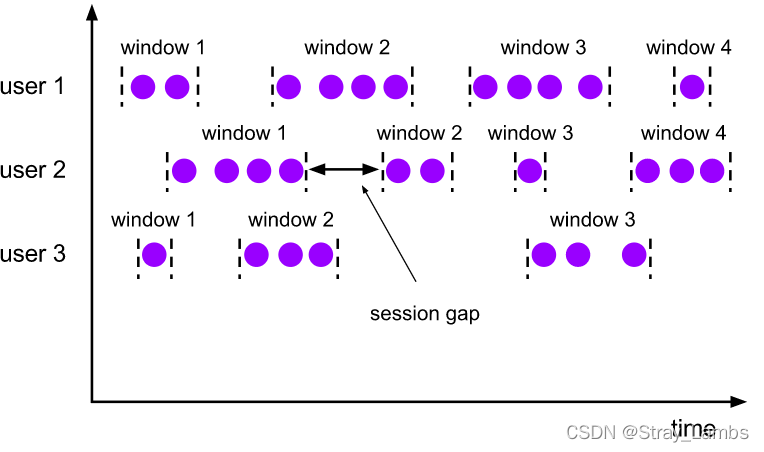
Flink parsing (VII): time window
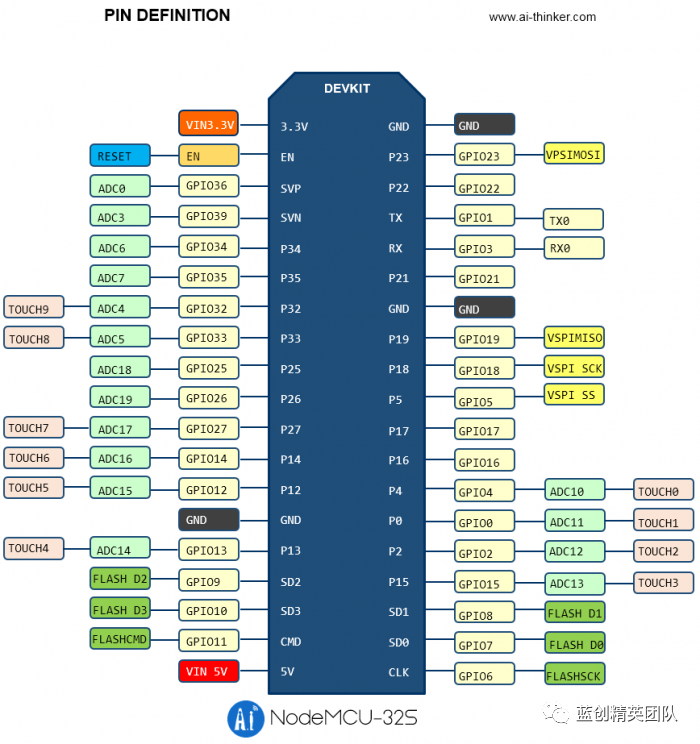
C# NanoFramework 点灯和按键 之 ESP32
随机推荐
C#版Selenium操作Chrome全屏模式显示(F11)
03 products and promotion developed by individuals - plan service configurator v3.0
04个人研发的产品及推广-数据推送工具
Junit单元测试
[translation] principle analysis of X Window Manager (I)
Run xv6 system
Automatic operation and maintenance sharp weapon ansible Playbook
C#WinForm中的dataGridView滚动条定位
RepPoints:可形变卷积的进阶
【MySQL入门】第一话 · 初入“数据库”大陆
自动答题 之 Selenium测试直接运行在浏览器中,就像真正的用户在操作一样。
BearPi-HM_ Nano development environment
Huawei certified cloud computing hica
2021-03-22 "display login screen during recovery" can't be canceled. The appearance of lock screen interface leads to the solution that the remotely connected virtual machine can't work normally
Solid principle
[ASM] introduction and use of bytecode operation classwriter class
Serial serialold parnew of JVM garbage collector
How uipath determines that an object is null
Hongmeng introduction and development environment construction
Remote code execution penetration test - B module test