当前位置:网站首页>Detailed explanation of MATLAB drawing function fplot
Detailed explanation of MATLAB drawing function fplot
2022-08-02 15:33:00 【Yang Laotou Soft Worker】
Detailed explanation of MATLAB drawing function fplot
1. Basic syntax of fplot
Unlike plot, fplot is mainly used to directly draw function curves according to the function expression and the interval to which the independent variables belong.Therefore, when the function expression is known, it is relatively simple to use fplot to draw the function curve.
Its basic syntax is as follows:
1) fplot( f, xinterval, s )Where f is the expression of the independent variable in the function, xinterval is the value range of the independent variable, and s represents the attribute of the primitive, which is similar to the primitive attribute in the plot.When xinterval is default, the default interval of the argument is [-5, 5].
2) fplot( fx, fy, tinterval, s )This form is mainly used to draw function curves represented by parametric equations.Where fx and fy represent the expressions of x and y with respect to parameter t, respectively, tinterval is the value range of parameter t, and s represents the attribute of the primitive.
3) fplot( @(var) f(var), xinterval, s )Where @(var) is to declare var as an independent variable (the identifier can be given as needed), f(var) is a specific function expression, xinterval is the value range of the independent variable, and s represents the value of the primitiveAttributes.
4) fplot( @(t)fx(t), @(t) fy(t), tinterval, s )Where @(t) is to declare t as a parameter (the identifier can be given as needed), fx(t) and fy(t) are the expressions of the abscissa and ordinate of the specific parameter equation, and tinterval is the parameterThe value range of t, and s represents the attribute of the primitive.
Note: Usage 1) and 2) will have a warning in the new version.3) and 4) are standard usage in the new version.
Second, the specific example
Example 1. Draw y=sin(x) curve graph.
% sample code (1)clear allclcfplot( 'sin(x)' ) % only function expressions are given%run result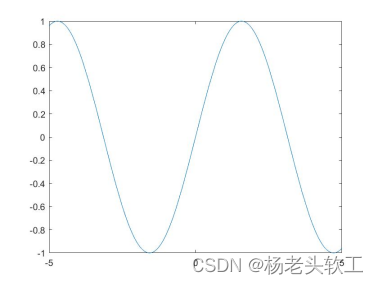
% sample code (2)clear allclcfplot( 'sin(x)',[ -pi, pi ], 'ro' )xlabel( 'x' );ylabel( 'sin(x)' );%run result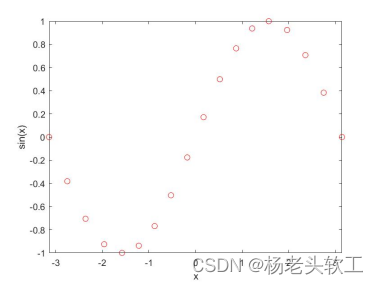
% sample code (3)clear allclcfplot( @(x)sin(x),[ -pi, pi ] )xlabel( 'x' );ylabel( 'sin(x)' );%Running results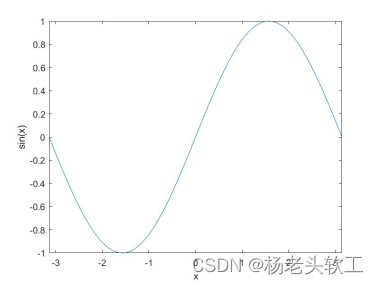
Example 2. In the sameOne window draws sine and cosine curves in one cycle
% sample codeclear allclcfplot( @(x)sin(x),[ -pi, pi ], 'r-.' )hold onfplot( @(x)cos(x),[ -pi, pi ], 'b--' )xlabel( 'x' );ylabel( 'y' );legend( 'y=sin(x)', 'y=cos(x)' );%run result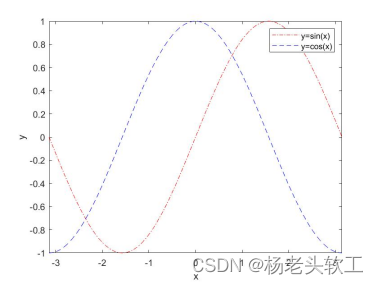
Example 3. Drawing a unit circle
% sample codeclear allclcfplot( @(t)sin(t), @(t)cos(t),[ -pi, pi ] ) % solid line unit circlehold onfplot( @(t)sin(t), @(t)cos(t),[ -pi, pi ], 'ro' ) % unit circle scatterplotxlabel( 'x' );ylabel( 'y' );title( 'Unit Circle' );axis equalaxis( [ -1.5, 1.5, -1.5, 1.5 ] );%run result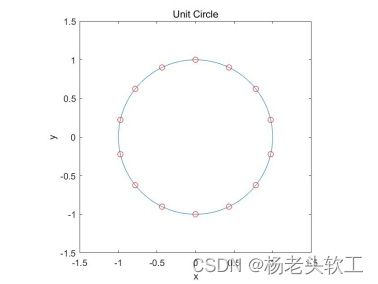
Example 4. Plot piecewise function curve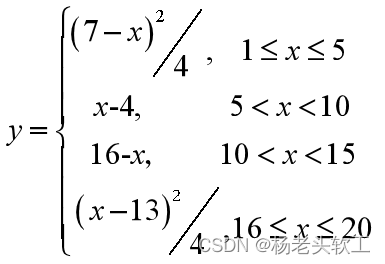
% sample codeclear allclcfplot( @(x)(7-x).^2/4,[1, 5 ], 'r' )hold onfplot( @(x)x-4,[5, 10 ], 'r' )fplot( @(x)16-x,[10, 15 ], 'r' )fplot( @(x)(x-13).^2/4,[15, 19 ], 'r' )xlabel( 'x' );ylabel( 'y' );title( 'Piecewise Function Curve' );axis( [ 0, 20, 0, 10 ] );%run result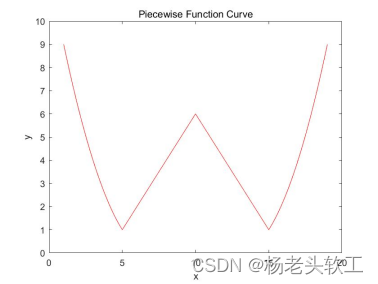
边栏推荐
- Actual combat Meituan Nuxt +Vue family bucket, server-side rendering, mailbox verification, passport authentication service, map API reference, mongodb, redis and other technical points
- Daily - Notes
- Golang 垃圾回收机制详解
- 5. Transaction management
- 利用plot_surface命令绘制复杂曲面入门详解
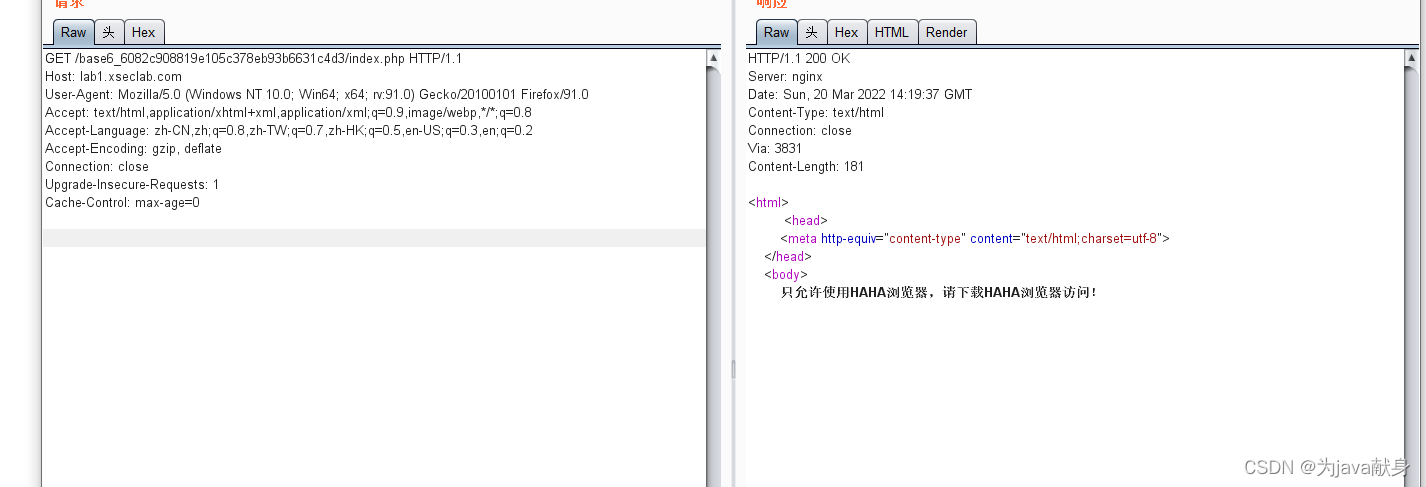
- 网络安全抓包
- Failed to install using npx -p @storybook/cli sb init, build a dedicated storybook by hand
- win10系统更新错误代码0x80244022怎么办
- 2021-10-14
- 【系统设计与实现】基于flink的分心驾驶预测与数据分析系统
猜你喜欢


随机推荐
A clean start Windows 7?How to load only the basic service start Windows 7 system
Introduction to in-order traversal (non-recursive, recursive) after binary tree traversal
基于矩阵计算的线性回归分析方程中系数的估计
MATLAB绘图函数plot详解
如何用硬币模拟1/3的概率,以及任意概率?
MATLAB绘图函数ezplot入门详解
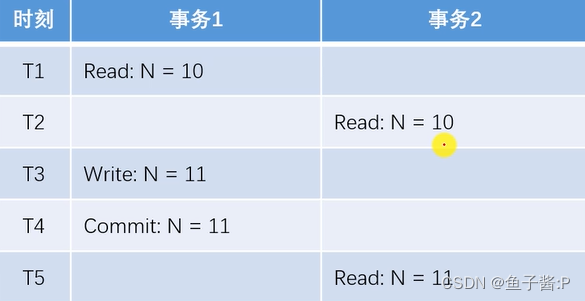
Mysql之MVCC
Daily - Notes
Detailed explanation of MATLAB drawing function plot
使用 腾讯云搭建一个个人博客
word方框怎么打勾?
In-depth understanding of Golang's Map
Win10上帝模式干嘛的?Win10怎么开启上帝模式?
mysql学习总结 & 索引
Win10 Settings screen out from lack of sleep?Win10 set the method that never sleep
Article pygame drag the implementation of the method
Codeforces Round #624 (Div. 3)
Masters and Masters
MATLAB制作简易小动画入门详解
5. Transaction management