当前位置:网站首页>Nuscenes数据集总结(下)
Nuscenes数据集总结(下)
2022-08-02 04:13:00 【时代&信念】
前言
上一篇总结已经介绍了Nuscenes数据集的来源、mini数据集的下载、数据集的基本使用。没有阅读上篇博客的小伙伴,可以先看看上一篇。
这篇博客将主要介绍Nuscenes数据集的扩展包——lidarseg 和 panoptic。
数据集和扩展包的下载
本次操作,使用的数据有和上一篇一样的数据集——mini数据集。另外还需要下载nuScenes-panoptic扩展包和nuScenes-lidarseg扩展包。
同样的,下载mini版即可!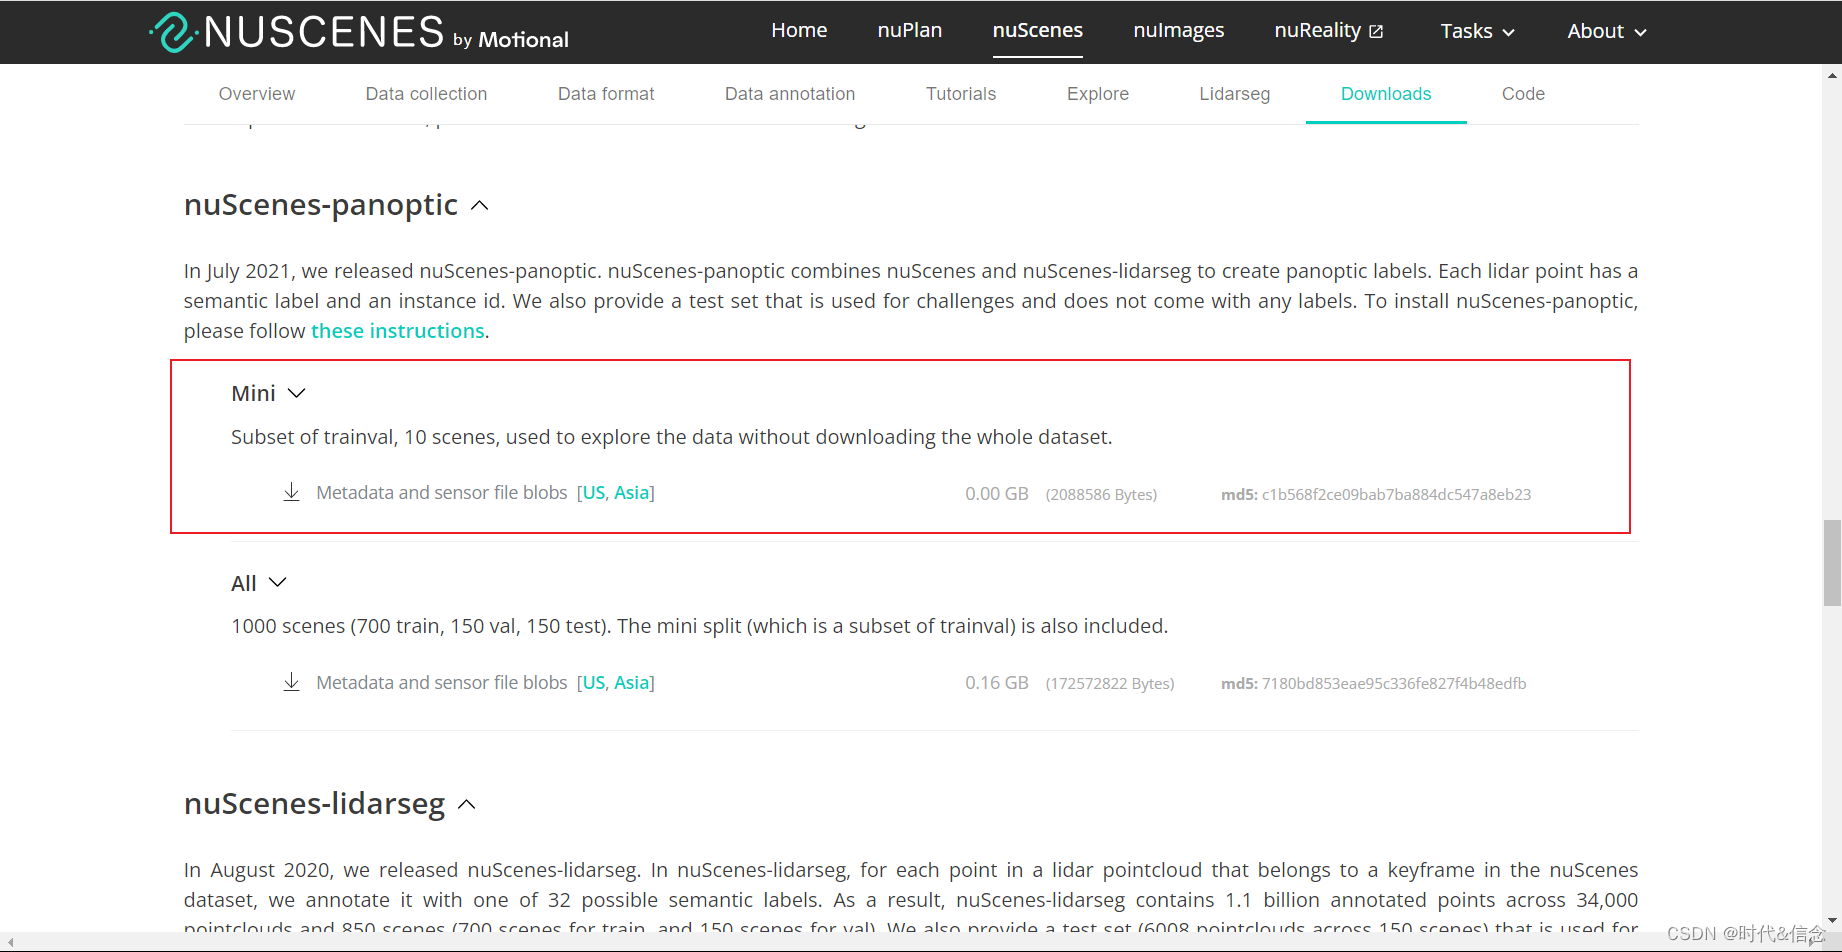

下载好后,解压时要注意,我是用的是WinRAR解压,需要多点击一次!!!
然后将这个文件夹进行解压,最后和mini数据集的文件层级关系如下:

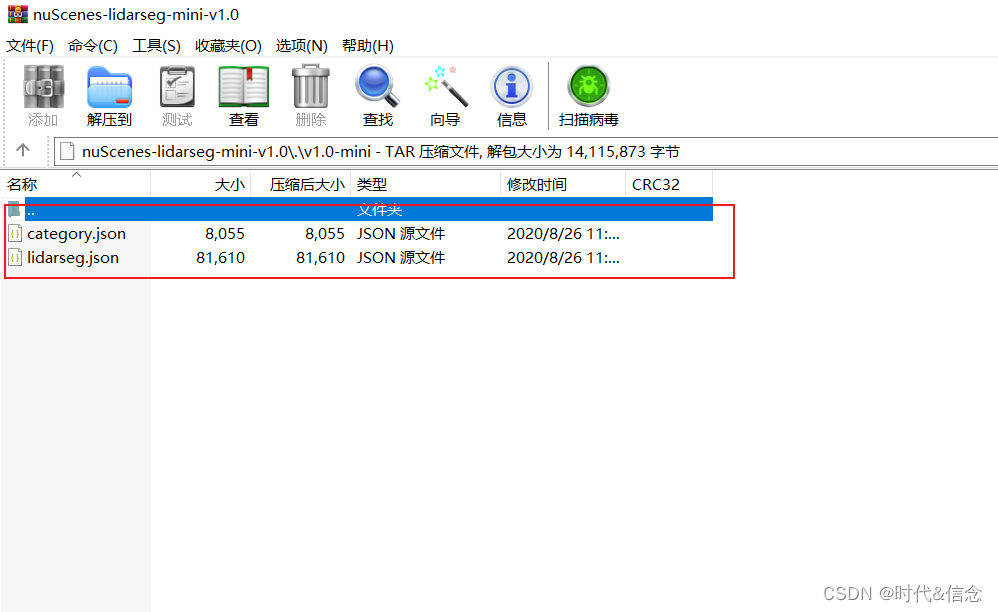
将两个压缩包中的lidarseg.json、panoptic.json、category.json复制到v1.0-mini文件夹下。如下所示。
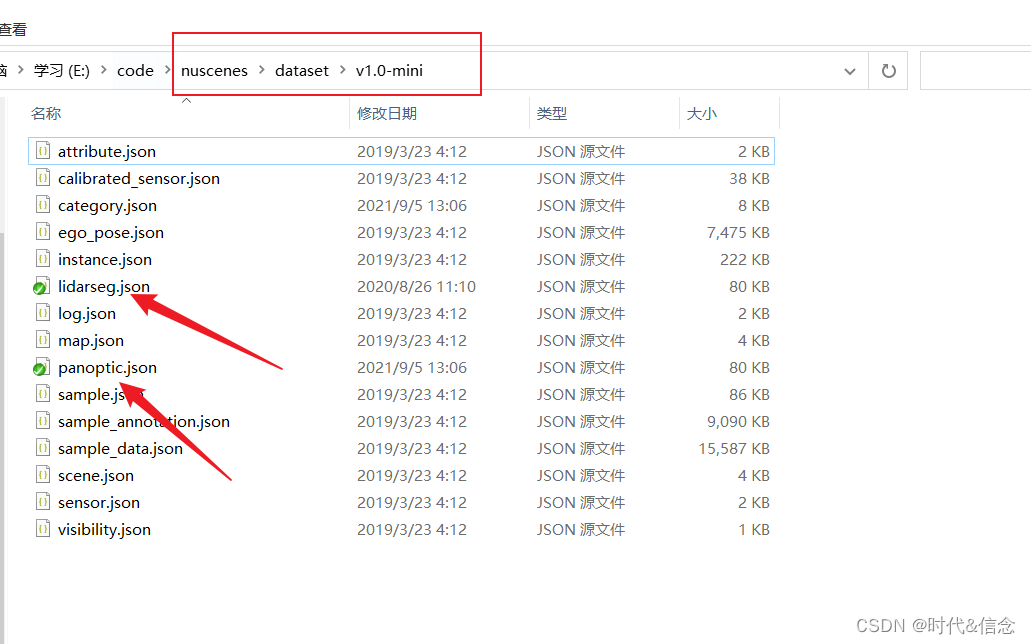
至此,数据集和扩展包就配置好了!
使用攻略
1.加载数据集和扩展包
from nuscenes import NuScenes
nusc = NuScenes(version='v1.0-mini', dataroot='数据集所在位置', verbose=True)

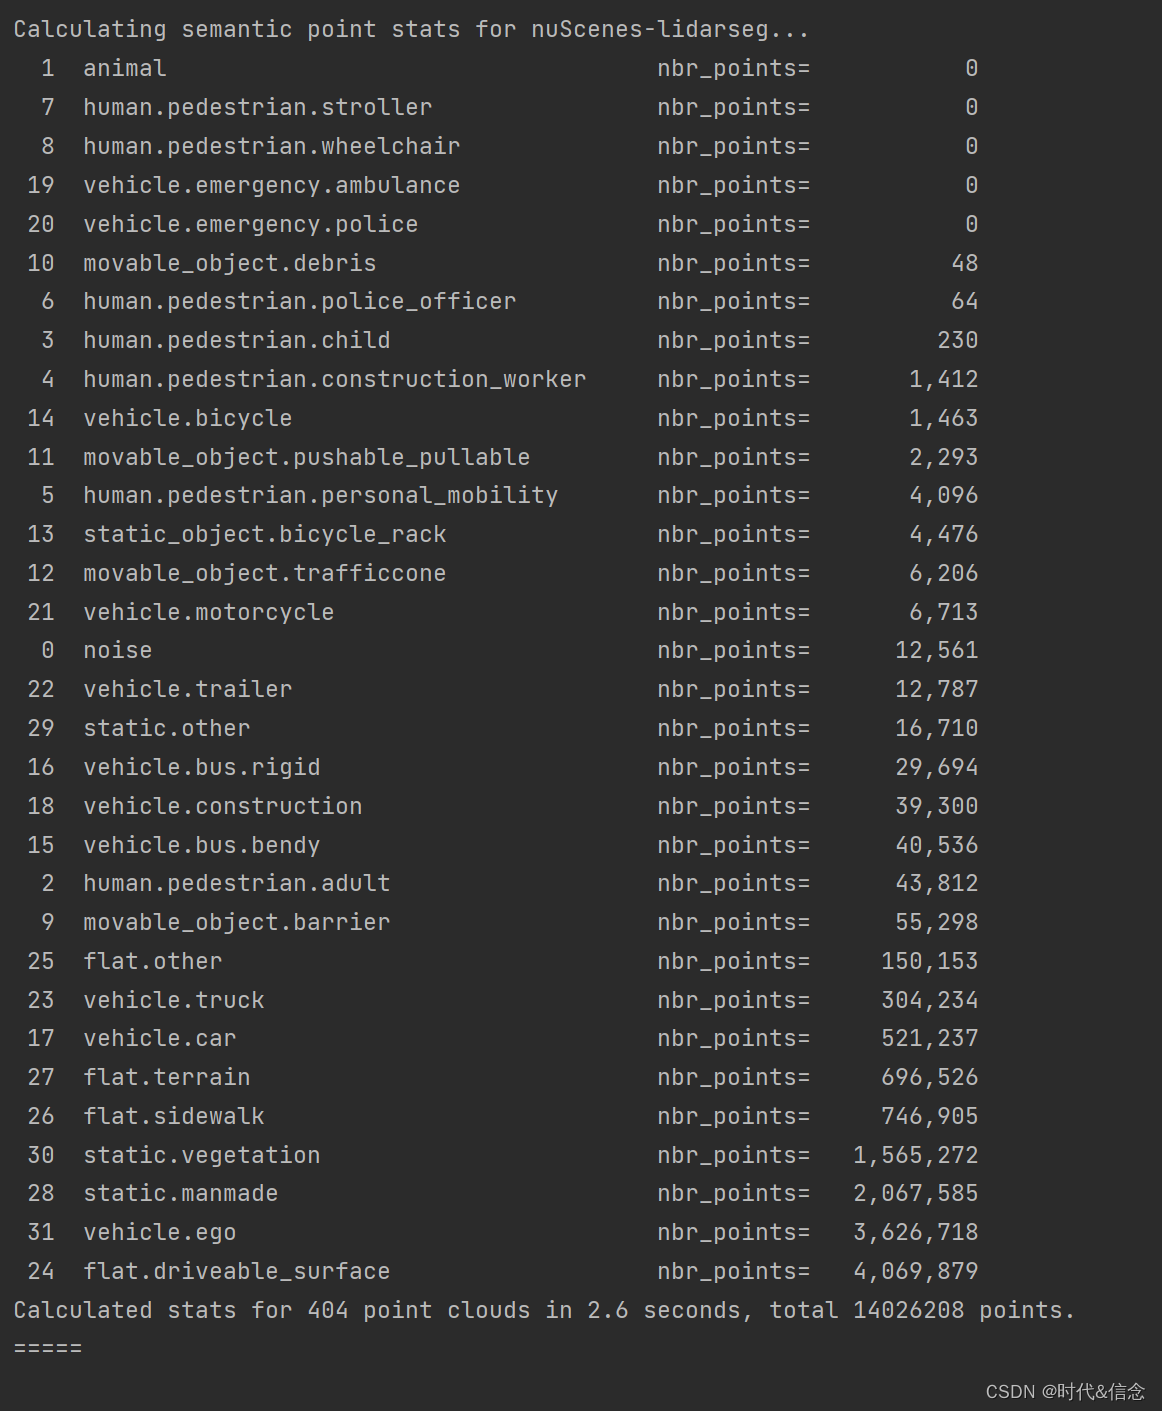
2.lidarseg和panoptic数据集的点统计
lidarseg
# 展示lidarseg的种类,按count排列,从小到大排列
nusc.list_lidarseg_categories(sort_by='count')
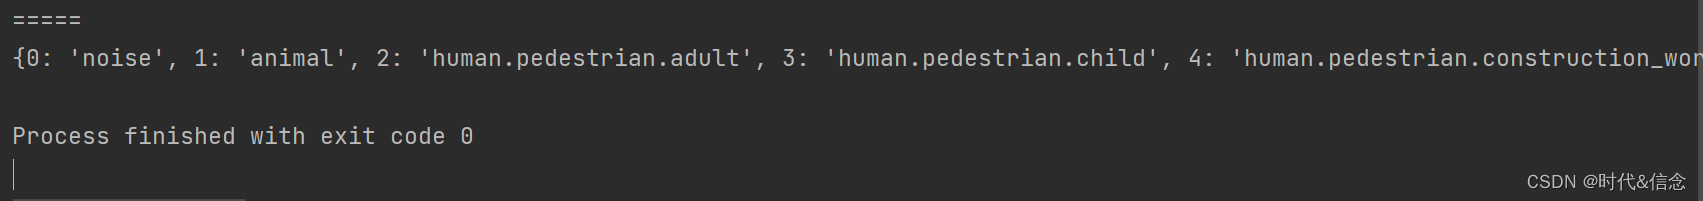
# 按索引顺序获取类名
print(nusc.lidarseg_idx2name_mapping)
# 按类名获取索引顺序
print(nusc.lidarseg_name2idx_mapping)

panoptic
# 从panoptic检查每个语义类别的点数,使用gt_from参数即可
# nuscenes-panoptic
nusc.list_lidarseg_categories(sort_by='count', gt_from='panoptic')

3.panoptic数据集的instance统计
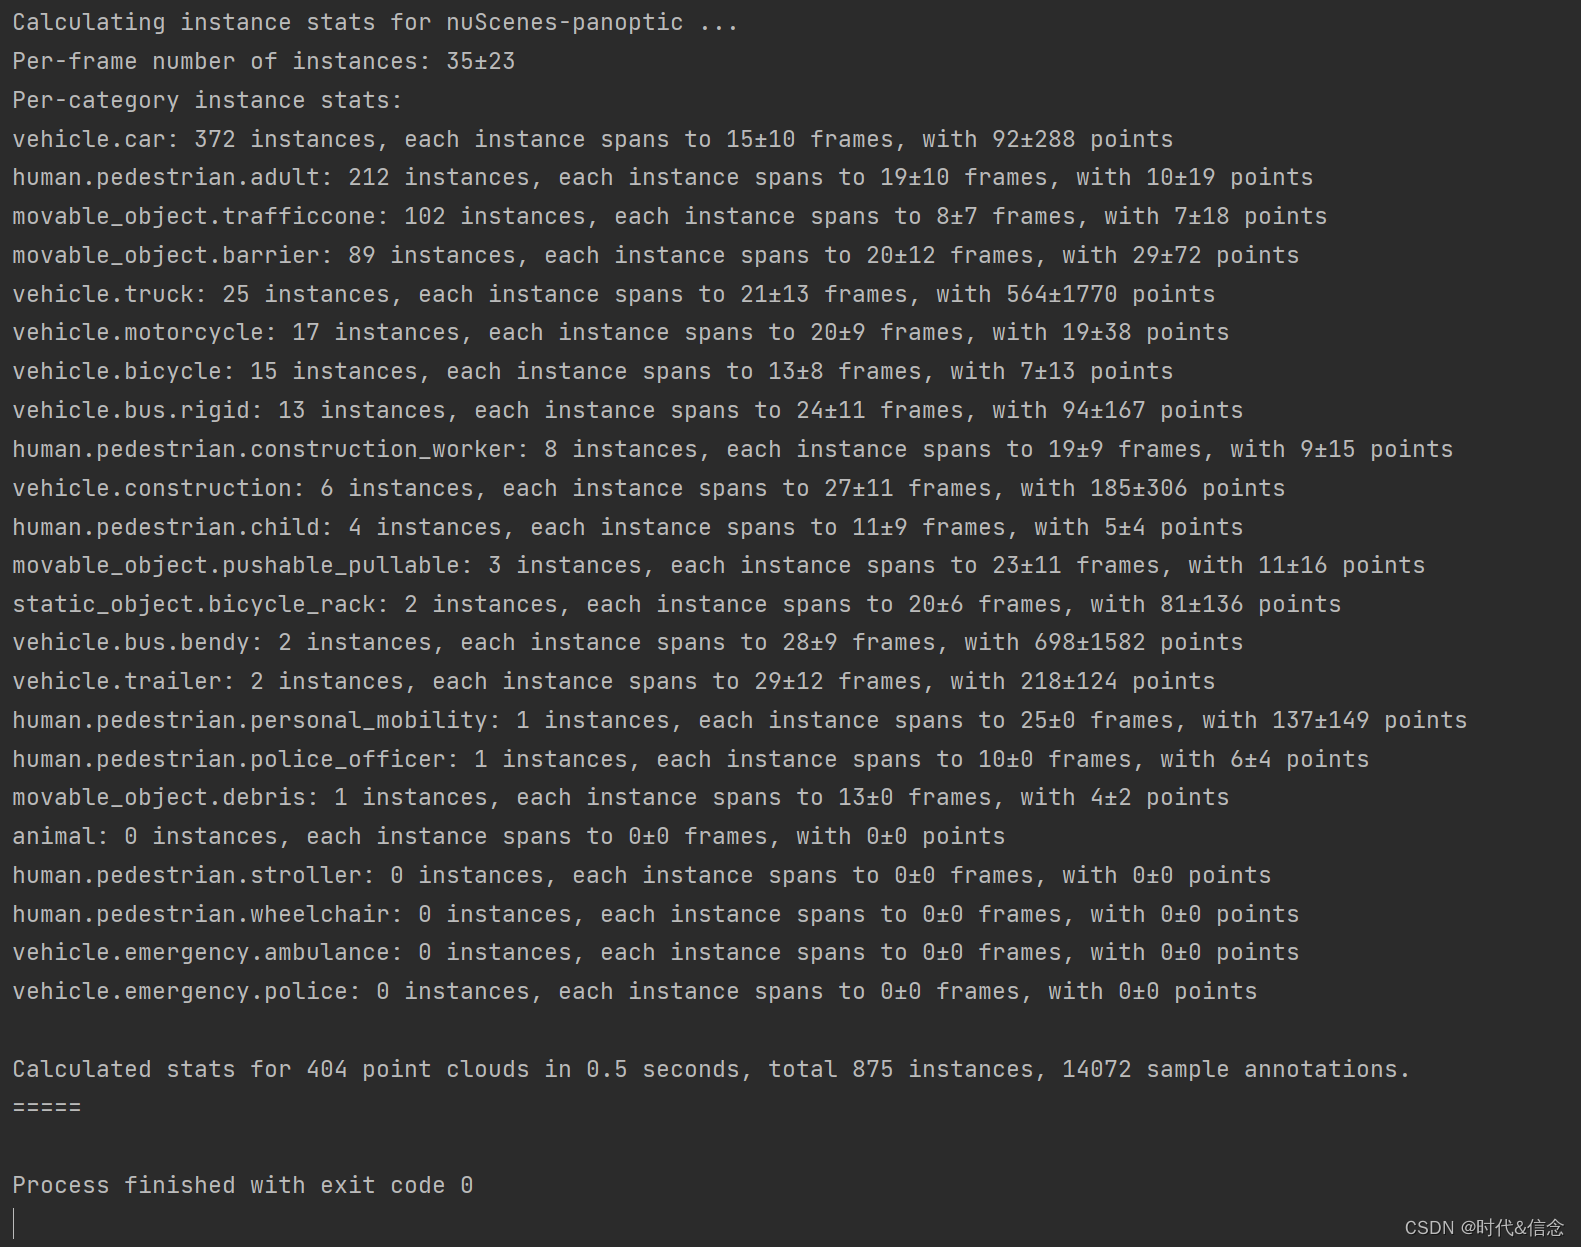
实例统计信息是专属于全景数据集的。为此,我们提供了list_panoptic_instances()函数。你可以将sort_by设置为[‘count’, ‘index’, ‘name’]之一。该函数将计算每帧的实例数,实例总数(唯一的对象ID)和实例状态(一个实例可能有多个状态)。它还计算每个类别的统计数据,包括一个实例跨越的帧数的平均值和标准偏差,以及每个实例的点数的平均值和标准偏差。
# 该函数将计算每帧的实例数,实例总数(唯一的对象ID)和实例状态(一个实例可能有多个状态)。
# 它还计算每个类别的统计数据,包括一个实例跨越的帧数的平均值和标准偏差,以及每个实例的点数的平均值和标准偏差。
nusc.list_panoptic_instances(sort_by='count')
4.获取lidarseg和panoptic的sample token的统计信息
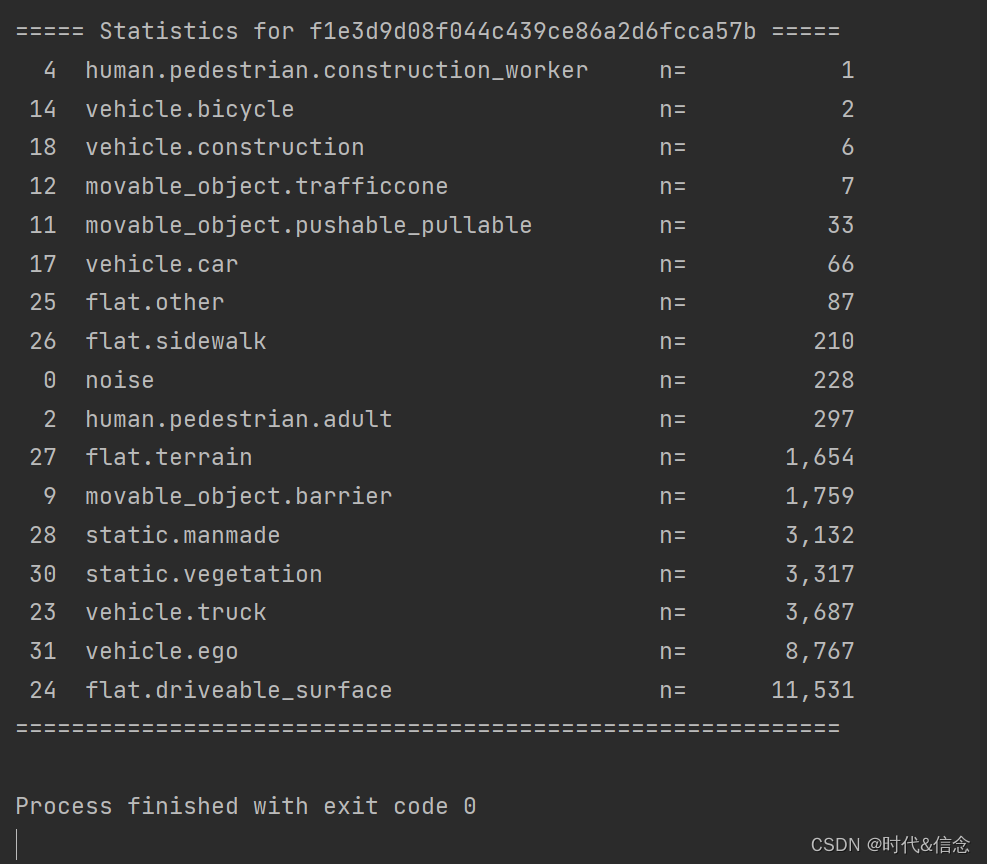
之后使用get_sample_lidarseg_stats来获取lidarseg的样本统计信息。通过执行sort_by=‘count’,类和它们各自的频率计数将按升序打印;你也可以在这里执行sort_by='name’和sort_by=‘index’。
# 获取一个sample
my_sample = nusc.sample[5]
# nuscenes-lidarseg
nusc.get_sample_lidarseg_stats(my_sample['token'], sort_by='count')
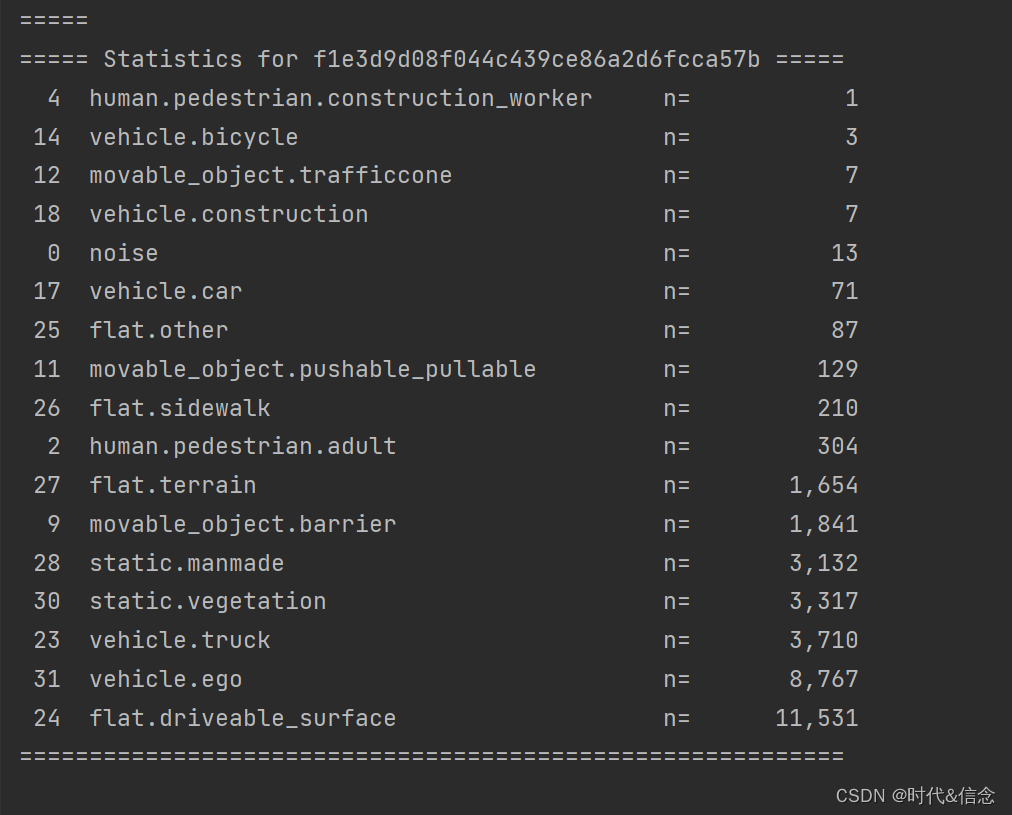
类似地,通过添加gt_from=‘panoptic’,我们可以使用相同的函数来使用panoptic数据集获得类别频率计数。正如在list_lidarseg_categories()中提到的,点计数可能与lidarseg稍有不同,这是因为在nuscens -panoptic中,多个实例的重叠点被设置为noise。
# 从nuscenes-panoptic中获取
nusc.get_sample_lidarseg_stats(my_sample['token'], sort_by='count', gt_from='panoptic')
5.渲染lidarseg标签
现在有了扩展的nuScenes devkit,您所需要做的就是设置show_lidarseg=True来显示pointcloud的类标签。
其他的代码用来进行可视化,和上一篇博客提到的一模一样。
# 渲染lidarseg
sample_data_token = my_sample['data']['LIDAR_TOP']
nusc.render_sample_data(sample_data_token,
                        with_anns=True,
                        show_lidarseg=True)
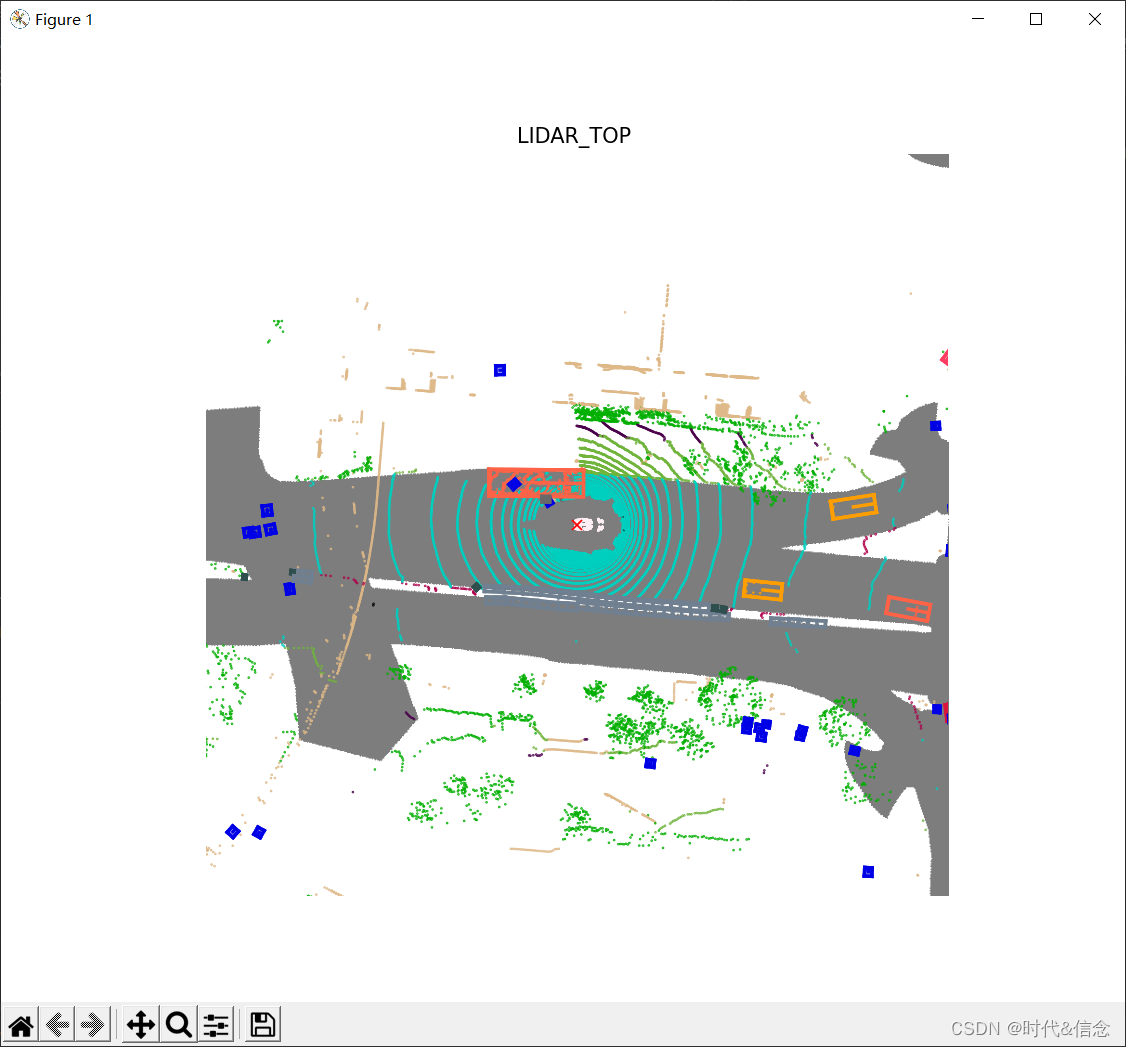
但如果你只想专注于特定的类别呢?假设您只对卡车和汽车感兴趣。你可以从统计数据中看到属于这些类的类索引【汽车的索引为17,卡车的索引为23】,然后将这些索引的数组传递到filter_lidarseg_labels中,如下所示:
# 通过类别索引索引进行过滤
nusc.render_sample_data(sample_data_token,
                        with_anns=False,
                        show_lidarseg=True,
                        filter_lidarseg_labels=[17, 23])
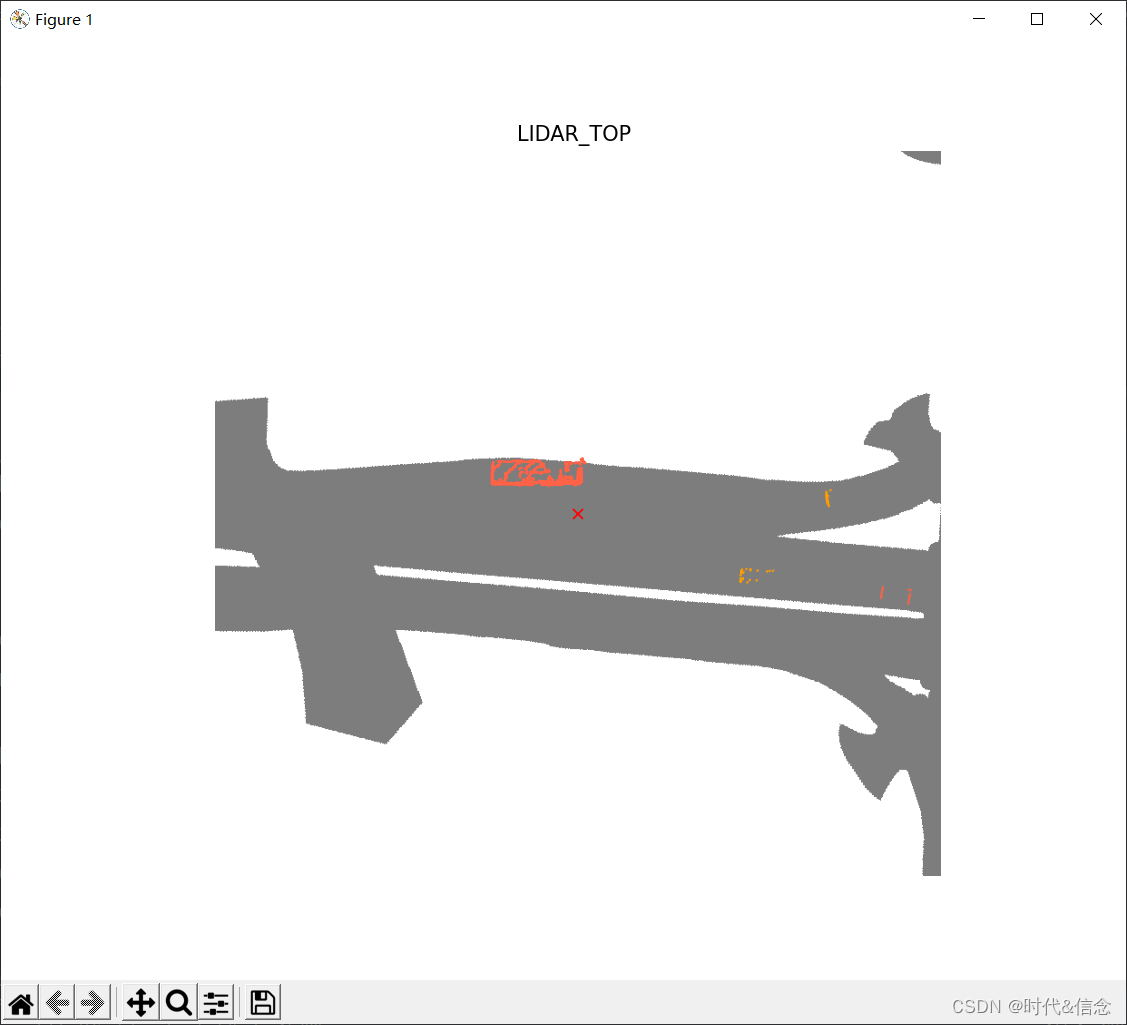
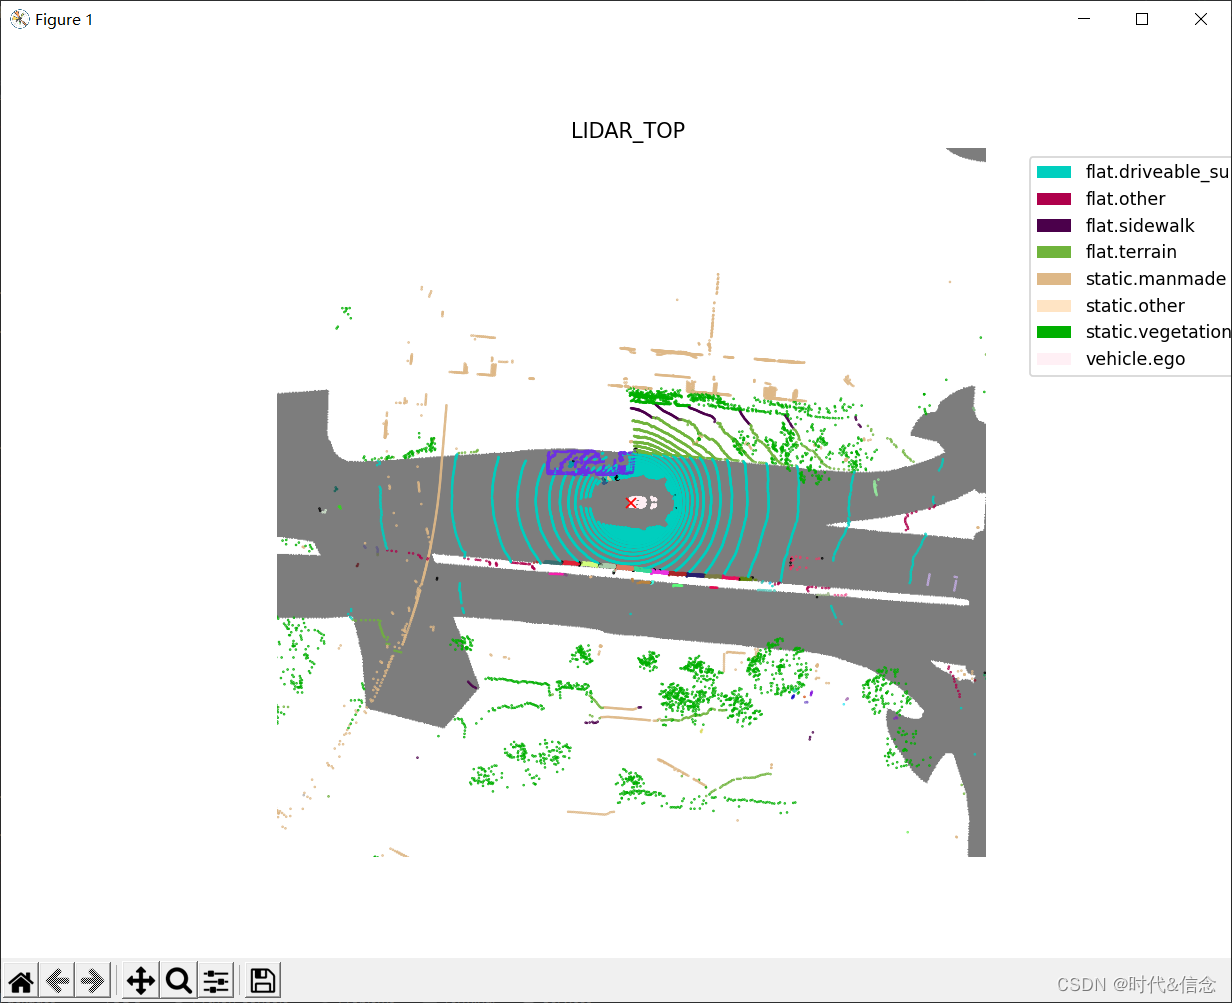
如上图所示,现在只有属于卡车和拖车的点云中的点被过滤出来,以满足您的观看需求。此外,还可以使用show_lidarseg_legend显示一个图例,该图例指示每个类的颜色。
# 显示图例
nusc.render_sample_data(sample_data_token,
                        with_anns=False,
                        show_lidarseg=True,
                        show_lidarseg_legend=True)

6.渲染panoptic标签
与lidarseg类似,也使用相同的函数来呈现panoptic标签(全景标签)。参数的区别是show_panoptic=True。默认情况下,show_lidarseg和show_panoptic都被设置为False。如果两者都设置为True,即show_lidarseg=True, show_panoptic=True, lidarseg将会优先渲染。
# 渲染panoptic标签
sample_data_token = my_sample['data']['LIDAR_TOP']
nusc.render_sample_data(sample_data_token,
                        with_anns=False,
                        show_lidarseg=False,
                        show_panoptic=True)
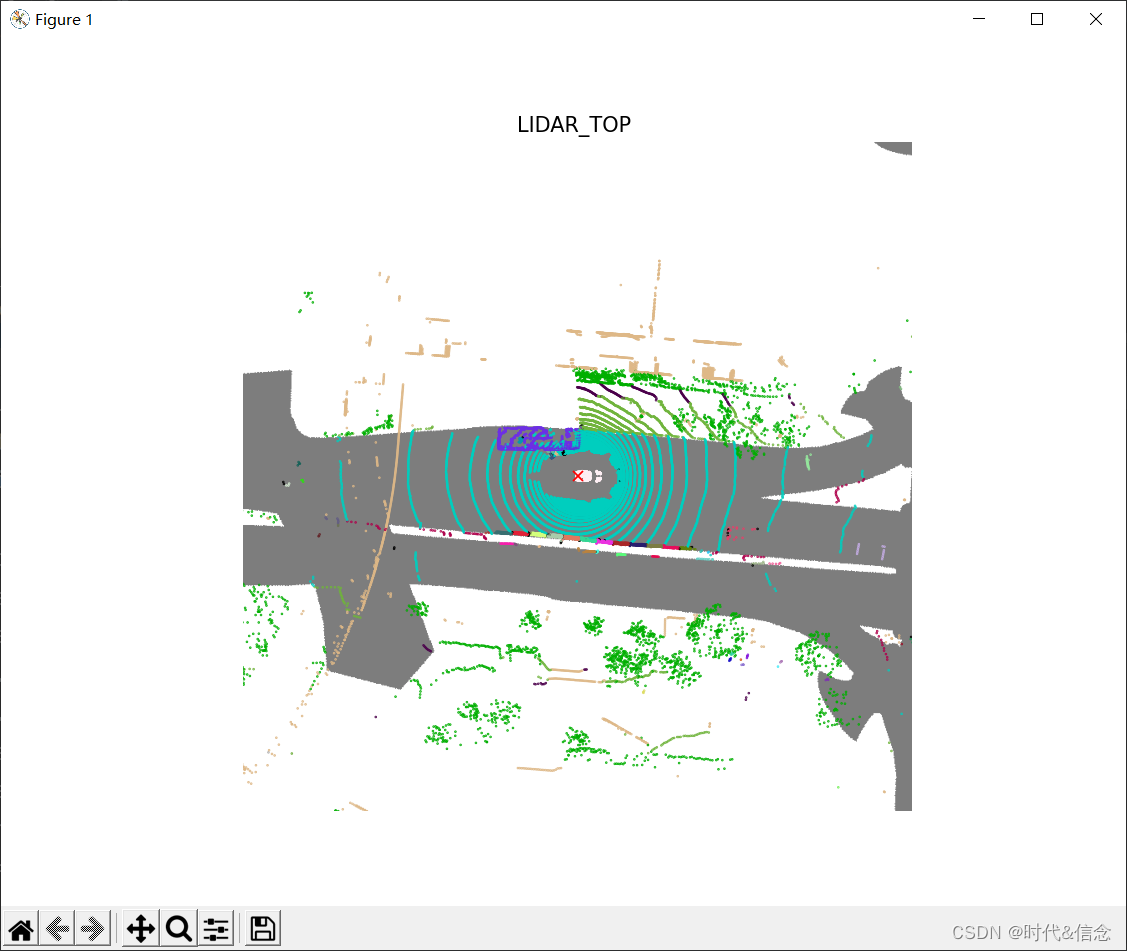
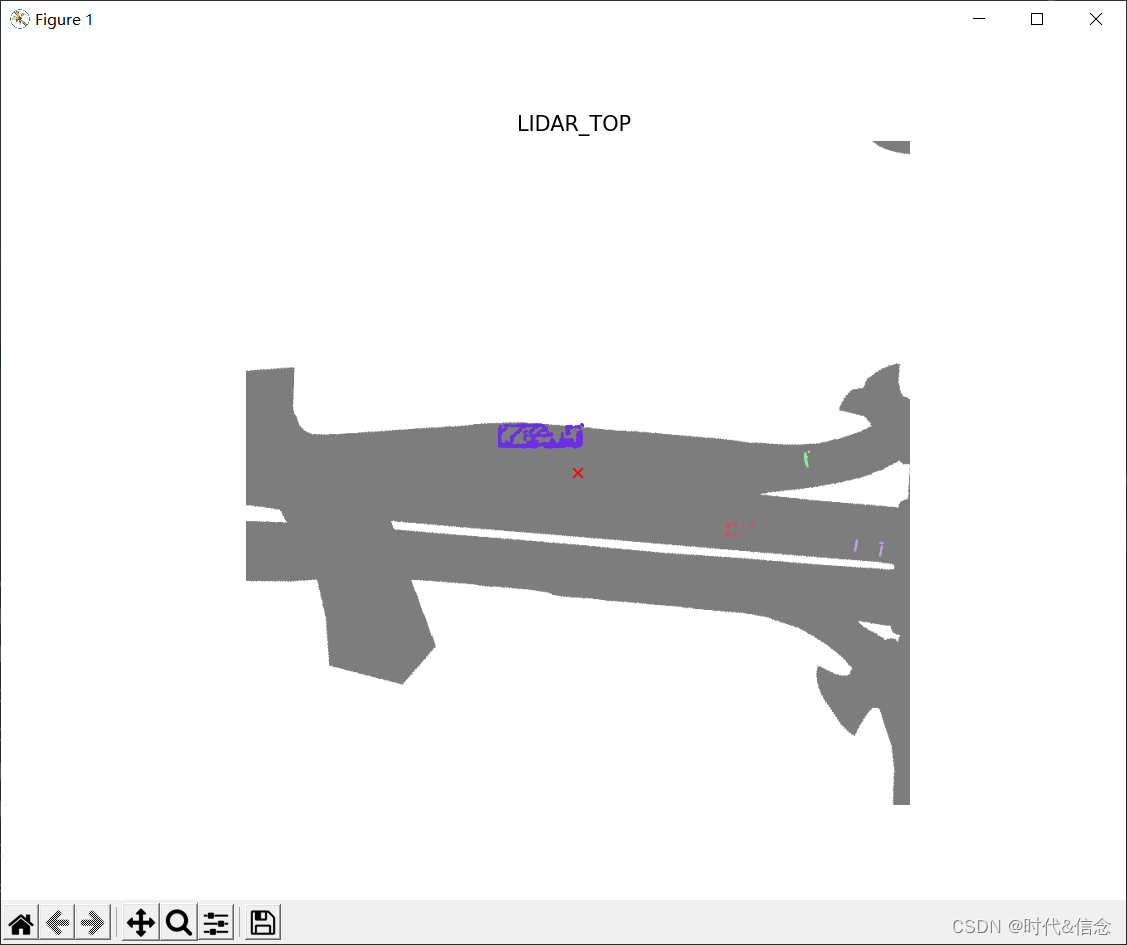
你可以看到同一类别的不同的车辆实例,会显示不同的颜色。类似地,您可以使用filter_lidarseg_labels和show_lidarseg_legend=True来显示特定事物和物品类别的全景标签,以及类别图例。注意这两个参数在lidarseg和panoptic数据集之间也是共享的。
# show trucks and car
nusc.render_sample_data(sample_data_token,
                        with_anns=False,
                        show_panoptic=True,
                        filter_lidarseg_labels=[17, 23])
# show trucks and car
nusc.render_sample_data(sample_data_token,
                        with_anns=False,
                        show_panoptic=True,
                        filter_lidarseg_labels=[17, 23])
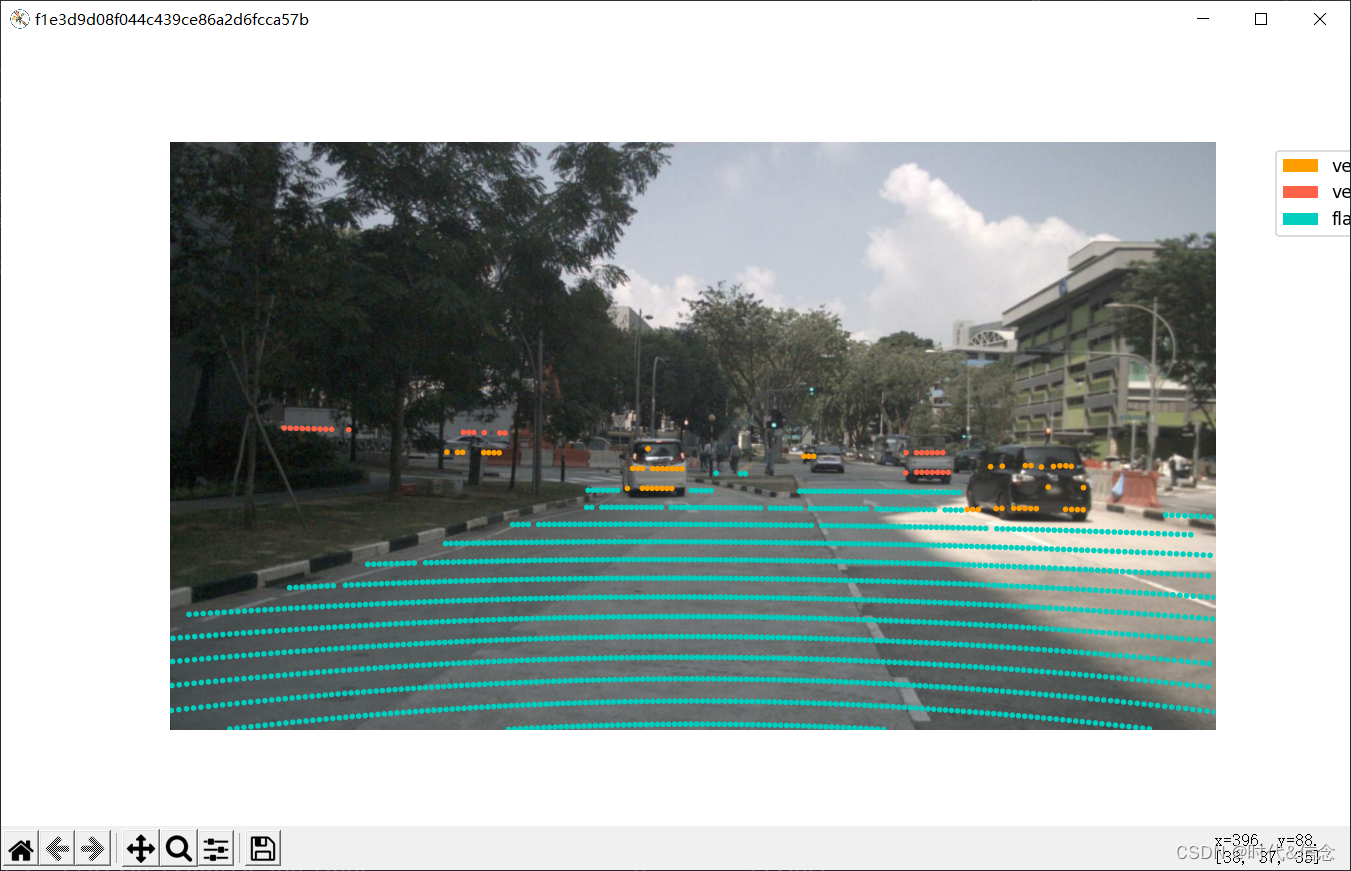
7.在图像中渲染lidarseg和panoptic 标签
如果你想要将点云叠加到相机对应的图像中,你可以像使用原始nuScenes devkit一样使用render_pointcloud_in_image,但是要设置show_lidarseg=True(记住要设置render_intensity=False)。与render_sample_data类似,您可以使用filter_lidarseg_labels过滤查看特定的类。您可以使用show_lidarseg_legend在渲染中显示一个图例。
# nuscenes-lidarseg
# 将点云叠加到相机对应的图像中
nusc.render_pointcloud_in_image(my_sample['token'],
                                pointsensor_channel='LIDAR_TOP',
                                camera_channel='CAM_FRONT',
                                render_intensity=False,
                                show_lidarseg=True,
                                filter_lidarseg_labels=[17, 23, 24],
                                show_lidarseg_legend=True)
同样,这个函数支持show_panoptic=True模式,将显示全景标签而不是语义标签。只显示物品类别的图例。
# nuscenes-panoptic
# 显示全景标签而不是语义标签。只显示物品类别的图例。
nusc.render_pointcloud_in_image(my_sample['token'],
                                pointsensor_channel='LIDAR_TOP',
                                camera_channel='CAM_FRONT',
                                render_intensity=False,
                                show_lidarseg=False,
                                filter_lidarseg_labels=[17, 23, 24],
                                show_lidarseg_legend=True,
                                show_panoptic=True)

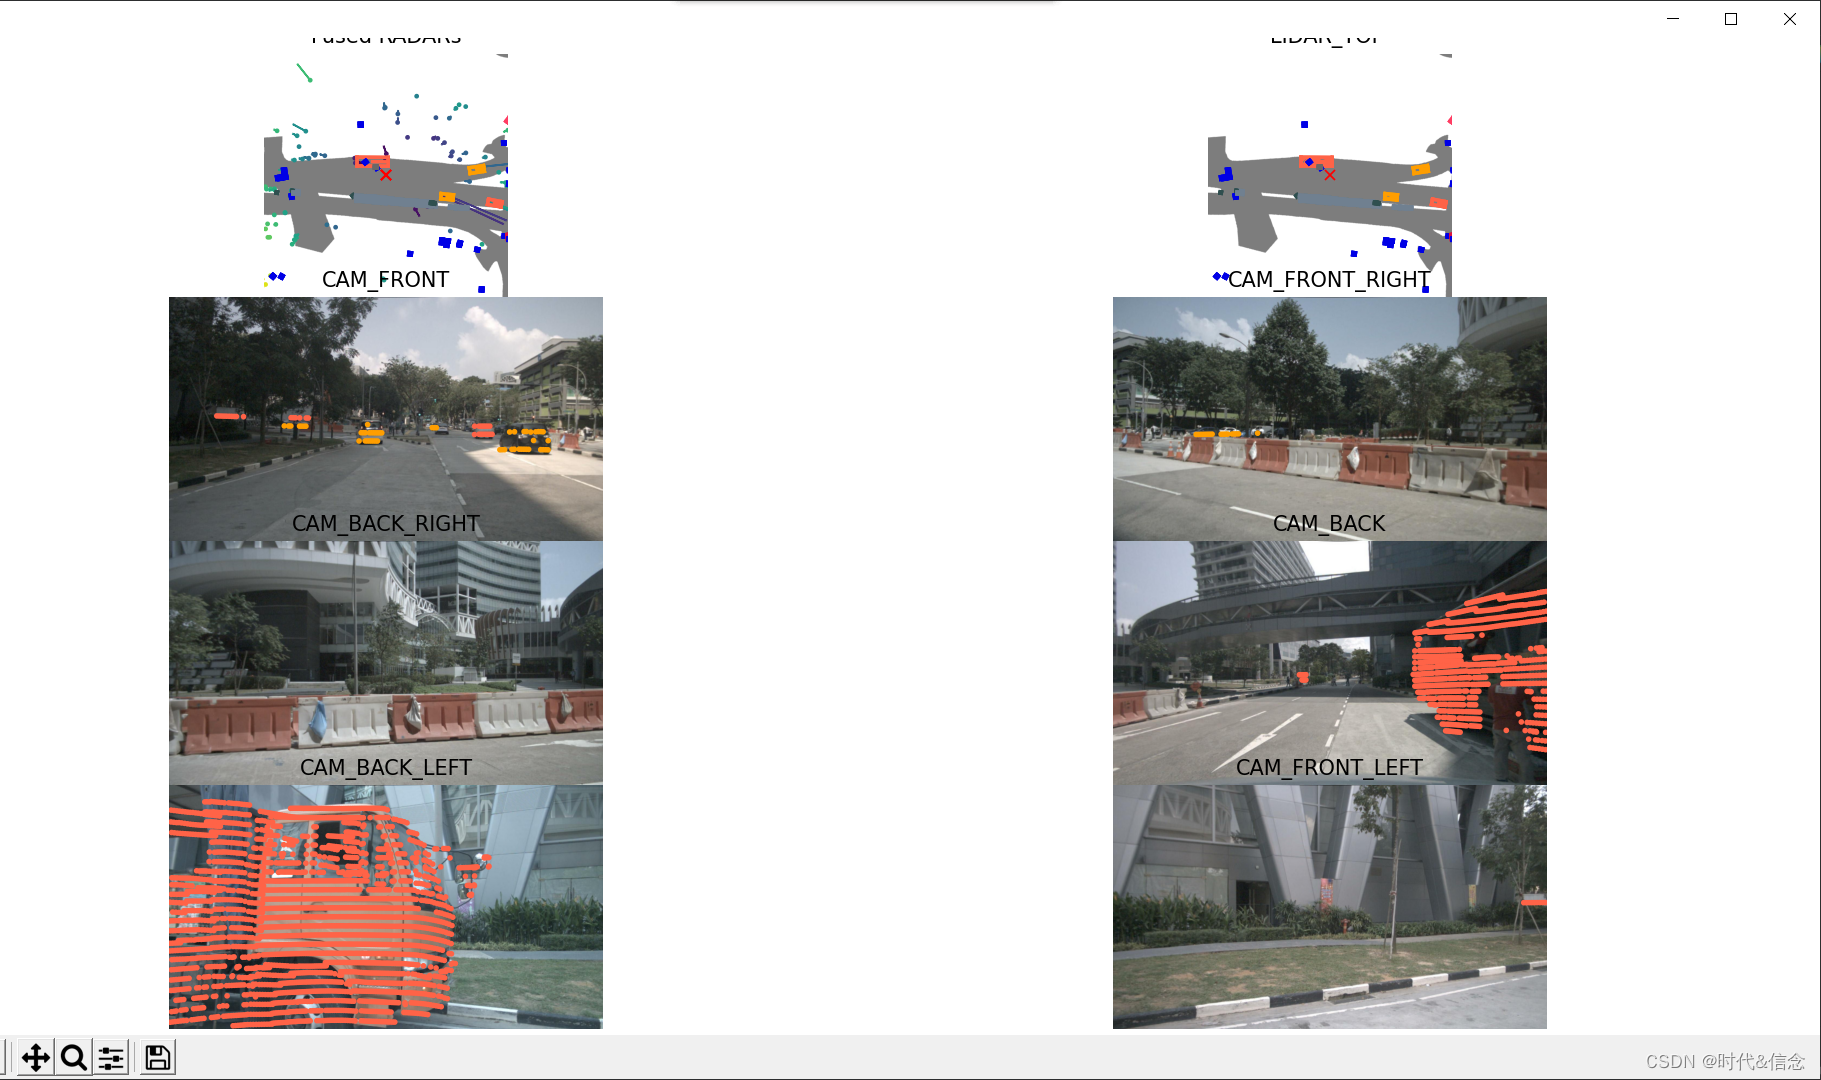
8.渲染sample(例如lidar、radar and all camera)
就像在原始的nuScenes devkit中一样,可以使用render_sample一次渲染所有的传感器。在扩展的nuScenes devkit中,你可以设置show_lidarseg=True来查看lidarseg标签。与上面的方法类似,您可以使用filter_lidarseg_labels只显示您希望看到的类。
# nuscenes-lidarseg
nusc.render_sample(my_sample['token'],
                   show_lidarseg=True,
                   filter_lidarseg_labels=[17, 23])
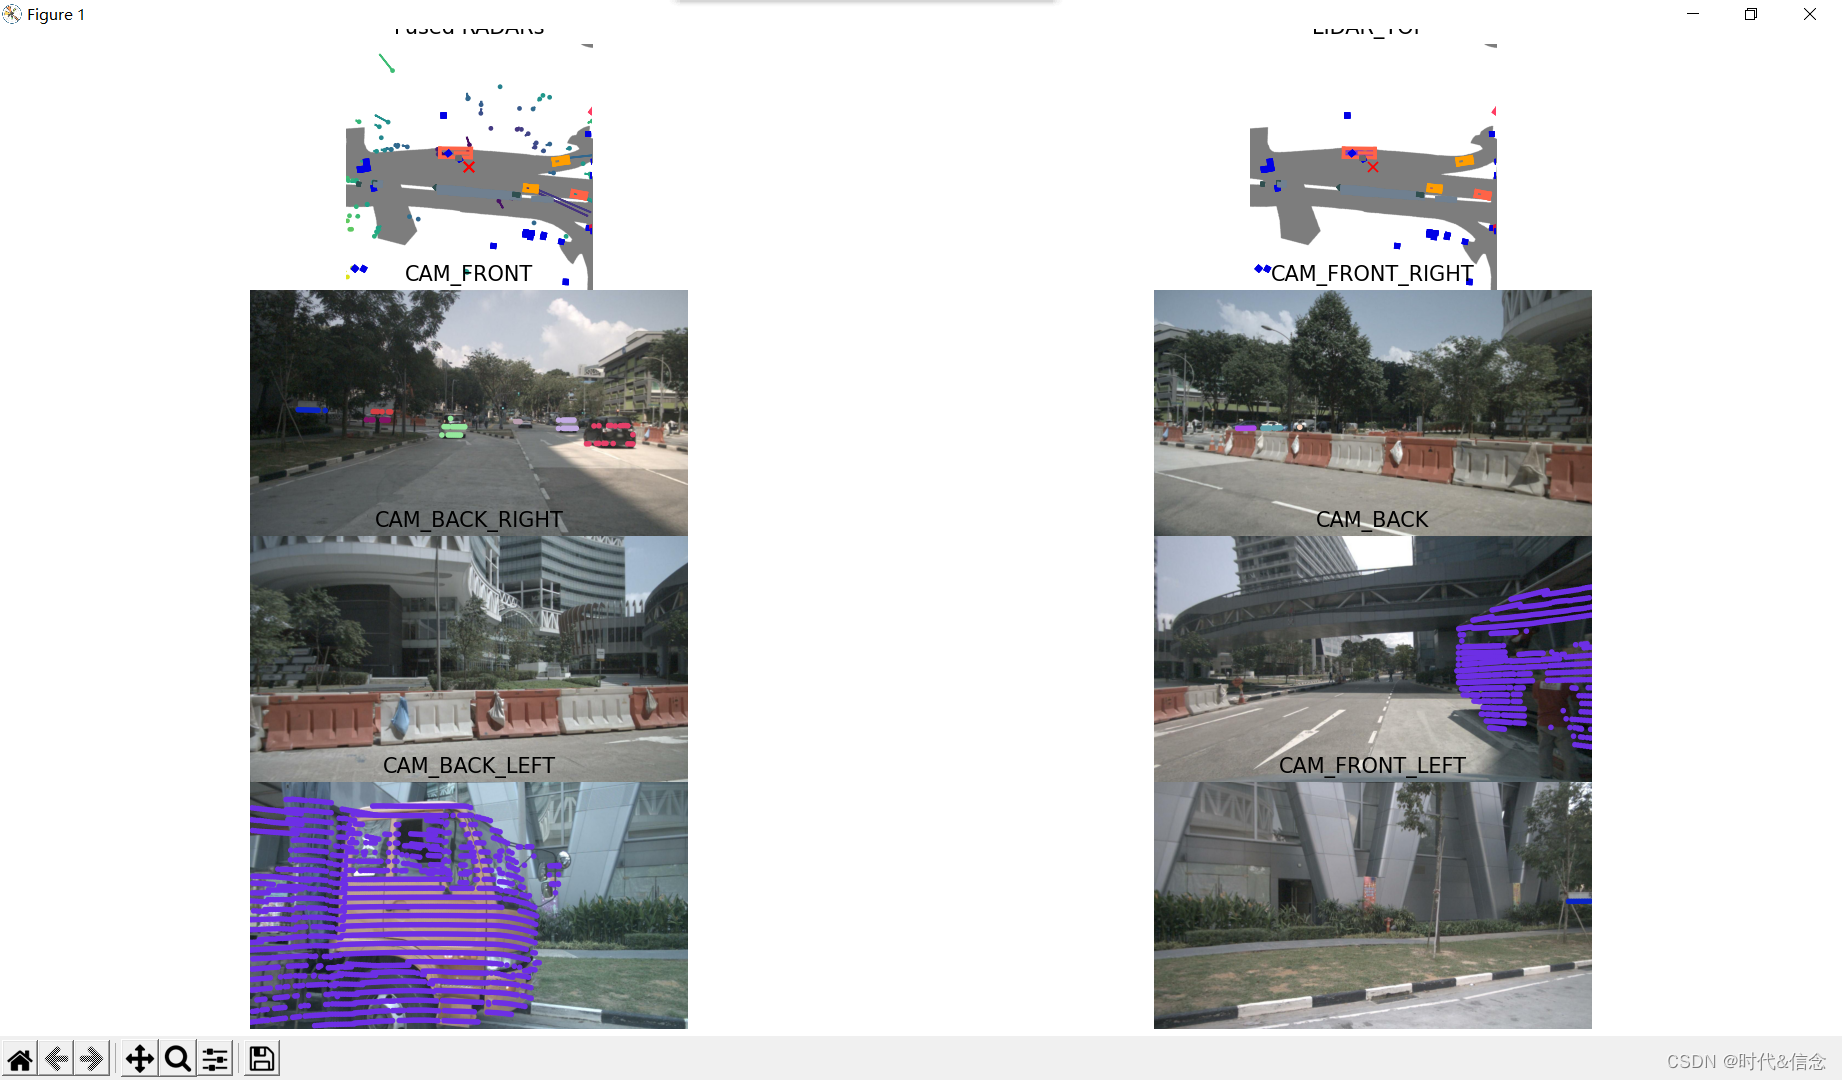
要使用render_sample显示panoptic标签,只需设置show_panoptic=True
# 要使用render_sample显示panoptic标签,只需设置show_panoptic=True
# nuscenes-panoptic
nusc.render_sample(my_sample['token'],
                   show_lidarseg=False,
                   filter_lidarseg_labels=[17, 23],
                   show_panoptic=True)
9.使用lidarseg/panoptic标签为给定的相机传感器渲染场景
你也可以使用你选择的相机的lidarseg标签来渲染整个场景(filter_lidarseg_labels参数也可以在这里使用)。让我们先选一个场景:
my_scene = nusc.scene[0]
然后我们将scene token传递给render_scene_channel_lidarseg,这里设置了filter_lidarseg_labels=[18, 28],表示我们只对建筑车辆和人造物体感兴趣(在这里,我们设置verbose=True来生成一个窗口,让我们可以看到随机的帧)。此外,您还可以使用dpi(调整激光雷达点的大小)和imsize(调整渲染图像的大小)来调整渲染的美学效果。
# nuscenes-lidarseg
nusc.render_scene_channel_lidarseg(my_scene['token'],
                                   'CAM_FRONT',
                                   filter_lidarseg_labels=[18, 28],
                                   verbose=True,
                                   dpi=100,
                                   imsize=(1280, 720))
通过添加show_panoptic=True,这个函数也适用于panoptic标签。
# nuscenes-panoptic
import os
nusc.render_scene_channel_lidarseg(my_scene['token'],
                                   'CAM_BACK',
                                   filter_lidarseg_labels=[18, 24, 28],
                                   verbose=True,
                                   dpi=100,
                                   imsize=(1280, 720),
                                   show_panoptic=True)
10.渲染场景的所有cameras与lidarseg/panoptic标签
你可以用lidarseg标签为所有相机一次性渲染整个场景作为视频。假设在这种情况下,我们对属于driveable surfaces 和 cars【即标签为17、24】的点感兴趣。
# nuscenes-lidarseg
import os
nusc.render_scene_lidarseg(my_scene['token'],
                           filter_lidarseg_labels=[17, 24],
                           verbose=True,
                           dpi=100)
11.可视化激光雷达分割预测
在以上所有函数中,已经渲染的LiDAR点云的标签都是ground truth。如果您已经训练了一个模型来分割LiDAR点云,并在nuScenes-lidarseg数据集上运行它,您也可以使用nuScenes-lidarseg可视化您的模型的预测!你的每个.bin文件应该是numpy.uint8数组。
my_sample = nusc.sample[80]
sample_data_token = my_sample['data']['LIDAR_TOP']
my_predictions_bin_file = os.path.join('./dataset/lidarseg/v1.0-mini', sample_data_token + '_lidarseg.bin')

nusc.render_pointcloud_in_image(my_sample['token'],
                                pointsensor_channel='LIDAR_TOP',
                                camera_channel='CAM_BACK',
                                render_intensity=False,
                                show_lidarseg=True,
                                filter_lidarseg_labels=[22, 23],
                                show_lidarseg_legend=True,
                                lidarseg_preds_bin_path=my_predictions_bin_file)
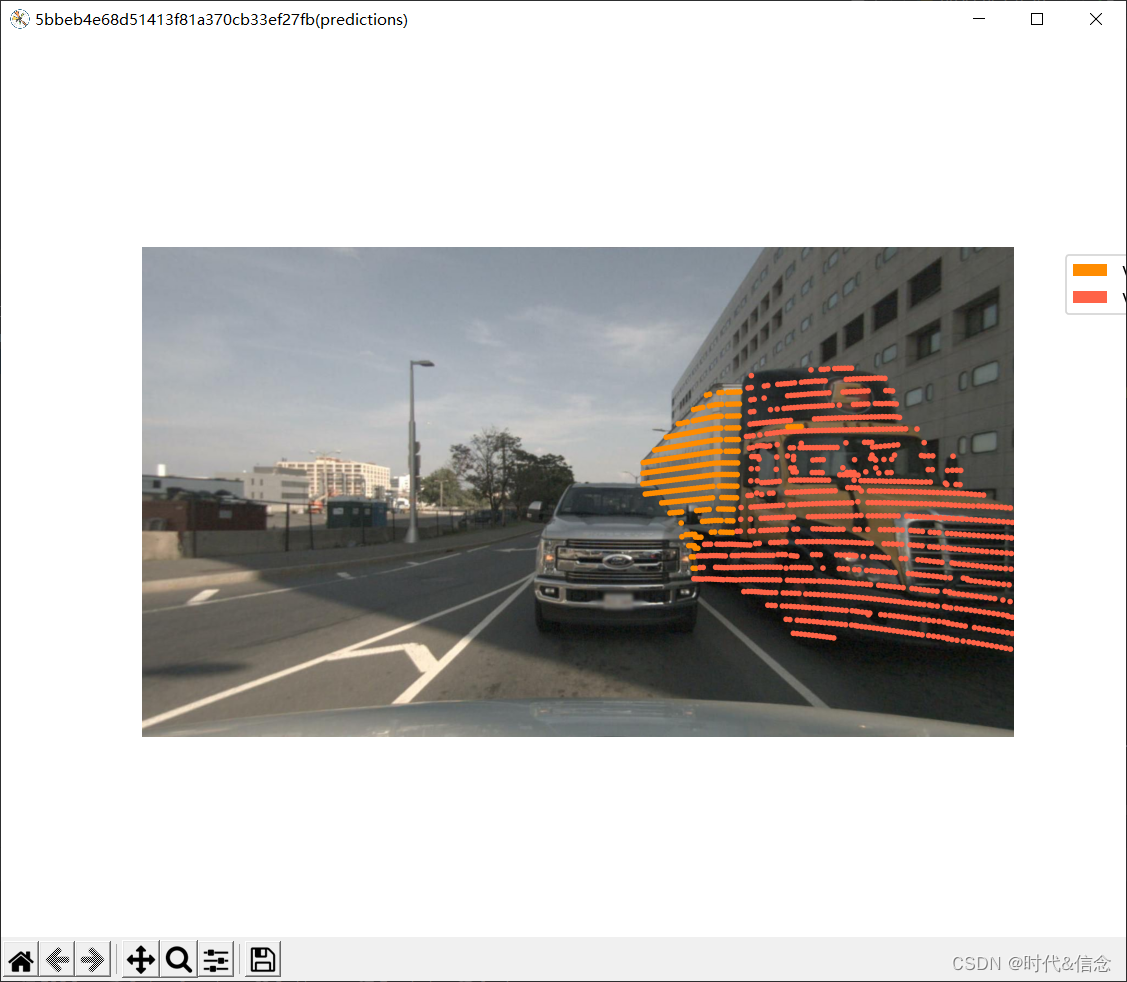
12.可视化激光雷达全景预测
类似地,全景预测结果也可以被渲染!每个.npz文件都应该是一个压缩的 numpy.uint16数组
my_sample = nusc.sample[87]
sample_data_token = my_sample['data']['LIDAR_TOP']
my_predictions_bin_file = os.path.join('./dataset/panoptic/v1.0-mini', sample_data_token + '_panoptic.npz')

nusc.render_pointcloud_in_image(my_sample['token'],
                                pointsensor_channel='LIDAR_TOP',
                                camera_channel='CAM_BACK',
                                render_intensity=False,
                                show_lidarseg=False,
                                filter_lidarseg_labels=[17, 22, 23, 24],
                                show_lidarseg_legend=True,
                                lidarseg_preds_bin_path=my_predictions_bin_file,
                                show_panoptic=True)

本文主要参考:https://blog.csdn.net/qq_47233366/article/details/123551673
完结,撒花撒花…
边栏推荐
- STM32 OLED显示屏
- W25Q16 存储器(Flash)
- 多主复制下处理写冲突(3)-收敛至一致的状态及自定义冲突解决逻辑
- 吴恩达机器学习系列课程笔记——第九章:神经网络的学习(Neural Networks: Learning)
- 科研笔记(六) 基于环境感知的室内路径规划方法
- 【面试】招聘要求
- Research Notes (8) Deep Learning and Its Application in WiFi Human Perception (Part 2)
- CaDDN paper reading of monocular 3D target detection
- 无主复制系统(1)-节点故障时写DB
- 数学建模学习(76):多目标线性规划模型(理想法、线性加权法、最大最小法),模型敏感性分析
猜你喜欢

洛谷P2437蜜蜂路线

Research Notes (8) Deep Learning and Its Application in WiFi Human Perception (Part 2)
ESP32-C5 简介:乐鑫首款双频 Wi-Fi 6 MCU
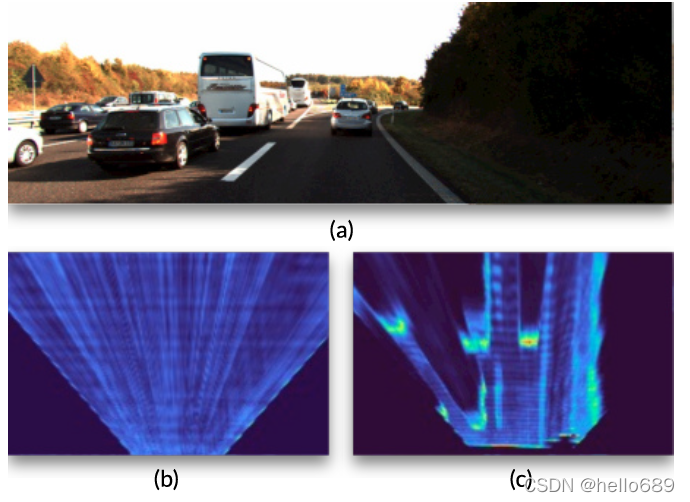
CaDDN paper reading of monocular 3D target detection
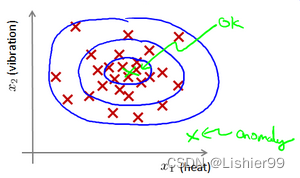
吴恩达机器学习系列课程笔记——第十五章:异常检测(Anomaly Detection)

详解CAN总线:什么是CAN总线?
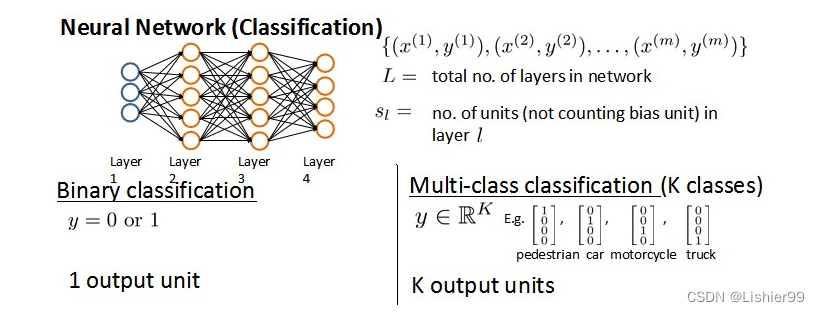
吴恩达机器学习系列课程笔记——第九章:神经网络的学习(Neural Networks: Learning)

日本痴汉打赏女主播1.5亿,结果。。。
![[Win11] PowerShell无法激活Conda虚拟环境](/img/53/464ffb5ef80ce8f6ee19e9ea96c159.png)
[Win11] PowerShell无法激活Conda虚拟环境
W25Q16 存储器(Flash)
随机推荐
Deep Blue Academy - Fourteen Lectures of Visual SLAM - Chapter 4 Homework
P1012 [NOIP1998 提高组] 拼数
Excel如何解密工作表保护
Research Notes (6) Indoor Path Planning Method Based on Environment Perception
列表总结
如何让固定点的监控设备在EasyCVR平台GIS电子地图上显示地理位置?
internship:数据库表和建立的实体类及对应的枚举类之间的联系示例
Visual SLAM Lecture Fourteen - Lecture 13 Practice: Designing a SLAM system (the most detailed code debugging and running steps)
STM32 OLED显示屏
科研笔记(五) SLAC WiFi Fingerprint+ Step counter融合定位
micro-ros arduino esp32 ros2 笔记
Deep Blue Academy - 14 Lectures on Visual SLAM - Chapter 7 Homework
多数据中心操作和检测并发写入
面试官:大量请求 Redis 不存在的数据,从而打倒数据库,有什么方案?
热爱责任担当
1318_将ST link刷成jlink
ScholarOne Manuscripts submits journal LaTeX file and cannot convert PDF successfully!
ROS visualization of 3D target detection
并发性,时间和相对性(1)-确定前后关系
C语言特殊运算符