当前位置:网站首页>Hologres Query管理及超时处理
Hologres Query管理及超时处理
2022-07-04 23:56:00 【胜利的曙光】
通过Hologres的Query管理可以查询SQL的运行信息,设置Query运行的超时时间,更好的管理SQL,防止发生死锁。
查询pg_stat_activity视图信息
select * from pg_stat_activity ;
pg_stat_activity视图的参数说明:
- datid:Hologres后端连接到的数据库的OID。
- datname:Hologres后端连接到的数据库的名称。
- pid:Hologres后端的进程ID。
- usesysid:登录到Hologres后端的用户OID。
- usename:当前连接的用户名。
- application_name:客户端的应用类型。
- client_addr:客户端的IP地址。显示的IP地址可能是被解析过的,不保证一定是源端IP。
- client_hostname:客户端的主机名。
- client_port:客户端的端口。
- backend_start:后台进程开始的时间。
- xact_start:该进程的当前事务被启动的时间。
- 如果没有活动事务,则为空。
- 如果当前查询是该进程的第一个事务,这一列等于query_start。
- query_start:当前活动查询开始的时间,如果当前连接状态不是active,取值为上一个查询开始的时间。
- state_change:连接的状态(state)上一次被改变的时间。
- wait_event_type:后端正在等待的事件类型,如果不存在则为NULL。可能的取值有:
- LWLock:后端正在等待一个轻量级锁。
- Lock:后端正在等待一个重量级锁。
wait_event将标识等待的锁的类型。 - BufferPin:服务器进程正在等待访问一个数据缓冲区,而此时没有其他进程正在检查该缓冲区。
- Activity:服务器进程处于闲置状态。被用于在其主处理循环中等待活动的系统进程。
- Extension:服务器进程正在一个扩展模块中等待活动。
- Client:服务器进程正在等待来自用户应用的某种查询,并且该服务器预期某种与其内部处理无关的事情发生。
- PC:服务器进程正在等待来自服务器中另一个进程的某种活动。
- Timeout:服务器进程正在等待一次超时发生。
- IO:服务器进程正在等待一次IO完成。
- wait_event:如果后端当前正在等待,则是等待事件的名称,否则为 NULL。
- state:表示连接的状态。常见的状态如下:
- active:活跃。
- idle:空闲。
- idle in transaction:长事务中的空闲状态。
- idle in transaction(Aborted):已失败事务中的空闲状态。
- \N: 状态为空,表示非用户连接的进程,一般属于系统后台的维护进程,可以忽略。
- backend_xid:Hologres后端的顶层事务标识符。
- backend_xmin:当前后端的xmin范围。
- query:后端最近执行的查询。如果state为
active,将会显示当前正在执行的查询。在所有其他状态下,显示上一个被执行的查询。 - backend_type:当前后端的类型。可能的类型为autovacuum launcher、autovacuum worker、logical replication launcher、logical replication worker、parallel worker、background writer、client backend、checkpointer、startup、walreceiver、walsender以及 walwriter。除此之外还包括后端的执行组件,例如PQE等。
HoloWeb可视化活跃Query管理
可以通过HoloWeb可视化查看活跃Query,并进行管理。
查看SQL运行信息
Superuser可以查看所有用户的SQL运行信息,RAM用户只能查看自己的SQL运行信息。
1.可以通过如下语句查看当前实例内用户的SQL运行信息。
SELECT datname::text,usename,query,pid::text,state FROM pg_stat_activity;
2.可以执行如下语句查看当前正在运行的SQL信息。
SELECT datname::text,usename,query,pid::text,state
   FROM pg_stat_activity
   WHERE state != 'idle' ;
3.可以执行以下语句查看当前实例正在运行且耗时较长的SQL信息。
SELECT current_timestamp - query_start as runtime, datname::text, usename, query, pid::text
    FROM pg_stat_activity
    WHERE state != 'idle'
    order by 1 desc;
4.终止Query
如果当前存在不符合预期的Query,可以根据实际情况通过如下命令进行终止。
取消当前连接上的Query。
select pg_cancel_backend(<pid>);
批量取消Query。
SELECT pg_cancel_backend(pid)
        ,query
        ,datname::text
        ,usename
        ,application_name
        ,client_addr
        ,client_port
        ,backend_start
        ,state
FROM    pg_stat_activity
WHERE   length(query) > 0
AND     pid != pg_backend_pid()
AND     backend_type = 'client backend'
AND     application_name != 'hologres'
AND     usename != 'holo_admin'
AND     query not like '%pg_cancel_backend%';
修改活跃Query超时时间
-- session 级别修改(要修改超时时间的SQL语句一起执行方可生效)
set statement_timeout = <time>;
-- db 级别修改
alter database dbname set statement_timeout=<time>;
time超时时间取值范围为0~2147483647ms,单位默认为ms(当time后加单位时需要使用单引号,否则会报错)。当前默认超时时间为8小时。
示例如下:
设置超时时间为10min,其中具体时间带单位,10min需要整体添加单引号。
set statement_timeout = '10min' ;
select * from tablename;
设置超时时间为5000ms。
set statement_timeout = 5000 ;
select * from tablename;
设置db超时时间为10min。
alter database dbname set statement_timeout='10min';
查询设置是否生效:
show statement_timeout;
修改空闲Query超时时间
参数idle_in_transaction_session_timeout描述了事务进入idle状态后的超时行为,如果不设置参数值,默认不会做事务超时的释放,容易发生事务不释放,导致查询被锁死的情况。
当Query执行产生死锁时,需要设置超时时间。例如如下代码,未执行commit,开启了一个事务,但是没有提交,会造成事务泄漏,进而引发数据库级别的死锁,影响服务正常使用。
begin;
select * from t;
当出现这种死锁场景时,可以通过设置idle_in_transaction_session_timeout超时时间来解决。当一个带事务的空闲连接超过idle_in_transaction_session_timeout设置的时间还未提交或者回滚事务,系统将自动根据超时时间回滚事务,并关闭连接。
--session修改空闲事务超时时间
set idle_in_transaction_session_timeout=<time>;

--DB级别修改空闲事务超时时间
alter database db_name set idle_in_transaction_session_timeout=<time>;
time超时时间取值范围为0~2147483647ms,单位默认为ms(当time后加单位时需要使用单引号,否则会报错)。在Hologres V0.10及以下版本,默认值为0,即不会自动清理;在Hologres V1.1版本,默认值为10分钟,超过10分钟后将会回滚事务。
不建议超时时间设置过短,如果过短容易错误回滚正在使用中的事务。
设置超时时间为300000ms。
--session修改空闲事务超时时间
set idle_in_transaction_session_timeout=300000;

--DB级别修改空闲事务超时时间
alter database db_name set idle_in_transaction_session_timeout=300000;
查询设置是否生效:
show idle_in_transaction_session_timeout;
参考文献:https://help.aliyun.com/document_detail/263548.html
边栏推荐
- 端口映射和端口转发区别是什么
- 企业里Win10 开启BitLocker锁定磁盘,如何备份系统,当系统出现问题又如何恢复,快速恢复又兼顾系统安全(远程设备篇)
- Acrel-EMS综合能效平台在校园建设的意义
- He worked as a foreign lead and paid off all the housing loans in a year
- Meet ThreadPoolExecutor
- Pytoch --- use pytoch to realize linknet for semantic segmentation
- 人生无常,大肠包小肠, 这次真的可以回家看媳妇去了。。。
- 企业应用业务场景,功能添加和修改C#源码
- Blue sky nh55 series notebook memory reading and writing speed is extremely slow, solution process record
- 圖解網絡:什麼是網關負載均衡協議GLBP?
猜你喜欢

The company needs to be monitored. How do ZABBIX and Prometheus choose? That's the right choice!

Microservice
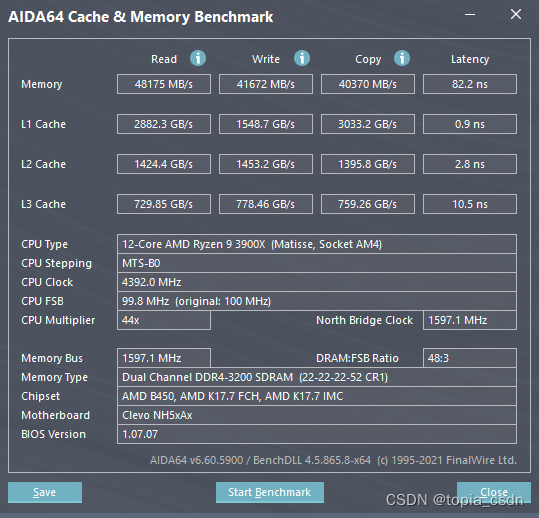
Blue sky nh55 series notebook memory reading and writing speed is extremely slow, solution process record

快解析——好用的内网安全软件
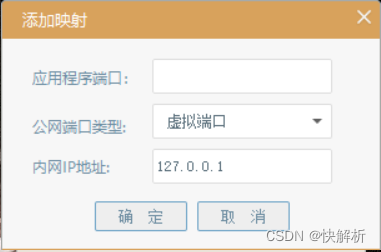
如何在外地外网电脑远程公司项目?

Using the uniapp rich text editor

Skills in analyzing the trend chart of London Silver
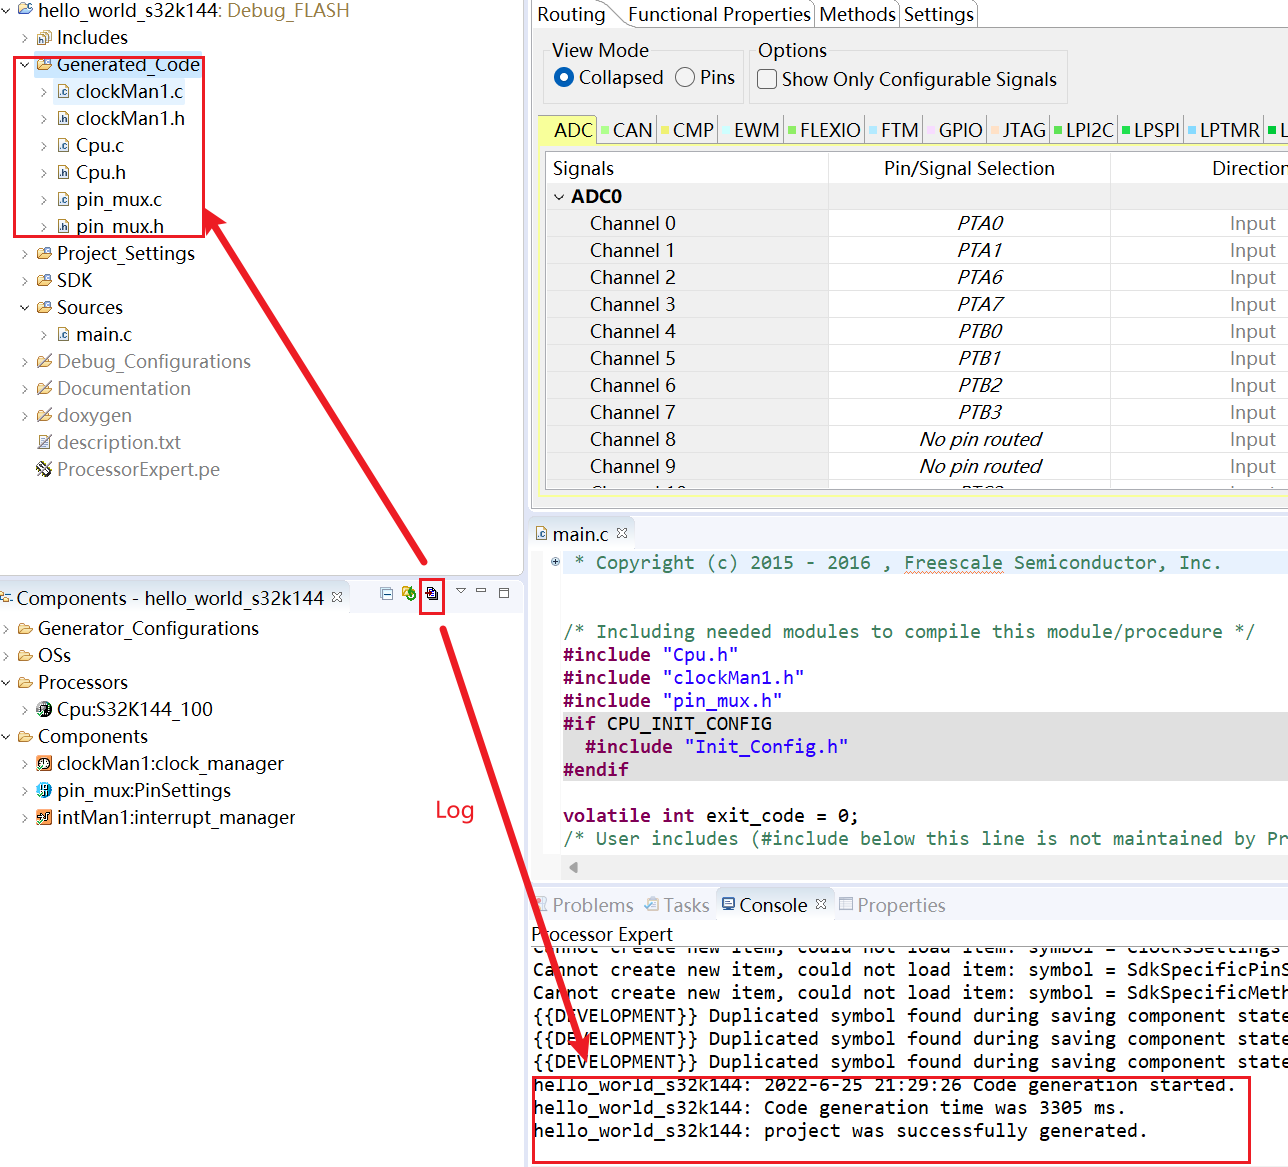
S32 design studio for arm 2.2 quick start

Ap8022 switching power supply small household appliances ACDC chip offline switching power supply IC
微服务(Microservice)那点事儿
随机推荐
基于三维gis平台的消防系统运用
[论文阅读] TUN-Det: A Novel Network for Thyroid Ultrasound Nodule Detection
Jar batch management gadget
香港珠宝大亨,22亿“抄底”佐丹奴
[Peking University] tensorflow2.0-1-opening
How to apply for PMP project management certification examination?
PermissionError: [Errno 13] Permission denied: ‘data. csv‘
微服务(Microservice)那点事儿
Examples of time (calculation) total tools: start time and end time of this year, etc
How long does it take to obtain a PMP certificate?
uniapp 除了数字,其他输入无效
Why does infographic help your SEO
Réseau graphique: Qu'est - ce que le Protocole d'équilibrage de charge de passerelle glbp?
Is it safe to open and register new bonds? Is there any risk? Is it reliable?
Significance of acrel EMS integrated energy efficiency platform in campus construction
45 year old professor, she threw two super unicorns
Go step on the pit - no required module provides package: go mod file not found in current directory or any parent
如何用快解析自制IoT云平台
Introduction to ACM combination counting
The Chinese output of servlet server and client is garbled