author : Zhizhen
be based on Prometheus In the monitoring practice , Especially when the scale is large , The storage and query of time series data is very important , And there are many problems . How to deal with long-term queries with large amounts of data , Native Prometheus The system does not give a satisfactory answer . Regarding this ,ARMS Prometheus Recently, the downsampling function has been launched , A new attempt has been made to solve this problem .
Preface
The problem background
Prometheus And K8s As a pair of golden partners in the cloud primary era , It is the standard configuration of many enterprise operating environments . However , In order to adapt to the business scale and the development and evolution of microservices , The number of monitored objects will increase ; In order to more completely reflect the state details of the system or application , The granularity division of indicators is becoming more and more detailed , The number of indicators is increasing ; In order to find the trend change of longer cycle , The retention period of indicator data is bound to be longer . All these changes will eventually lead to an explosive increase in the amount of monitoring data , Storage for observation products 、 Inquire about 、 Calculation brings great pressure .
We can use a simple scenario , To more intuitively feel the consequences of this data explosion . If we need to query all nodes of my cluster in recent one month CPU Changes in dosage , My cluster is a 30 A small cluster of physical nodes , On average, each node runs 50 Need to collect indicators POD, By default 30 Second acquisition interval , We need to deal with the collection target share 30
50 = 1500 individual , Each sampling point will be captured every day 60
60*24/30 = 2880 Time , In a one month cycle , share 1500 * 2880 * 30 = 1.3 100 million index grabs , With Node exporter For example , A bare machine grabs and spits out sample on the order of 500, In a month, the cluster will generate about 1.3 Billion * 500 = 650 One hundred million ! In real business systems , The situation is often not so ideal , The actual number of sampling points often exceeds 100 billion .
In the face of this situation , We must have some technical means , On the premise of ensuring the accuracy of data as much as possible , For storage / Inquire about / Optimize and improve the cost and efficiency of calculation . Downsampling (DownSampling) Is one of the representative ideas .
What is downsampling
Downsampling is based on such a premise : Data processing conforms to the law of Association , Combination of values of multiple sampling points , It will not affect the final calculation result , It happened that Prometheus The time series data of meets such characteristics . Downsampling, in other words, reduces the resolution of the data , The idea is very direct , If the data points within a certain time interval , Based on certain rules , Aggregate into one or a set of values , So as to reduce the number of sampling points , Reduce the amount of data , Reduce the pressure of storing query calculation . So we need two inputs : The time interval , Aggregation rules .
For the time interval of downsampling , Based on empirical analysis , We define two different downsampling intervals : Five minutes and one hour , Plus the raw data , Will get three different resolution The data of , According to the query conditions, the query requests are automatically routed to different resolution The data of . With the following ARMS Prometheus Provide longer storage duration options , We may also add new interval options .
For aggregation rules , Through to Prometheus Analysis of operator function of , Various operator functions can finally be summarized into six types of numerical calculations :
thus it can be seen , For a series of sampling points in the time interval , We only need to calculate the aggregate eigenvalues of the above six types , When querying, you can return the aggregate value of the corresponding time interval . If the default scrape interval by 30 second , Five minutes of downsampling will aggregate ten points into one point ; One hour downsampling , Will 120 Points converge into a point , Similarly, query the sampling points involved , There will be an order of magnitude decline , If scrape interval smaller , Then the effect of sample point reduction will be more significant . On the one hand, the reduction of sampling points reduces TSDB Read pressure , On the other hand, the computing pressure of the query engine will also be reduced synchronously , And then effectively reduce the query time .
How to realize downsampling
His shan zhishi
Other open source / Commercial sequential data storage implementation , Some also use the downsampling function , Optimize and improve long-span queries , Let's also get to know .
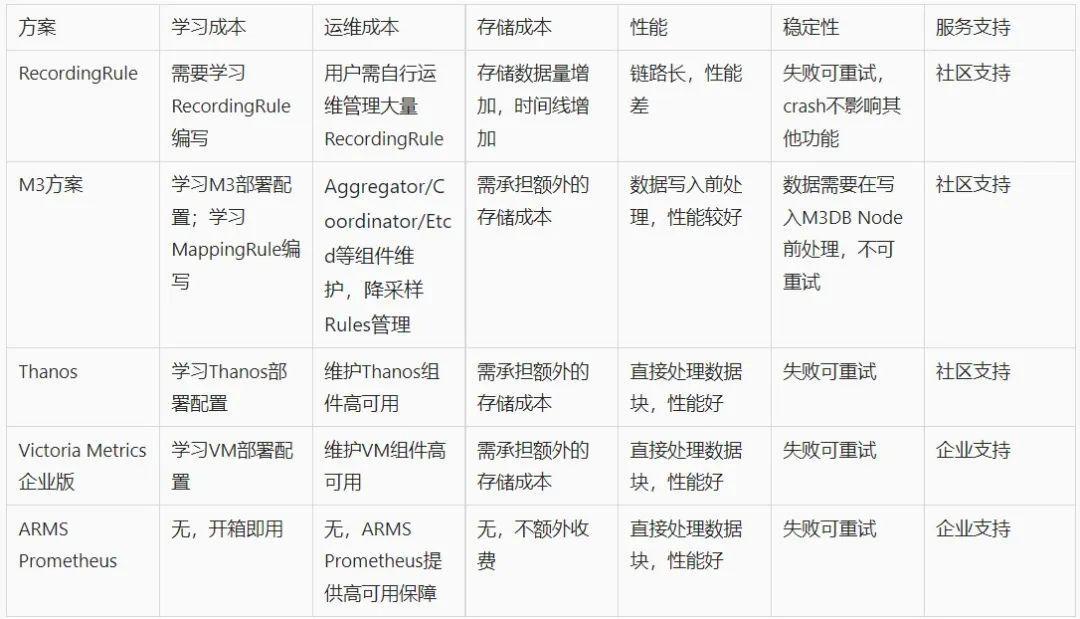
Open source Prometheus Storage capacity , It has always been a point of criticism , Open source Prometheus It does not directly provide the ability of downsampling , But provided Recording Rule Ability , Users can use Recording Rule From row implementation DownSampling, But this will create a new timeline , In a high cardinality scenario , Instead, it further aggravates the storage pressure .
As a well-known Prometheus Highly available storage solutions ,Thanos It provides a relatively perfect downsampling scheme .Thanos In the implementation of downsmpling The functional components are compactor, He will :
On a regular basis from ojbect storage Middle pull block( The original Prometheus Block,2 Hour time span ), Conduct compaction and downsampling,downsampling The status of will be recorded to block metadata.
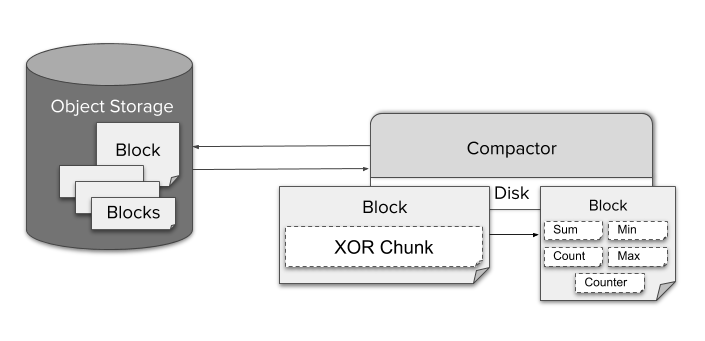
Downsampling The following eigenvalues include sum/count/max/min/counter, Write special aggrChunks In the data block . When making a query :
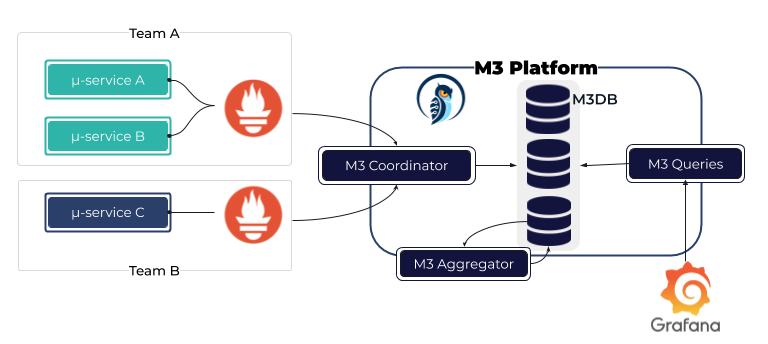
M3 Aggregator Responsible for storing indicators in M3DB front , Flow aggregation index , And according to storagePolicy Specify the storage duration of the indicator and the sampling interval of the calculation window .
M3 The supported data interval is more flexible , More eigenvalues , Include histogram quantile function .
Victoria Metrics At present, the downsampling function is only available in the commercial version , The open source version is not revealed .InfluxDB Open source version of (v2.0 Before ) Through something like Recording Rule The way , Execute the original data that has been dropped outside the storage medium continuous query To achieve downsampling .Context Downsampling is not yet supported .
How do we do
There are different downsampling schemes in the market , We briefly summarized their use costs and other concerns of users , The comparison is as follows :
ARMS Prometheus Treatment TSDB How to store blocks , The original data block is automatically processed into a downsampling data block by the background , On the one hand, it can achieve a better processing performance , On the other hand, for end users , There is no need to care about parameter configuration rule maintenance, etc , Reduce the burden of user operation and maintenance as much as possible .
This function has been implemented in Alibaba cloud region go online , And start the directional invitation experience . In the upcoming ARMS Prometheus Advanced version , Integrate and provide this function by default .
The impact of downsampling on queries
After we have finished downsampling at the sampling point level , Is it easy to solve the long-term query problem ? Obviously not ,TSDB Only the most original materials are saved in , And the curve seen by the user , It also needs to be calculated and processed by the query engine , In the process of calculation and processing , We face at least two problems :
Q2: After downsampling, the density of data points is smaller , The data is more “ sparse ”, Will the query performance be consistent with the original data ? Users need to adjust PromQL Well ?
For the first question ,ARMS Prometheus According to the user's query statements and filter conditions , Intelligently select the appropriate time granularity , Make an appropriate balance between data details and query performance .
For the second question , First of all, we can say the conclusion :
The density of the acquisition point has a great influence on the result calculation , but ARMS Prometheus The differences are shielded at the query engine level , Users do not need to adjust PromQL.
This influence is mainly reflected in three aspects : And query statements duration The impact between , With the query request step The impact between , And the influence on the operator itself , Next, we will explain in detail the impact of these three aspects , as well as ARMS Prometheus Work done in these three aspects .
duration And downsampling calculation results
We know ,PromQL Intermediate interval vector (Range Vector) When inquiring , Will bring a time interval parameter (time duration), Used to frame a time range , Used to calculate the results . For example, query statements http_requests_total{job="prometheus"}[2m] in , designated duration That's two minutes , When calculating the result , You will find time series In two minutes , Split into several vector, Pass to function Do calculations , And return the results respectively .duration It's a direct decision function The input length that can be obtained during calculation , The impact on the results is obvious .
In general , The interval between acquisition points is 30s Or shorter , as long as time duration More than that , We can determine each split vector in , There will be several samples, Used to calculate the results . After downsampling , The data point interval will become larger ( Five minutes or even an hour ), This may happen vector There is no value in , This leads to function The calculation results are intermittent . In this case ARMS Prometheus It will automatically adjust the operator time duration Parameters to deal with , Guarantee duration Not less than that of downsampling resolution, That is to ensure that every ventor There will be sampling points in , Ensure the accuracy of the calculation results .
step And downsampling calculation results
duration Parameters determine PromQL Calculation vector Of ” length “, and step Parameters determine vector Of ” Stepping “. If the user is in grafana Query on ,step The parameter is actually determined by grafana Calculated according to the page width and query time span , Take my personal computer for example , time span 15 Tianshi default step yes 10 minute . For some operators , Because the density of sampling points decreases ,step It may also cause jump of calculation results , Let's say increase As an example, simply analyze .
Under normal circumstances ( The sampling points are uniform , nothing counter Reset ),increase The calculation formula of can be simplified as ( Tail value - Initial value )x duration /( Tail timestamp - First timestamp ), For general scenes , The first / Tail point and start / Interval of ending time , Not more than scrape interval, If duration Than scrape interval Much larger , The result is about equal to ( Tail value - Initial value ). Suppose there is a group of down sampled counter The data points , as follows :
sample1: t = 00:00:01 v=1
sample2: t = 00:59:31 v=1
sample3: t = 01:00:01 v=30
sample4: t = 01:59:31 v=31
sample5: t = 02:00:01 v=31
sample6: t = 02:59:31 v=32
...
Hypothetical query duration For two hours ,step by 10 minute , Then we will get the divided vector, as follows :
slice 1:  Starting and ending time  00:00:00 / 02:00:00 [sample1 ... sample4]
slice 2:  Starting and ending time  00:10:00 / 02:10:00 [sample2 ... sample5]
slice 3:  Starting and ending time  00:20:00 / 02:20:00 [sample2 ... sample5]
...
In the raw data , The interval between the beginning and end points and the start and end time , Not more than scrape interval, And the data after downsampling , The interval between the start and end points and the start and end time can be up to (duration - step). If the sampling point value changes gently , Then the calculation result after downsampling will not be significantly different from the calculation result of the original data , But if one slice The median value of the interval changes violently , Then according to the above calculation formula ( Tail value - Initial value )x duration /( Tail timestamp - First timestamp ), Will magnify this change proportionally ,
Give Way
The curve finally displayed fluctuates more violently
. This result we think is normal , At the same time, the index changes violently (fast-moving counter) In the scene of ,irate It will be more applicable , This is also consistent with the recommendations of the official documents .
Operator and downsampling calculation results
The calculation results of some operators are similar to samples Quantity is directly related to , The most typical is count_over_time , In the statistical time interval samples Number , Downsampling itself is to reduce the number of points in the time interval , So this situation needs to be in Prometheus engine Do special treatment in , When it is found that the downsampling data is used , Adopt new calculation logic to ensure the correctness of the results .
Comparison of downsampling effect
For users , What I finally feel is the improvement of query speed , But how big is the increase , We also verify and compare through two queries .
The test cluster has 55 individual node, share pod 6000+, The total number of sampling points reported every day is about 100 Billion , Data storage cycle 15 God .
The first round of comparison : The query efficiency
Query statement :
sum(irate(node_network_receive_bytes_total{}[5m])*8) by (instance)
That is, query each in the cluster node Received network traffic , The query period is 15 God .
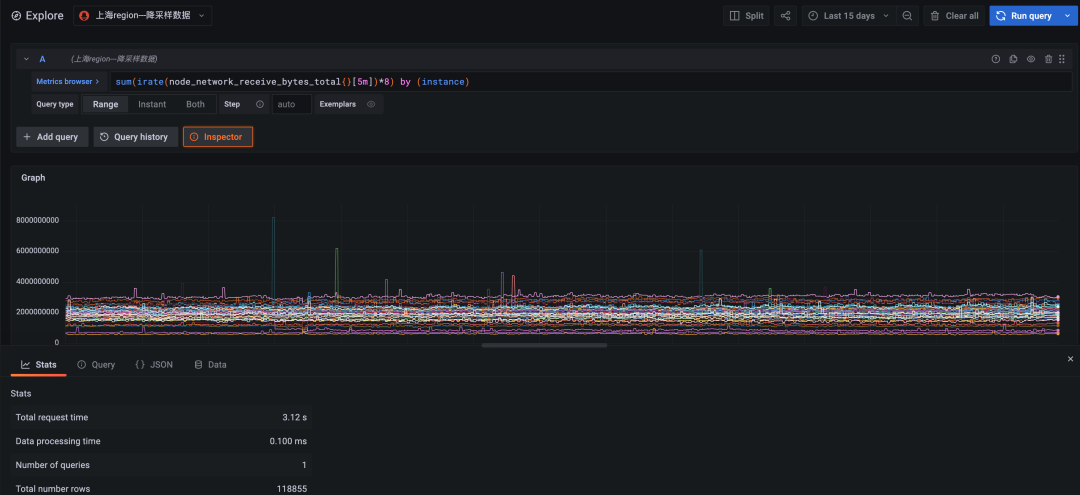
chart 1: Downsampling data query , The time span is 15 days , Query time consuming 3.12 second
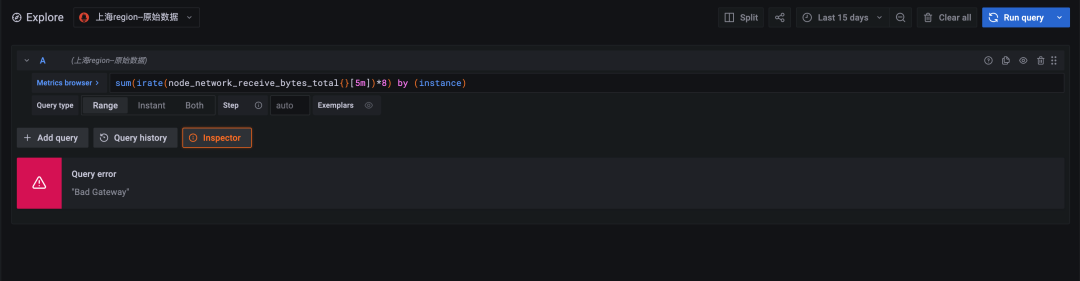
chart 2: Raw data query , The time span is 15 days , Query timeout ( Timeout time 30 second )
The calculation of the original data timed out due to the large amount of data , Failed to return . Downsampling queries are at least ten times more efficient than original queries .
The second round of comparison : The accuracy of the results
Query statement :
max(irate(node_network_receive_bytes_total{}[5m])*8) by (instance)
That is, query each node On , Receive the traffic data of the network card with the largest amount of data .
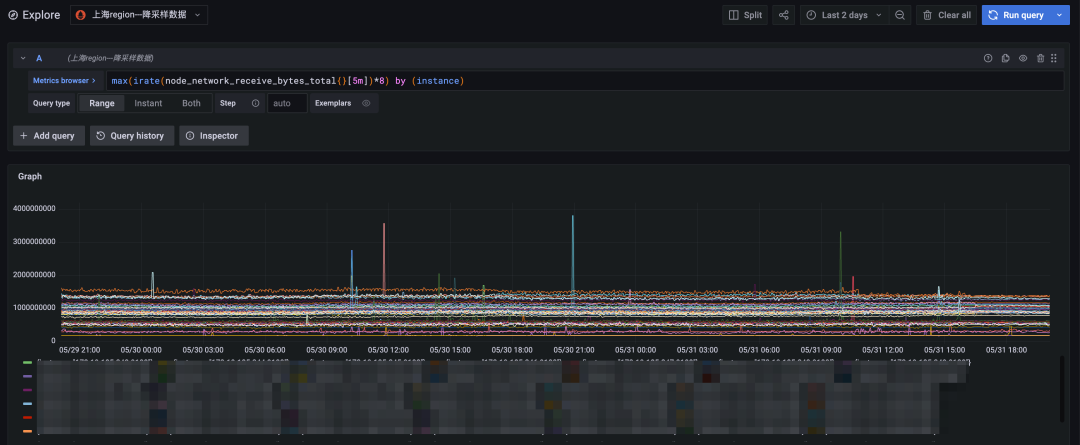
chart 3: Downsampling query , The time span is two days
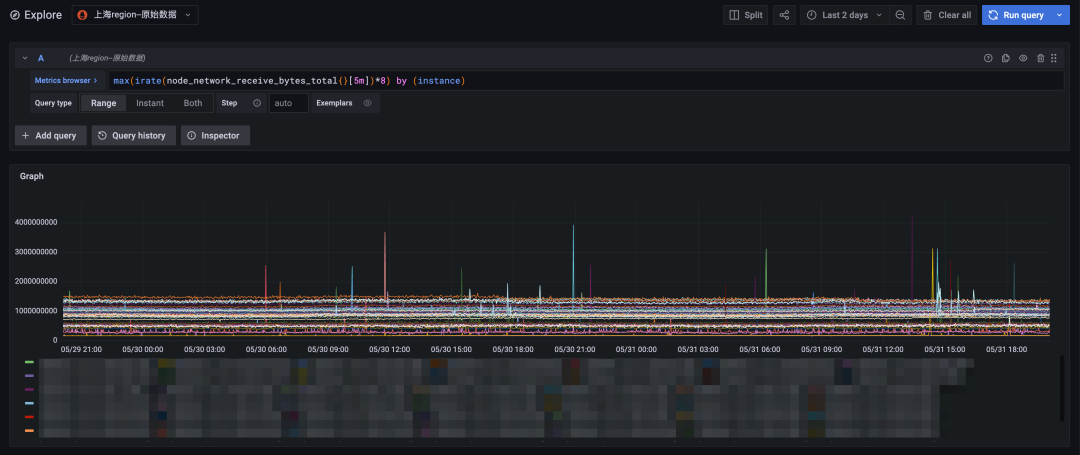
chart 4: Raw data query , The time span is two days
Finally, we will shorten the query time span to two days , The original data query can also be returned faster . Compare the downsampling query results ( Upper figure ) And original data query results ( The figure below ) so , The number of time lines of the two is completely consistent with the overall trend , The points with violent data changes can also fit well , It can fully meet the needs of long-term periodic query .
Conclusion
Alicloud on 6 month 22 The Alibaba cloud observable suite was officially released on the th (Alibaba Cloud Observability Suite,ACOS). Alibaba cloud's observable suite revolves around Prometheus service 、Grafana Service and link tracking service , Forming index storage analysis 、 Link storage analysis 、 Observable data layer for heterogeneous data source integration , At the same time, the standard PromQL and SQL, Provide data display , Alarm and data exploration capability . by IT Cost management 、 Enterprise risk governance 、 Intelligent operation and maintenance 、 Different scenarios such as business continuity guarantee endow data value , Let observable data really do more than observation .
among ,** Alibaba cloud Prometheus Monitoring is for multiple instances 、 Large amount of data 、 High timeline base 、 Long time span 、 Extreme scenarios such as complex queries , Gradually launched global aggregate query , Streaming query , Downsampling , Various targeted measures such as pre polymerization .
At present 15 Day free trial 、Prometheus Monitor promotional activities such as cost reduction of basic indicators of container clusters !
Click on
, Opening service ~
原网站版权声明
本文为[InfoQ]所创,转载请带上原文链接,感谢
https://yzsam.com/2022/185/202207042252188858.html