当前位置:网站首页>Ebpf cilium practice (2) - underlying network observability
Ebpf cilium practice (2) - underlying network observability
2022-07-07 08:18:00 【Rainbond】
In the previous platform , There is no direct observability for the network flow between components , There is a problem in the communication between user components , Manual troubleshooting can only be performed through traditional command-line tools , and cilium Of Hubble Services can provide UI The interface shows users the real-time traffic status , At the same time, these indicators can be exposed to Prometheus Aggregate finishing , So that users can observe and monitor the underlying network state more intuitively .
Turn on Hubble UI service
cilium The observability of the network is determined by Hubble Services provide , In the installation cilium when , Not installed by default Hubble , You can turn on... With the following command Hubble service
helm upgrade cilium cilium/cilium --version 1.11.2 \ --namespace kube-system \ --reuse-values \ --set hubble.relay.enabled=true \ --set hubble.ui.enabled=trueAfter deployment , The status can be determined by the following command
$ kubectl get po -n kube-system |grep hubblehubble-relay-65ff5f9bf6-247pt 1/1 Running 0 5d19hhubble-ui-5f7cdc86c7-gq5hs 3/3 Running 0 5d19h$ kubectl get svc -n kube-system | grep hubblehubble-relay ClusterIP 10.43.73.95 <none> 80/TCP 5d19hhubble-ui ClusterIP 10.43.20.190 <none> 80/TCP 5d19hHubble After deployment , It is not directly accessible outside the cluster , You can open external access in the following ways
Temporarily open
When executing commands, you can use
IP:12000visit UI Interface , After exiting the command, you cannot continue to accesscilium hubble uiFor a long time
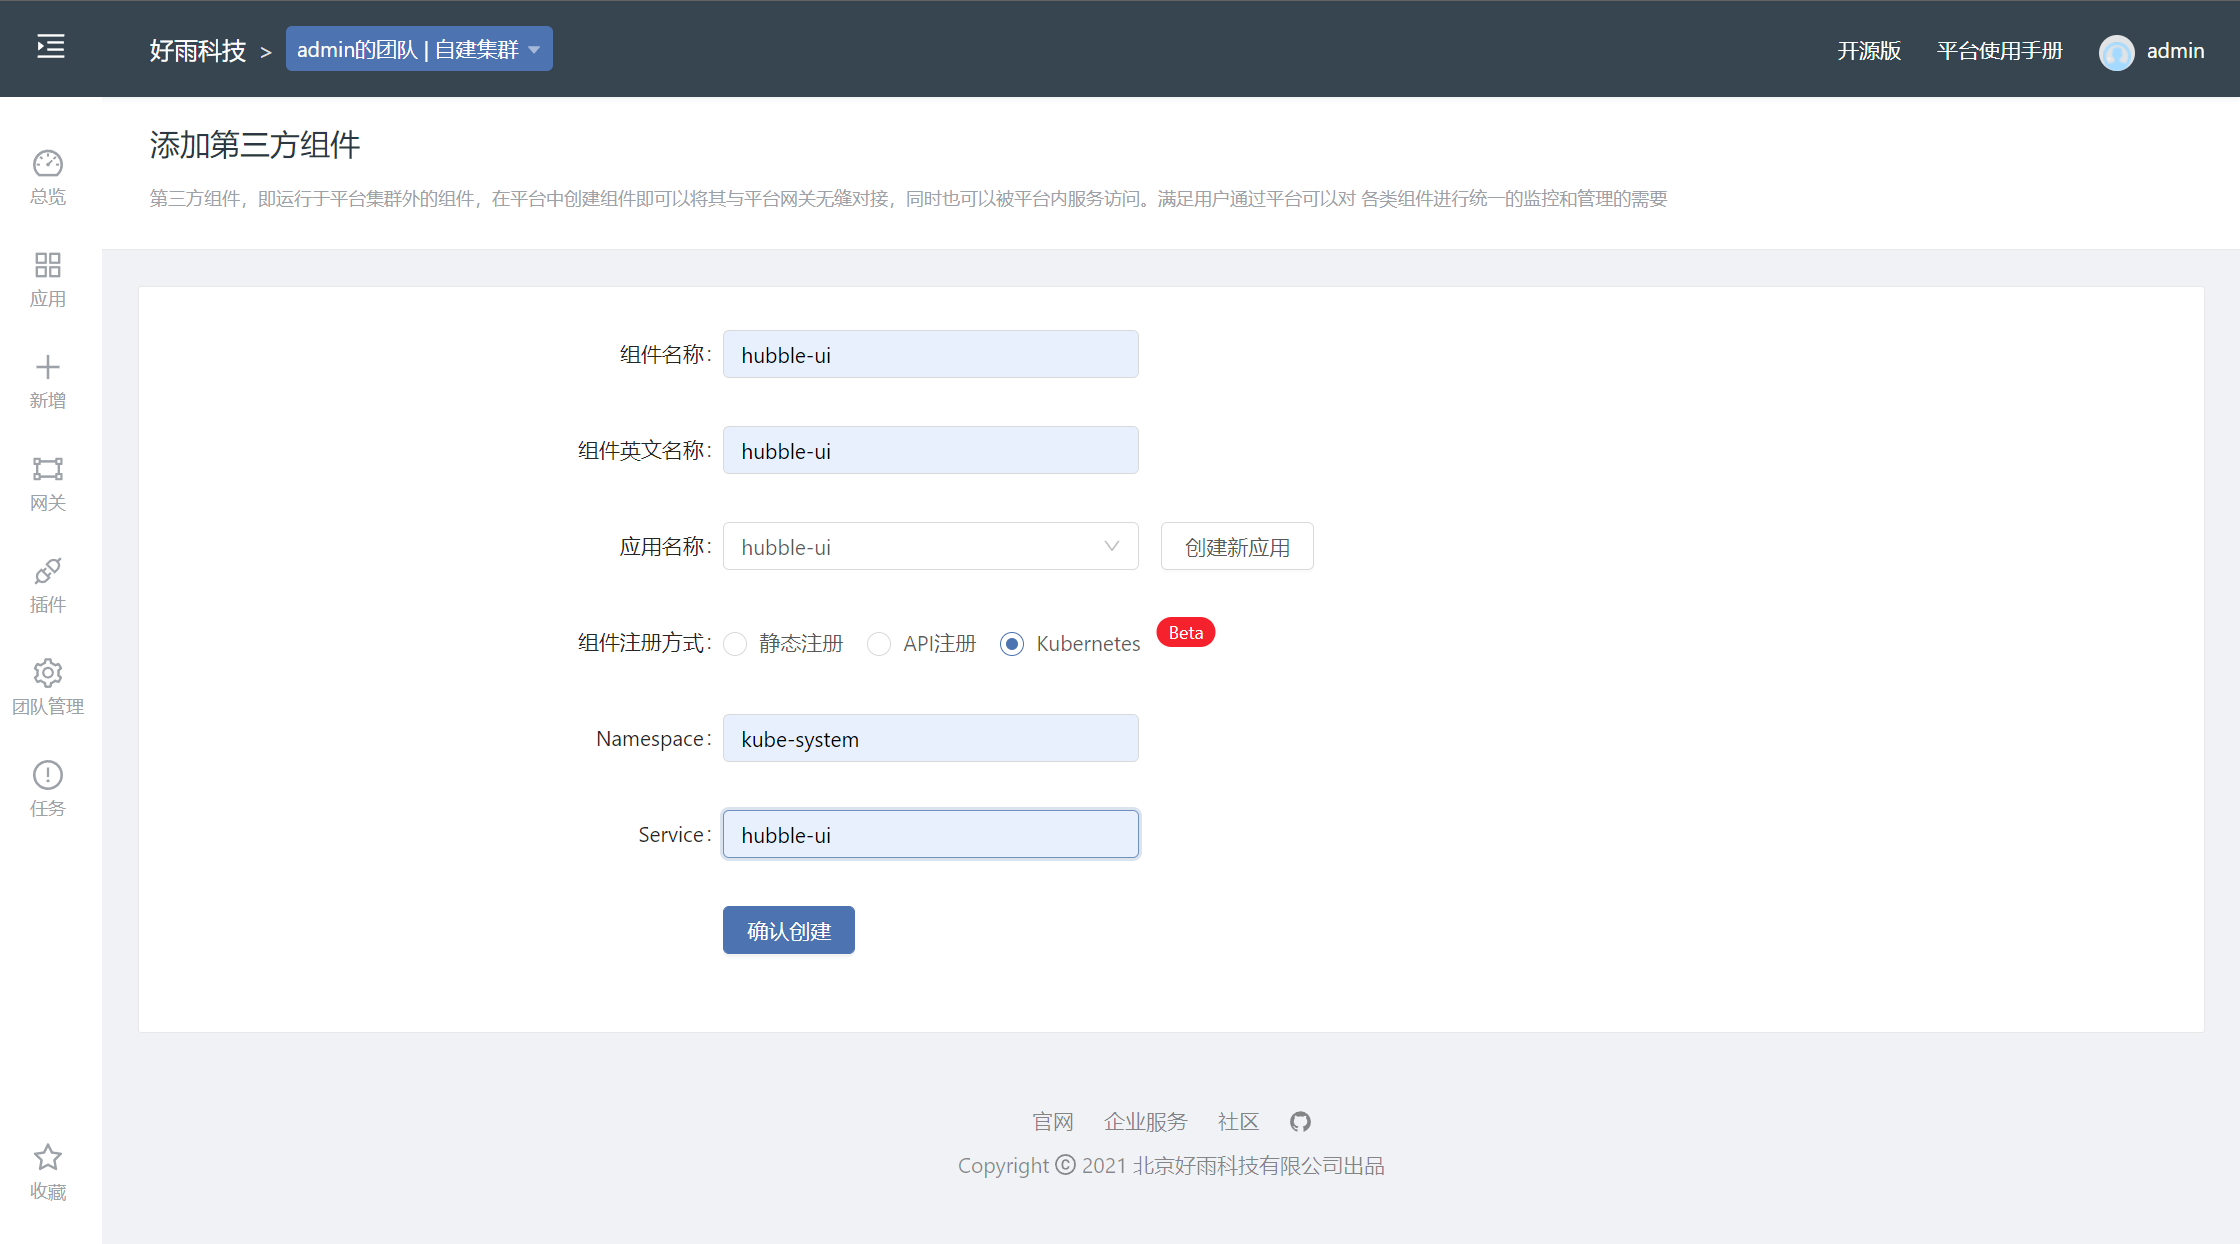
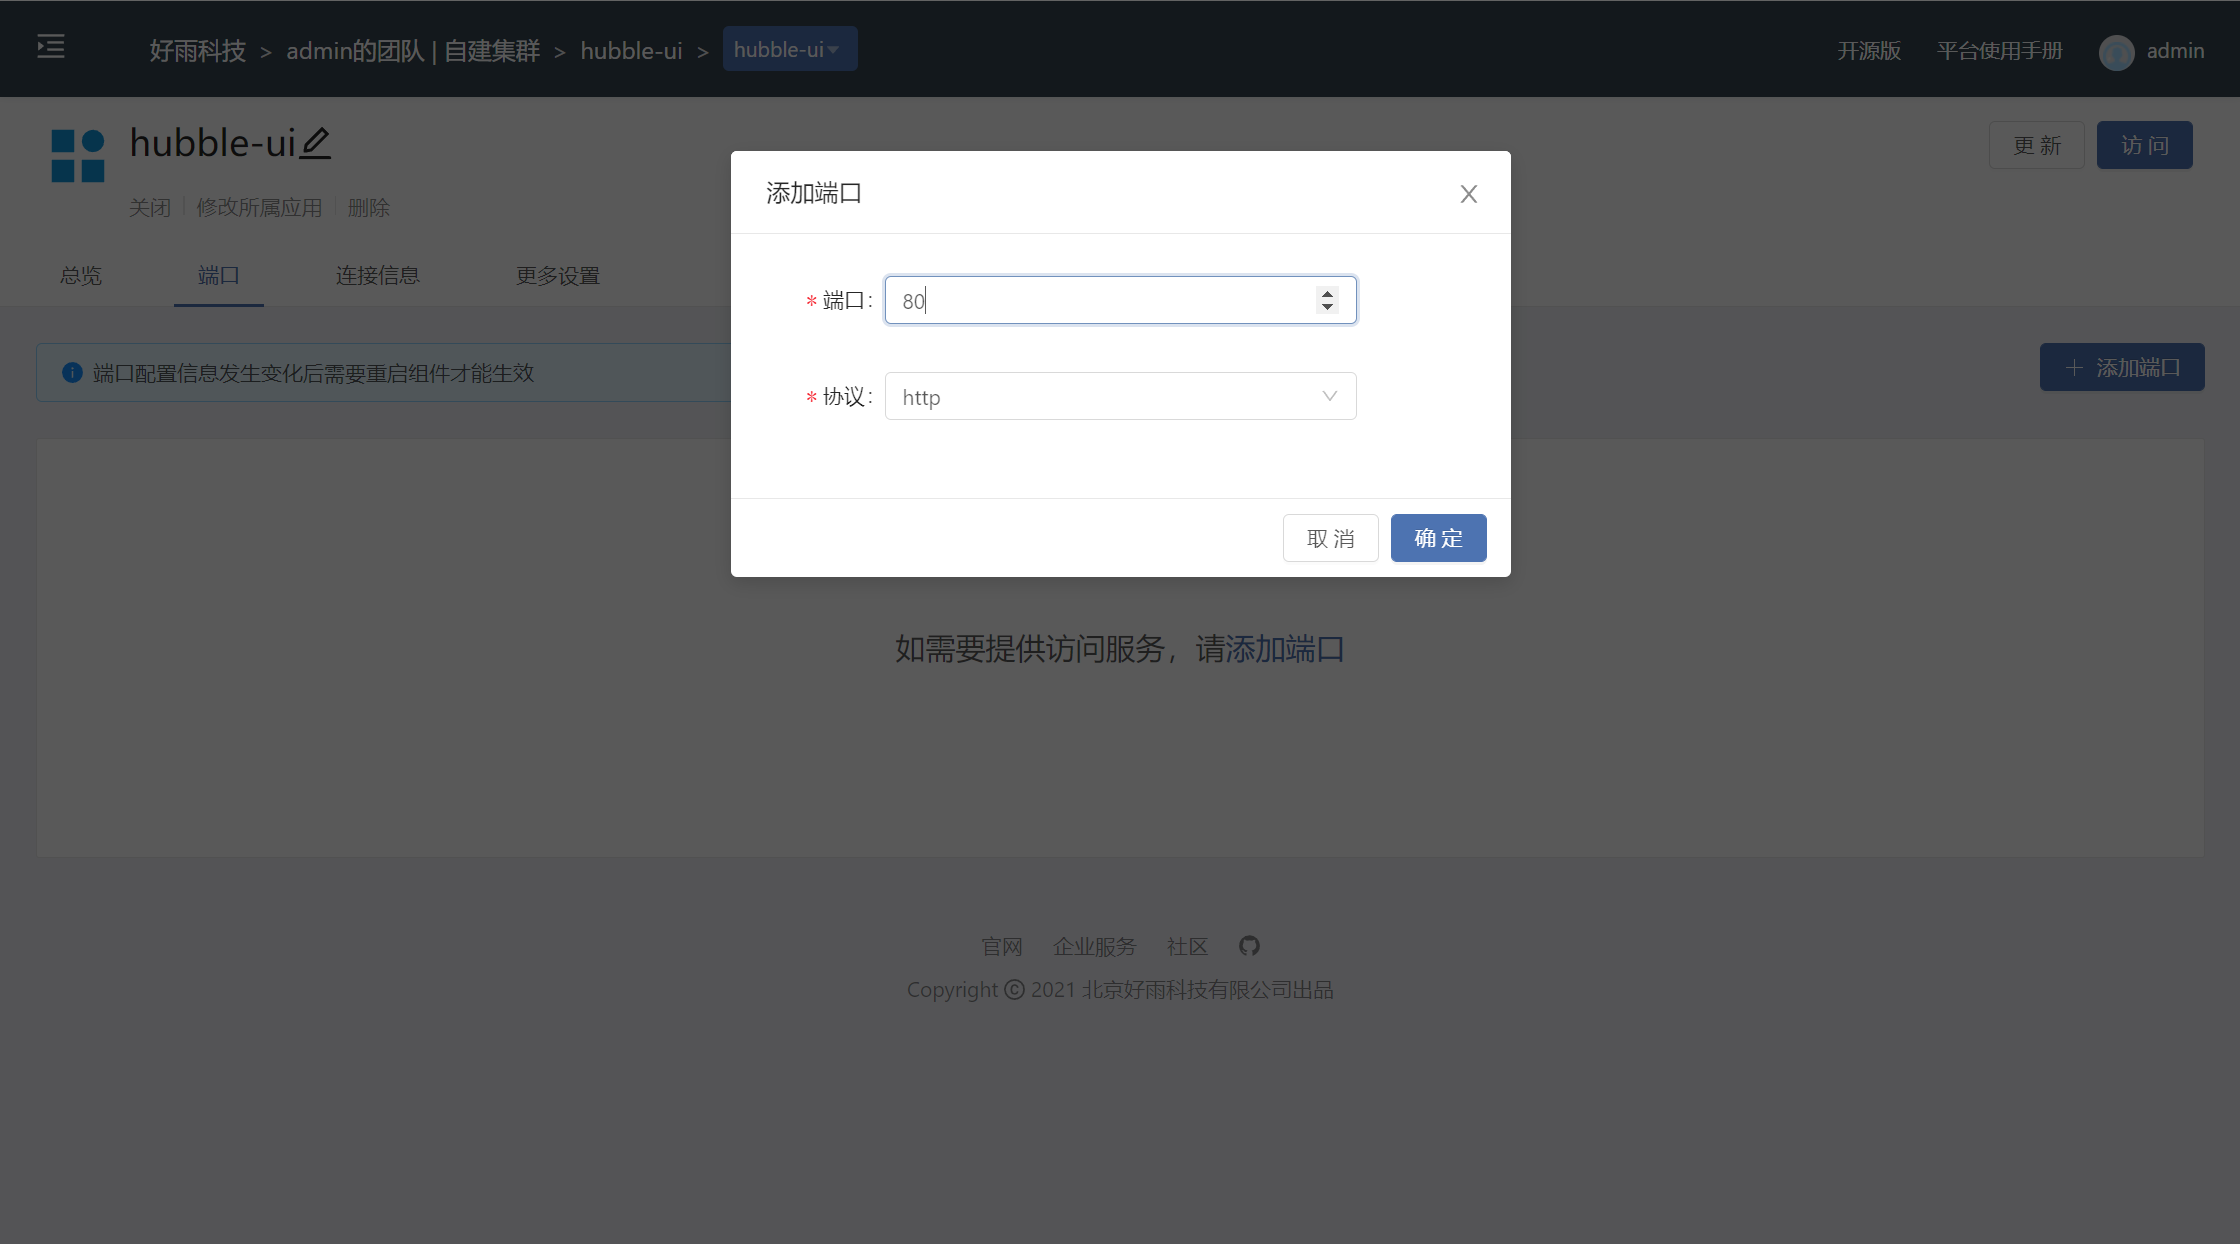
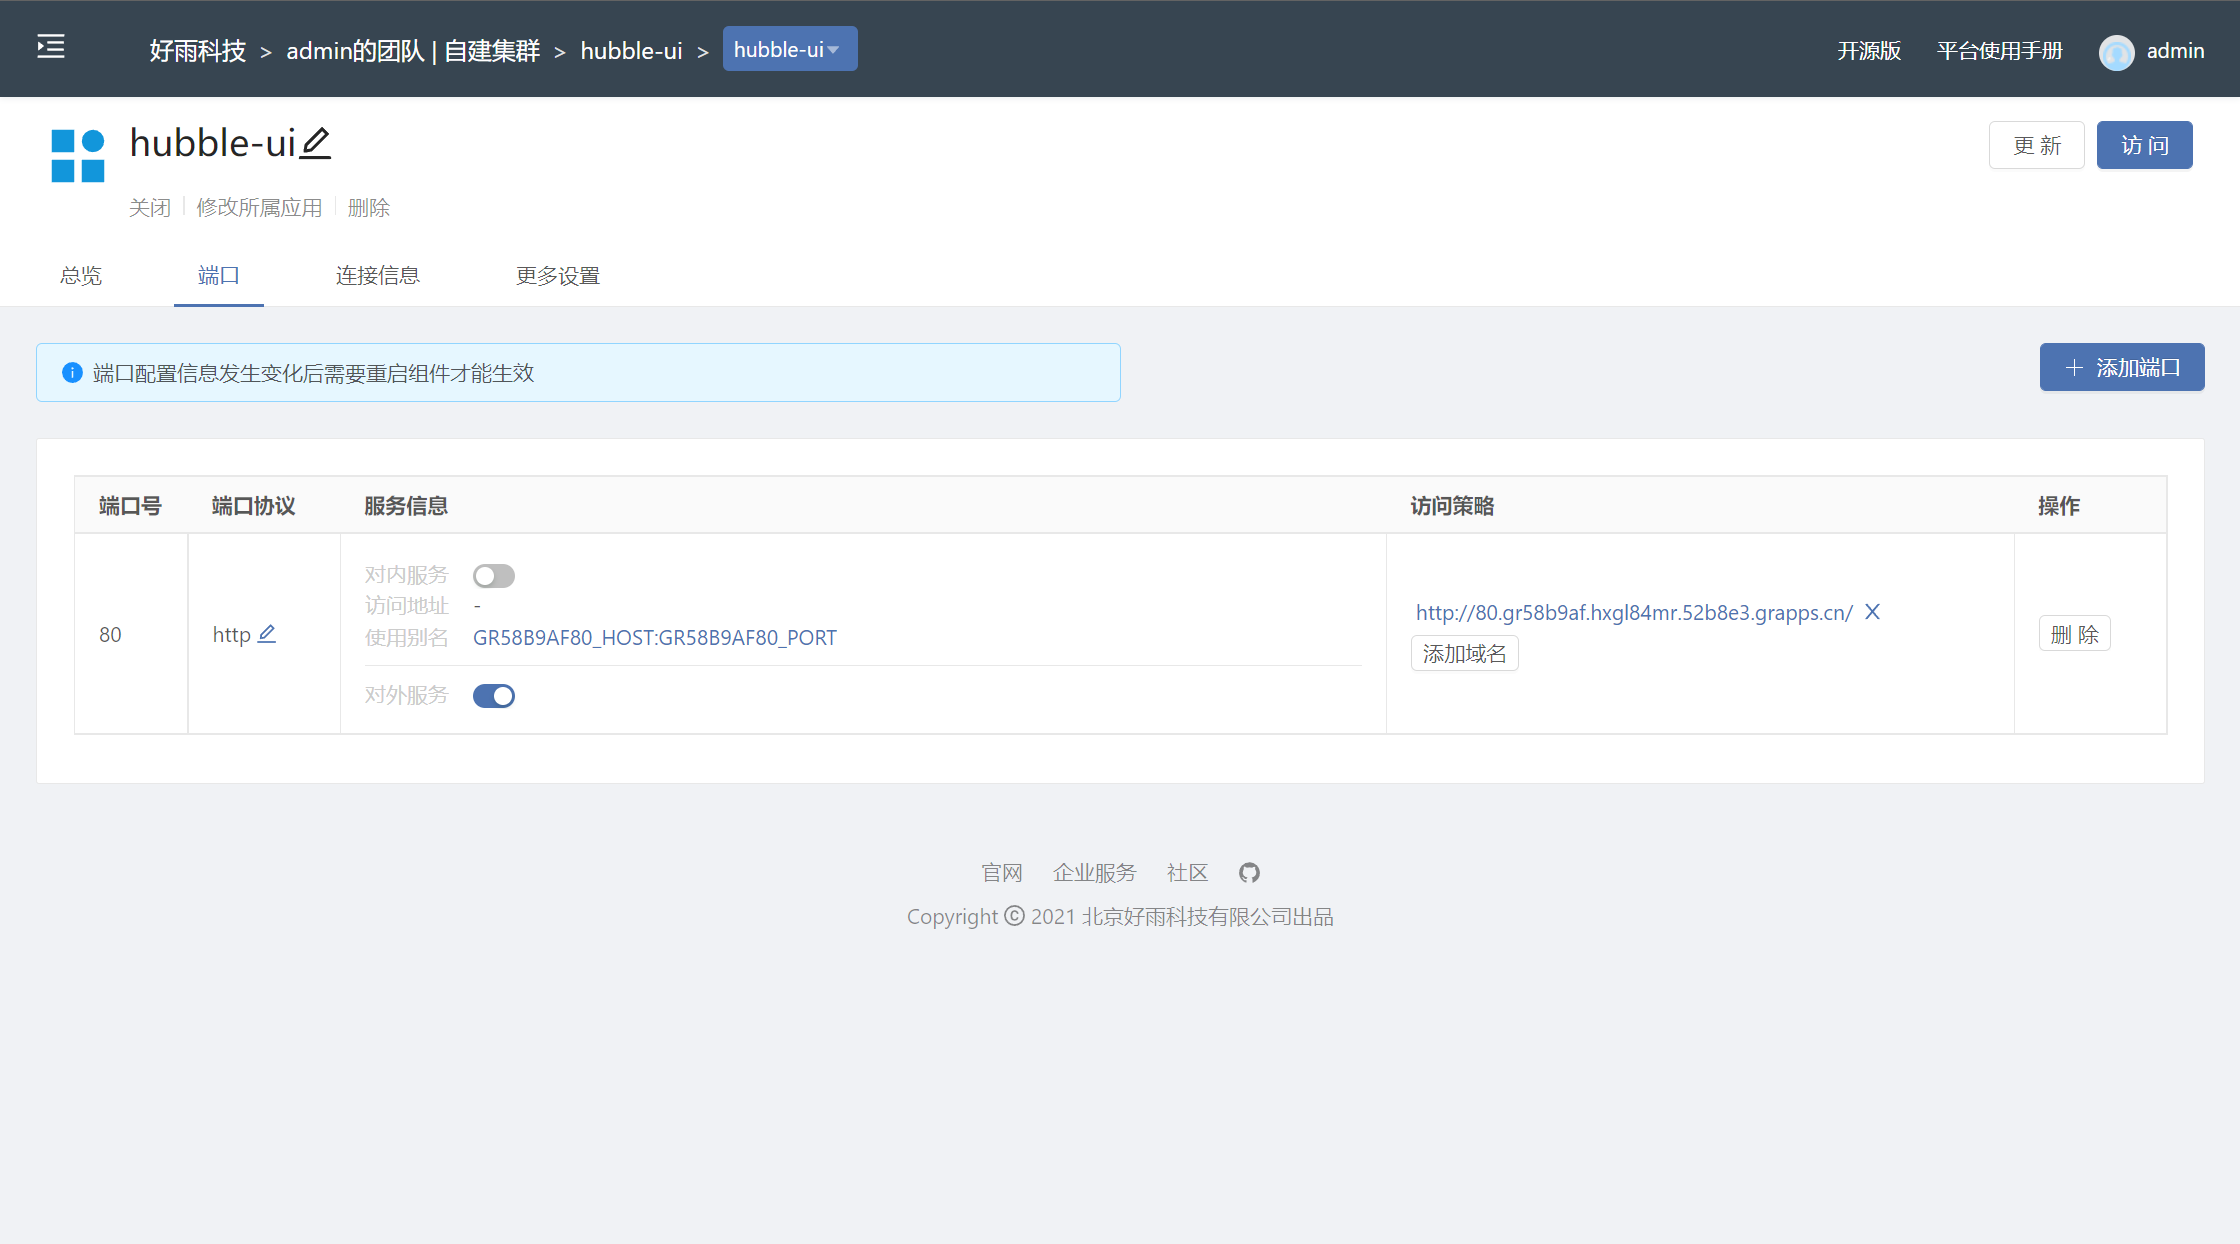
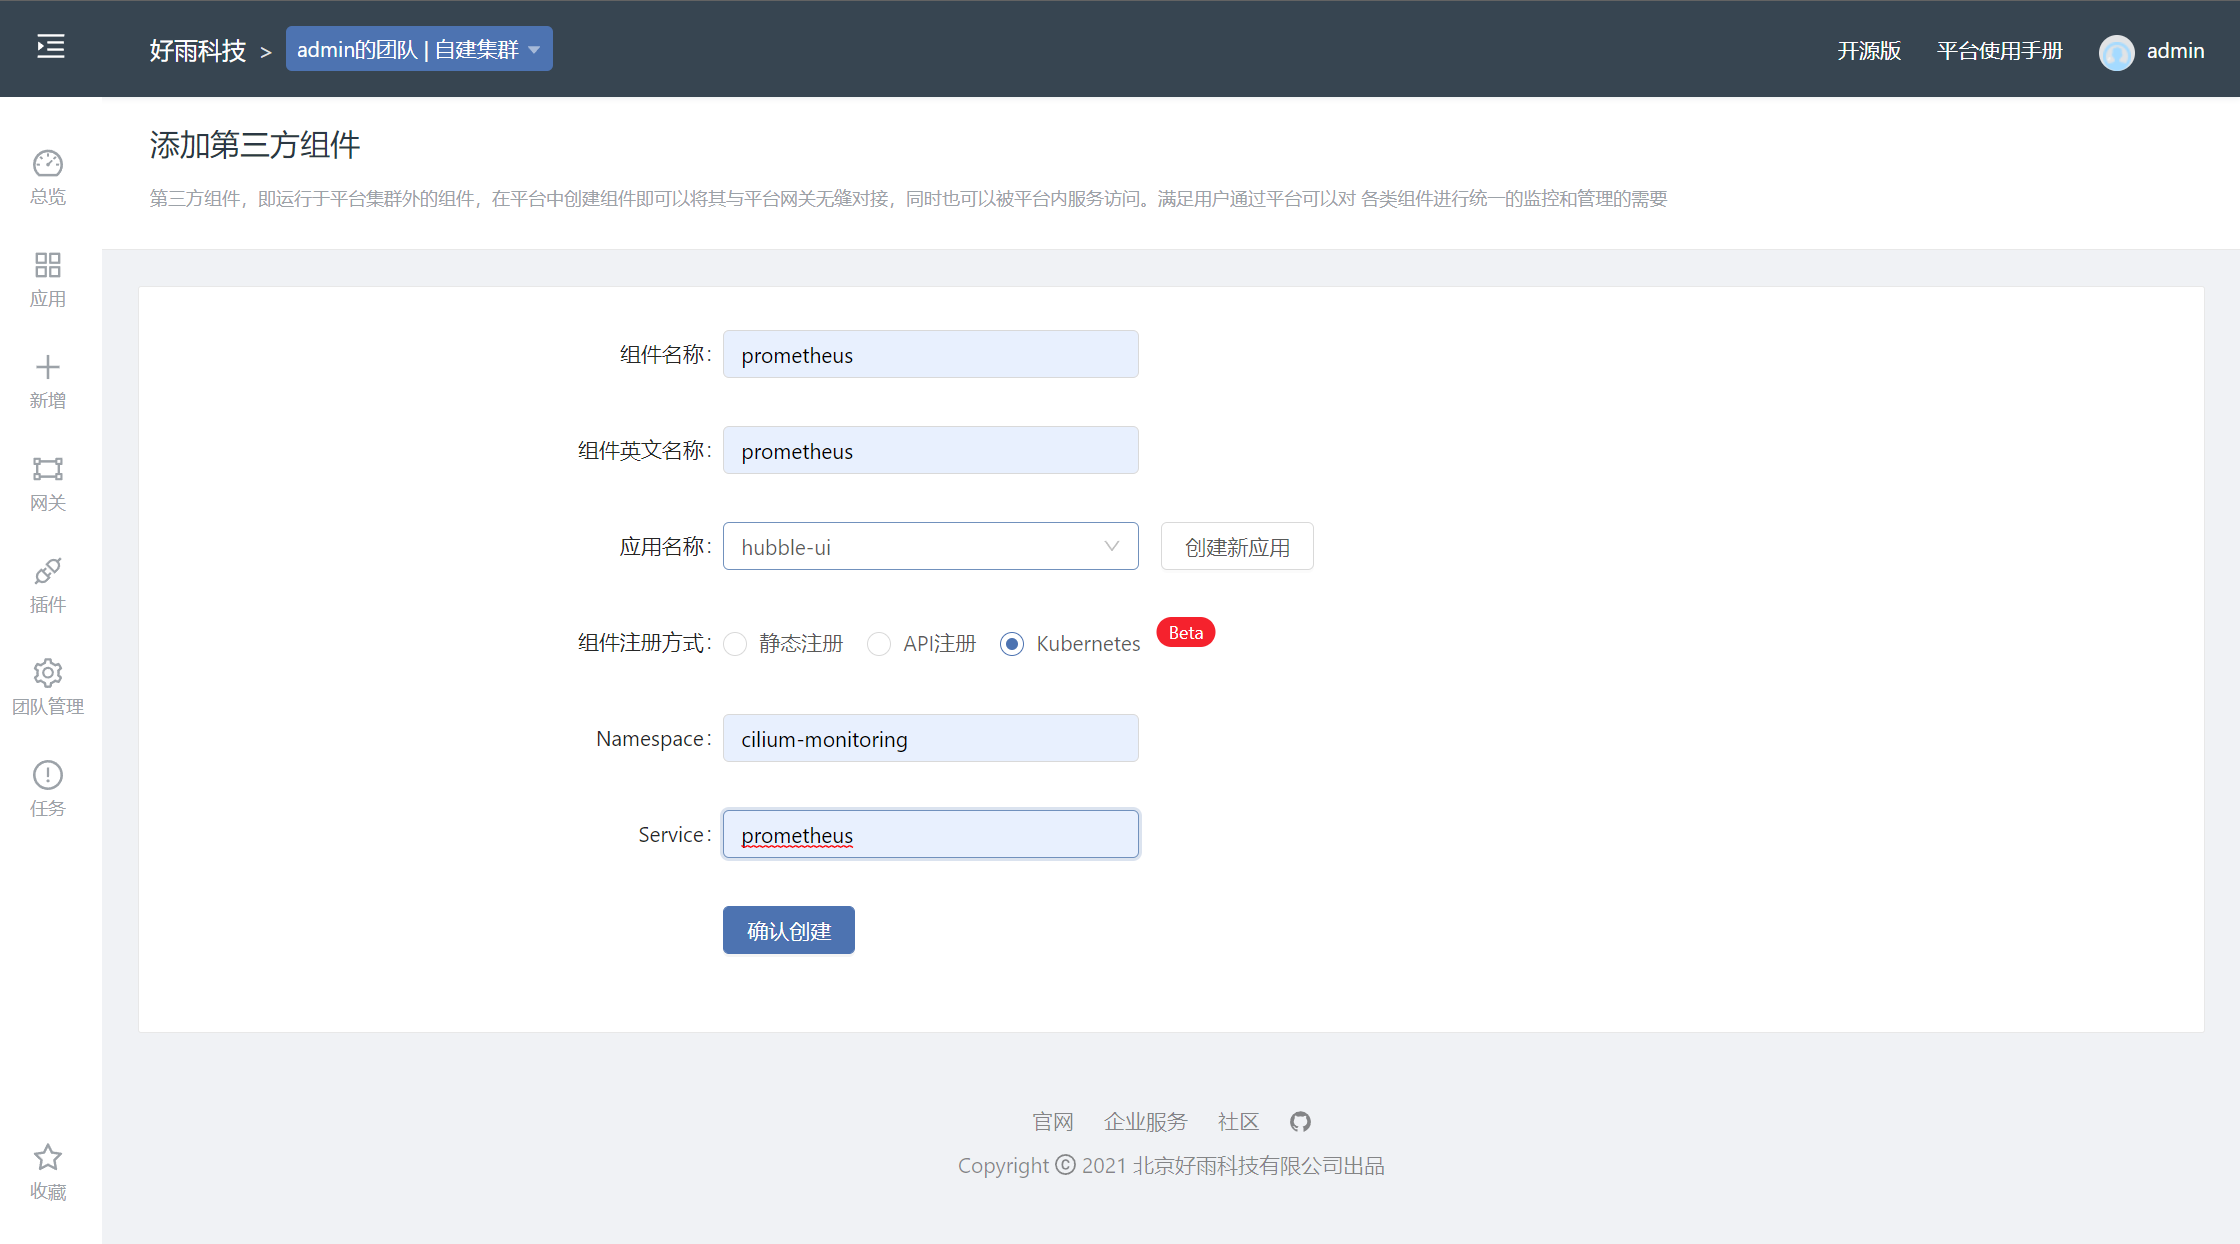
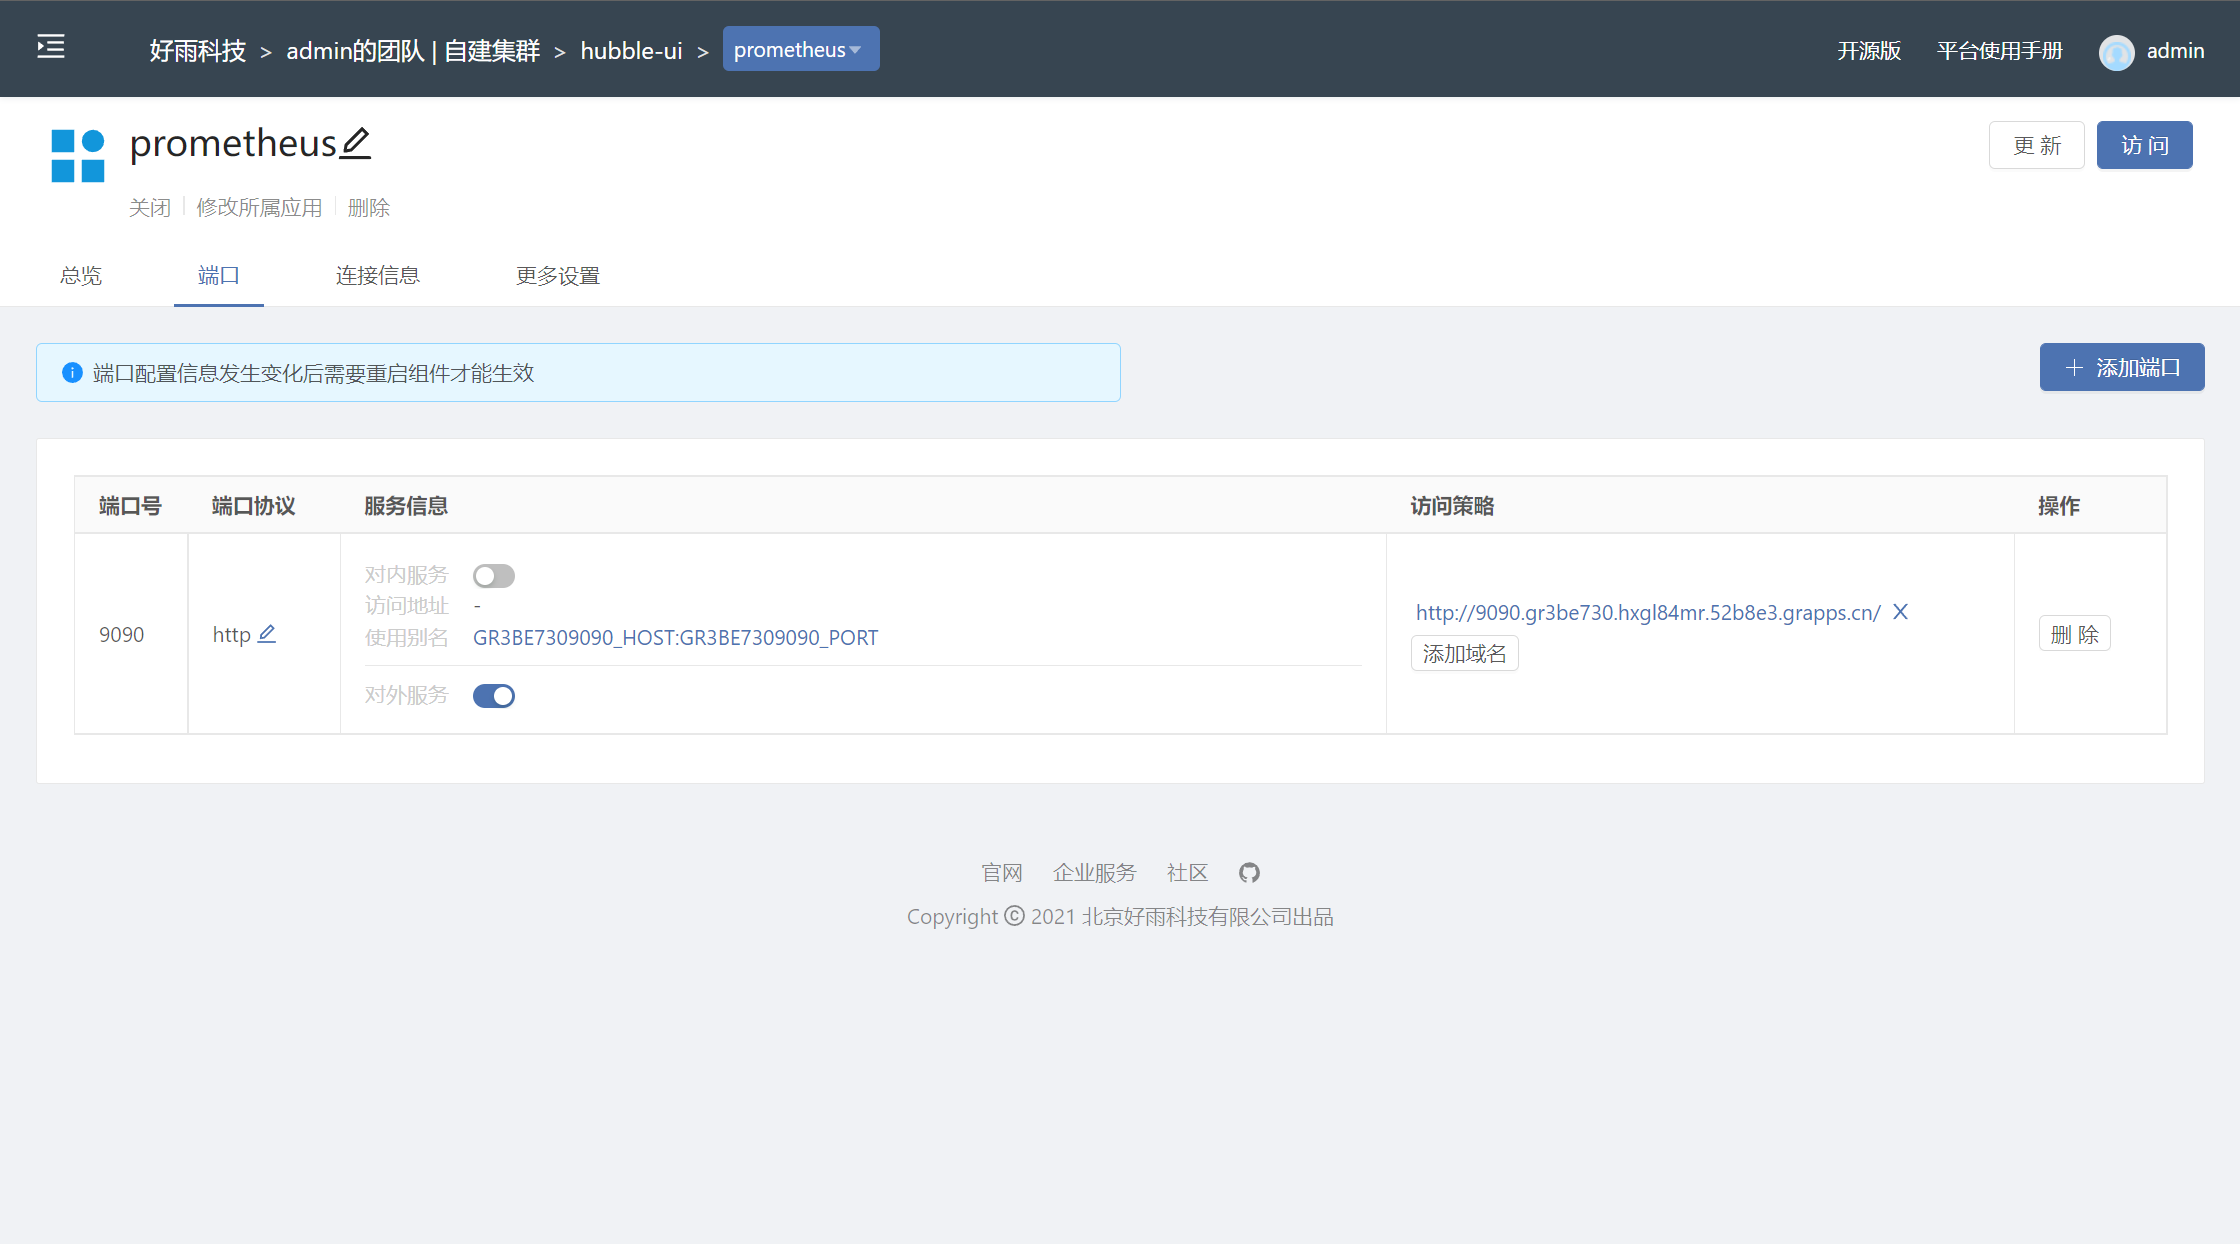
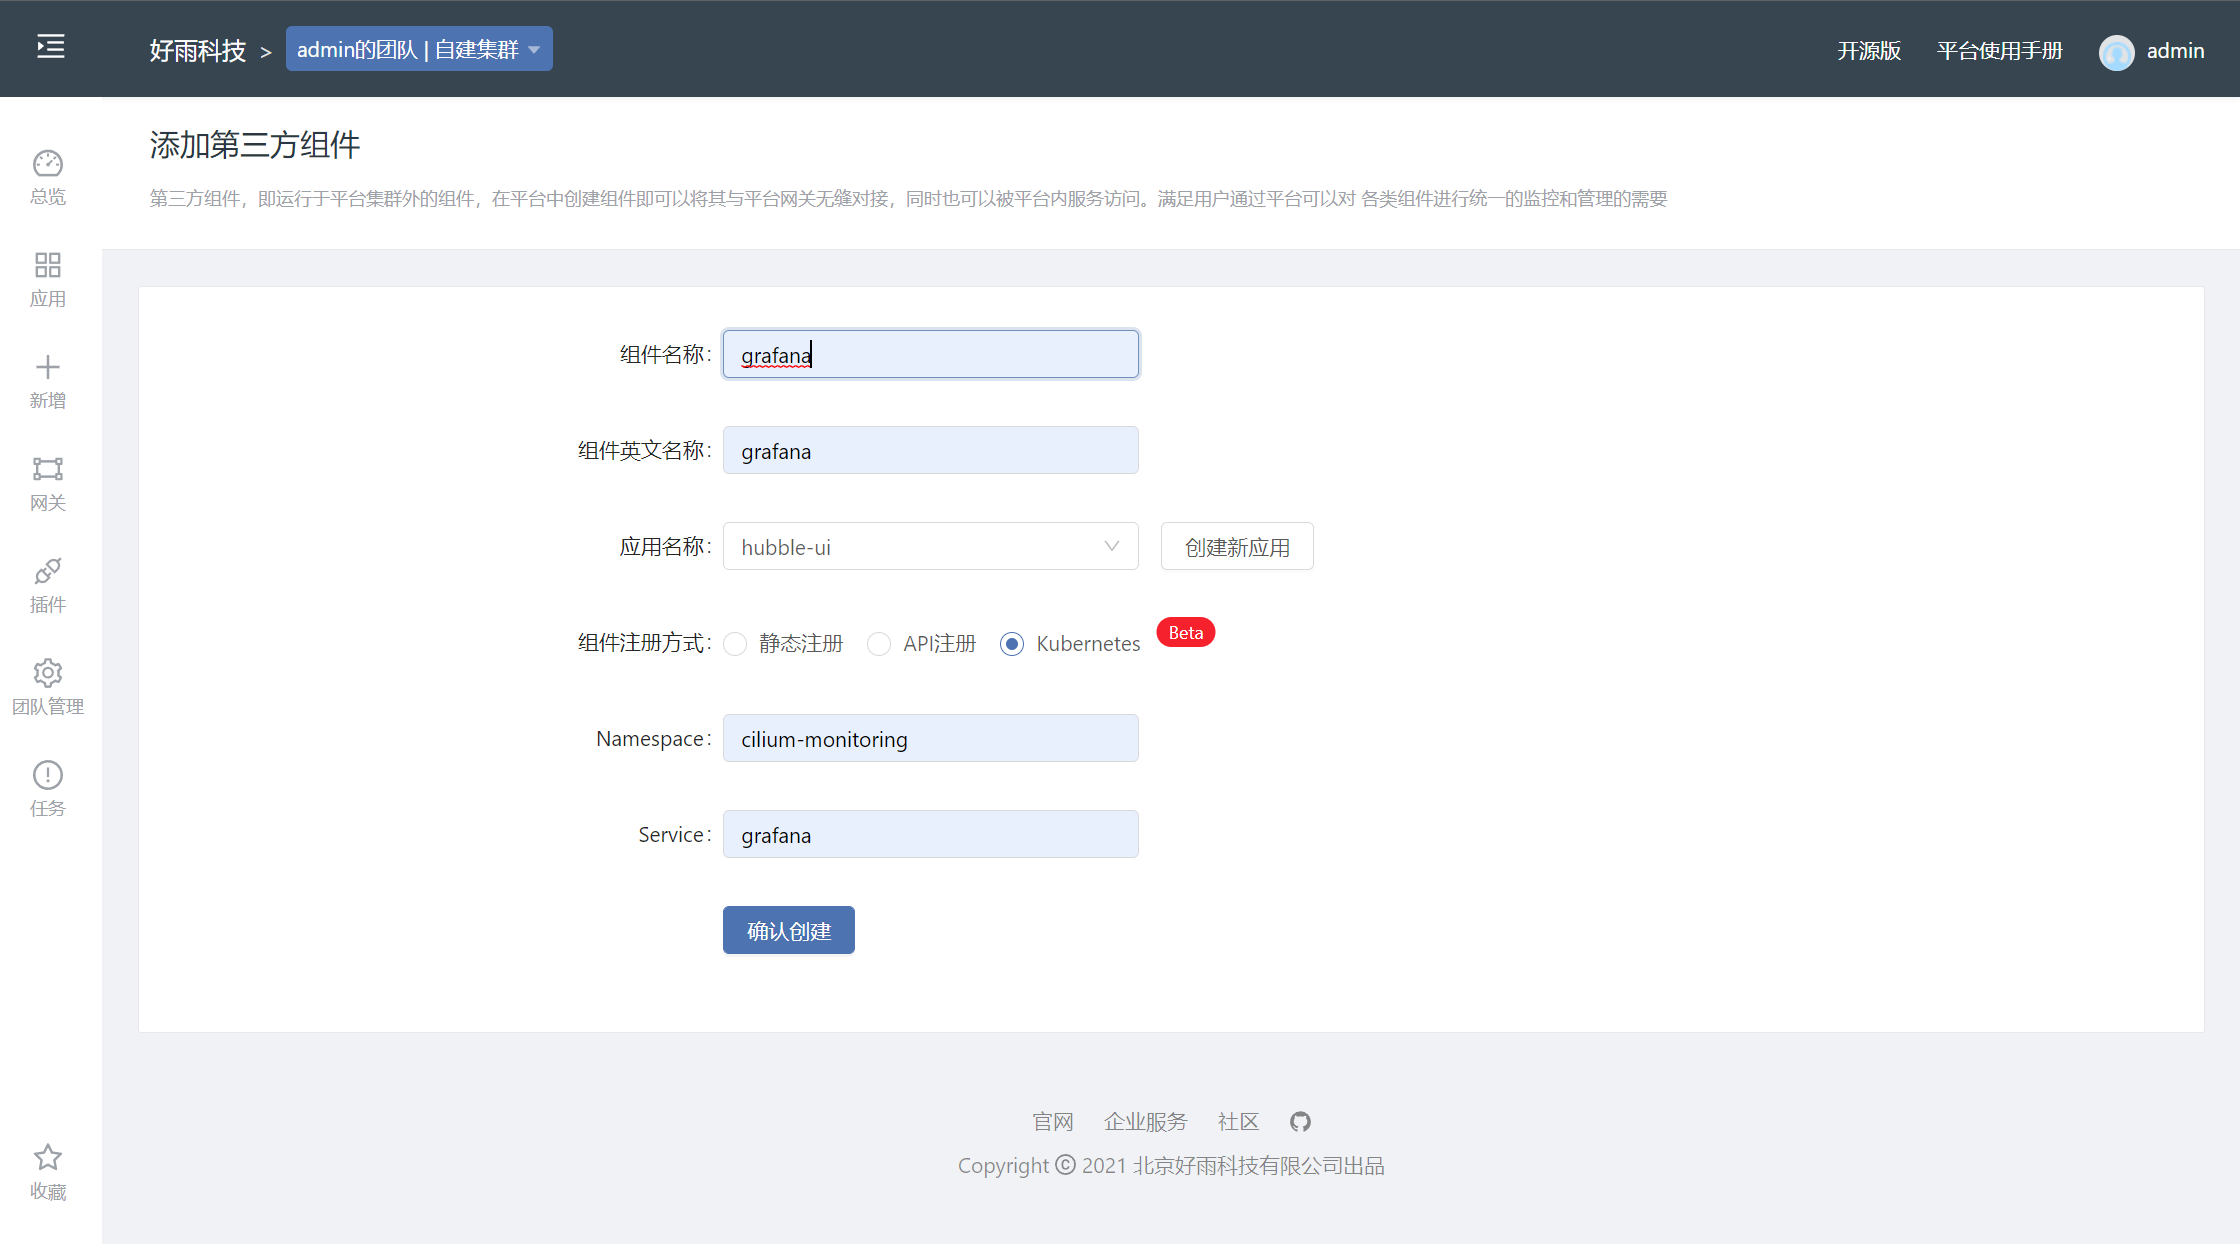
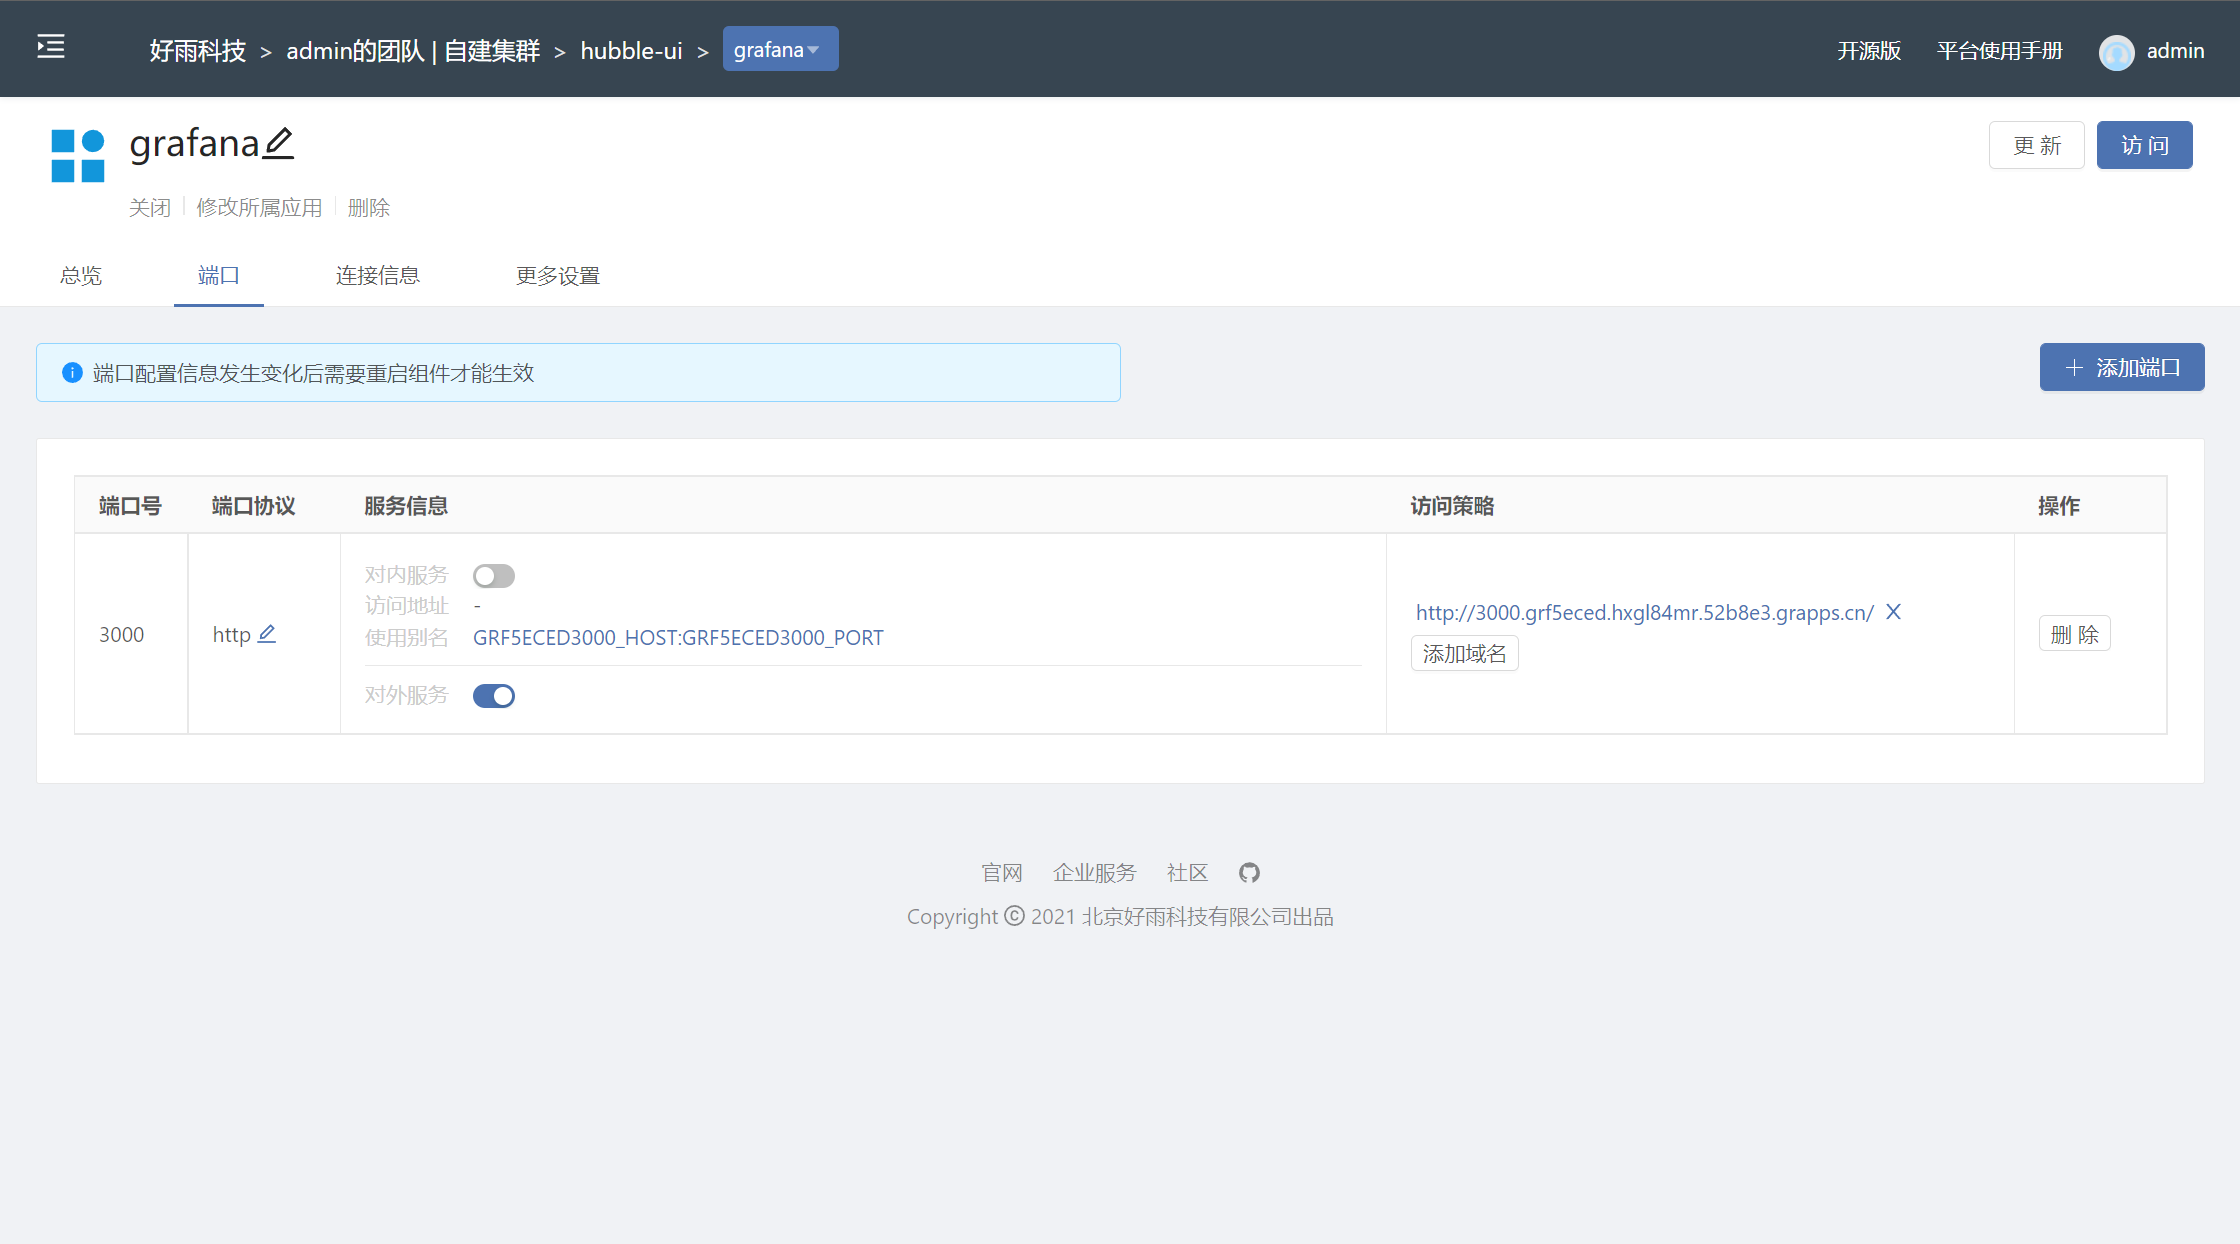
adopt Rainbond How to add third-party components to the platform , Open or close at any time UI Access to the interface
Hubble UI Display information
Visit the main page
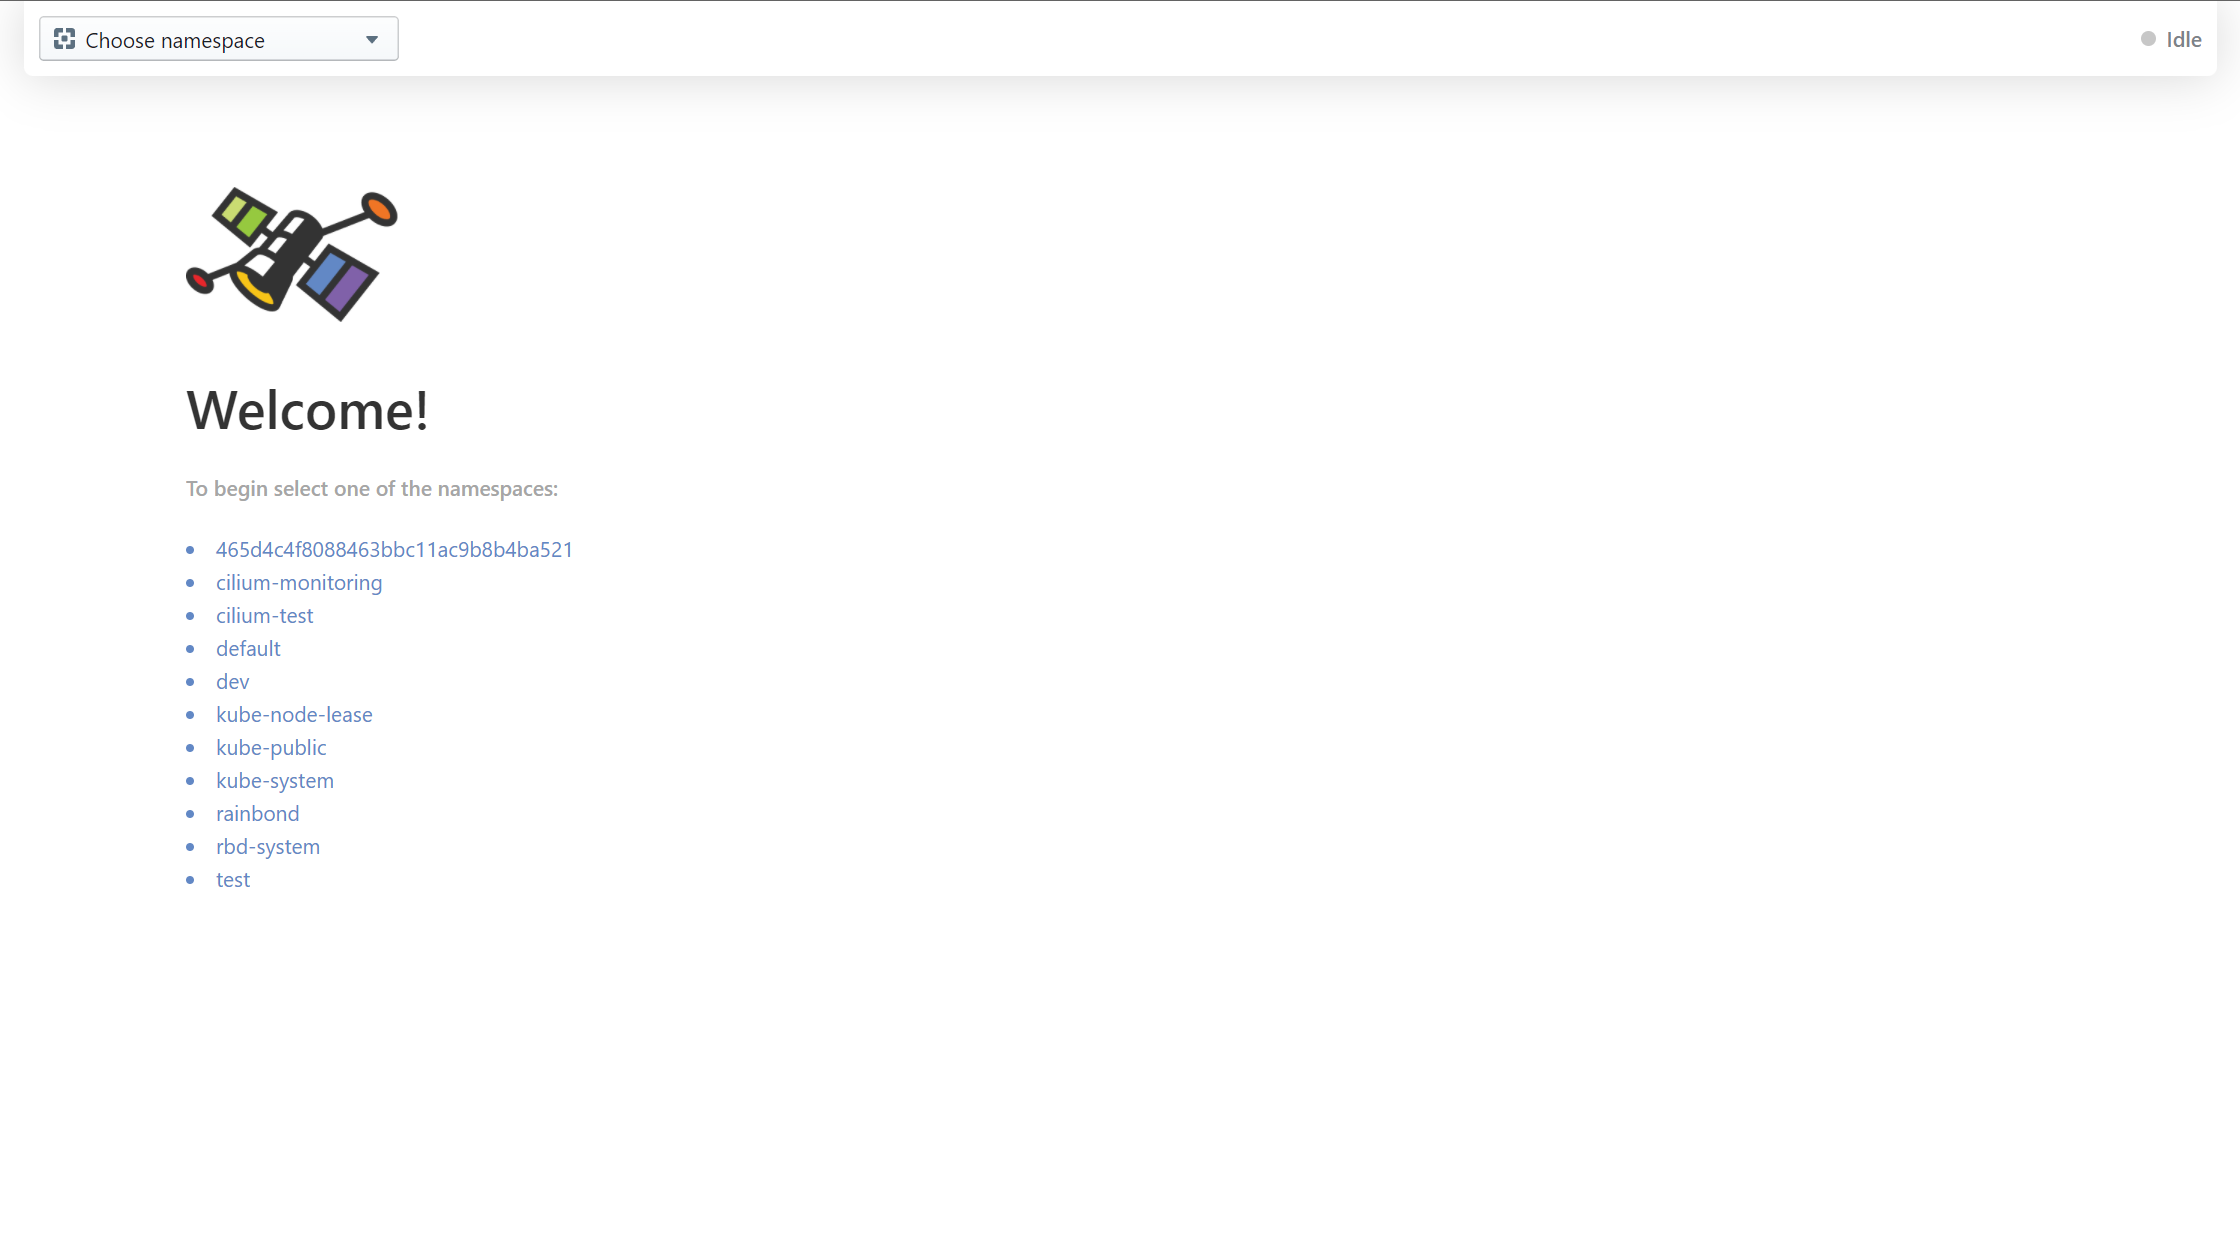
Enter the namespace you want to view , The current traffic topology is displayed in the middle of the page , The lower part shows the flow record
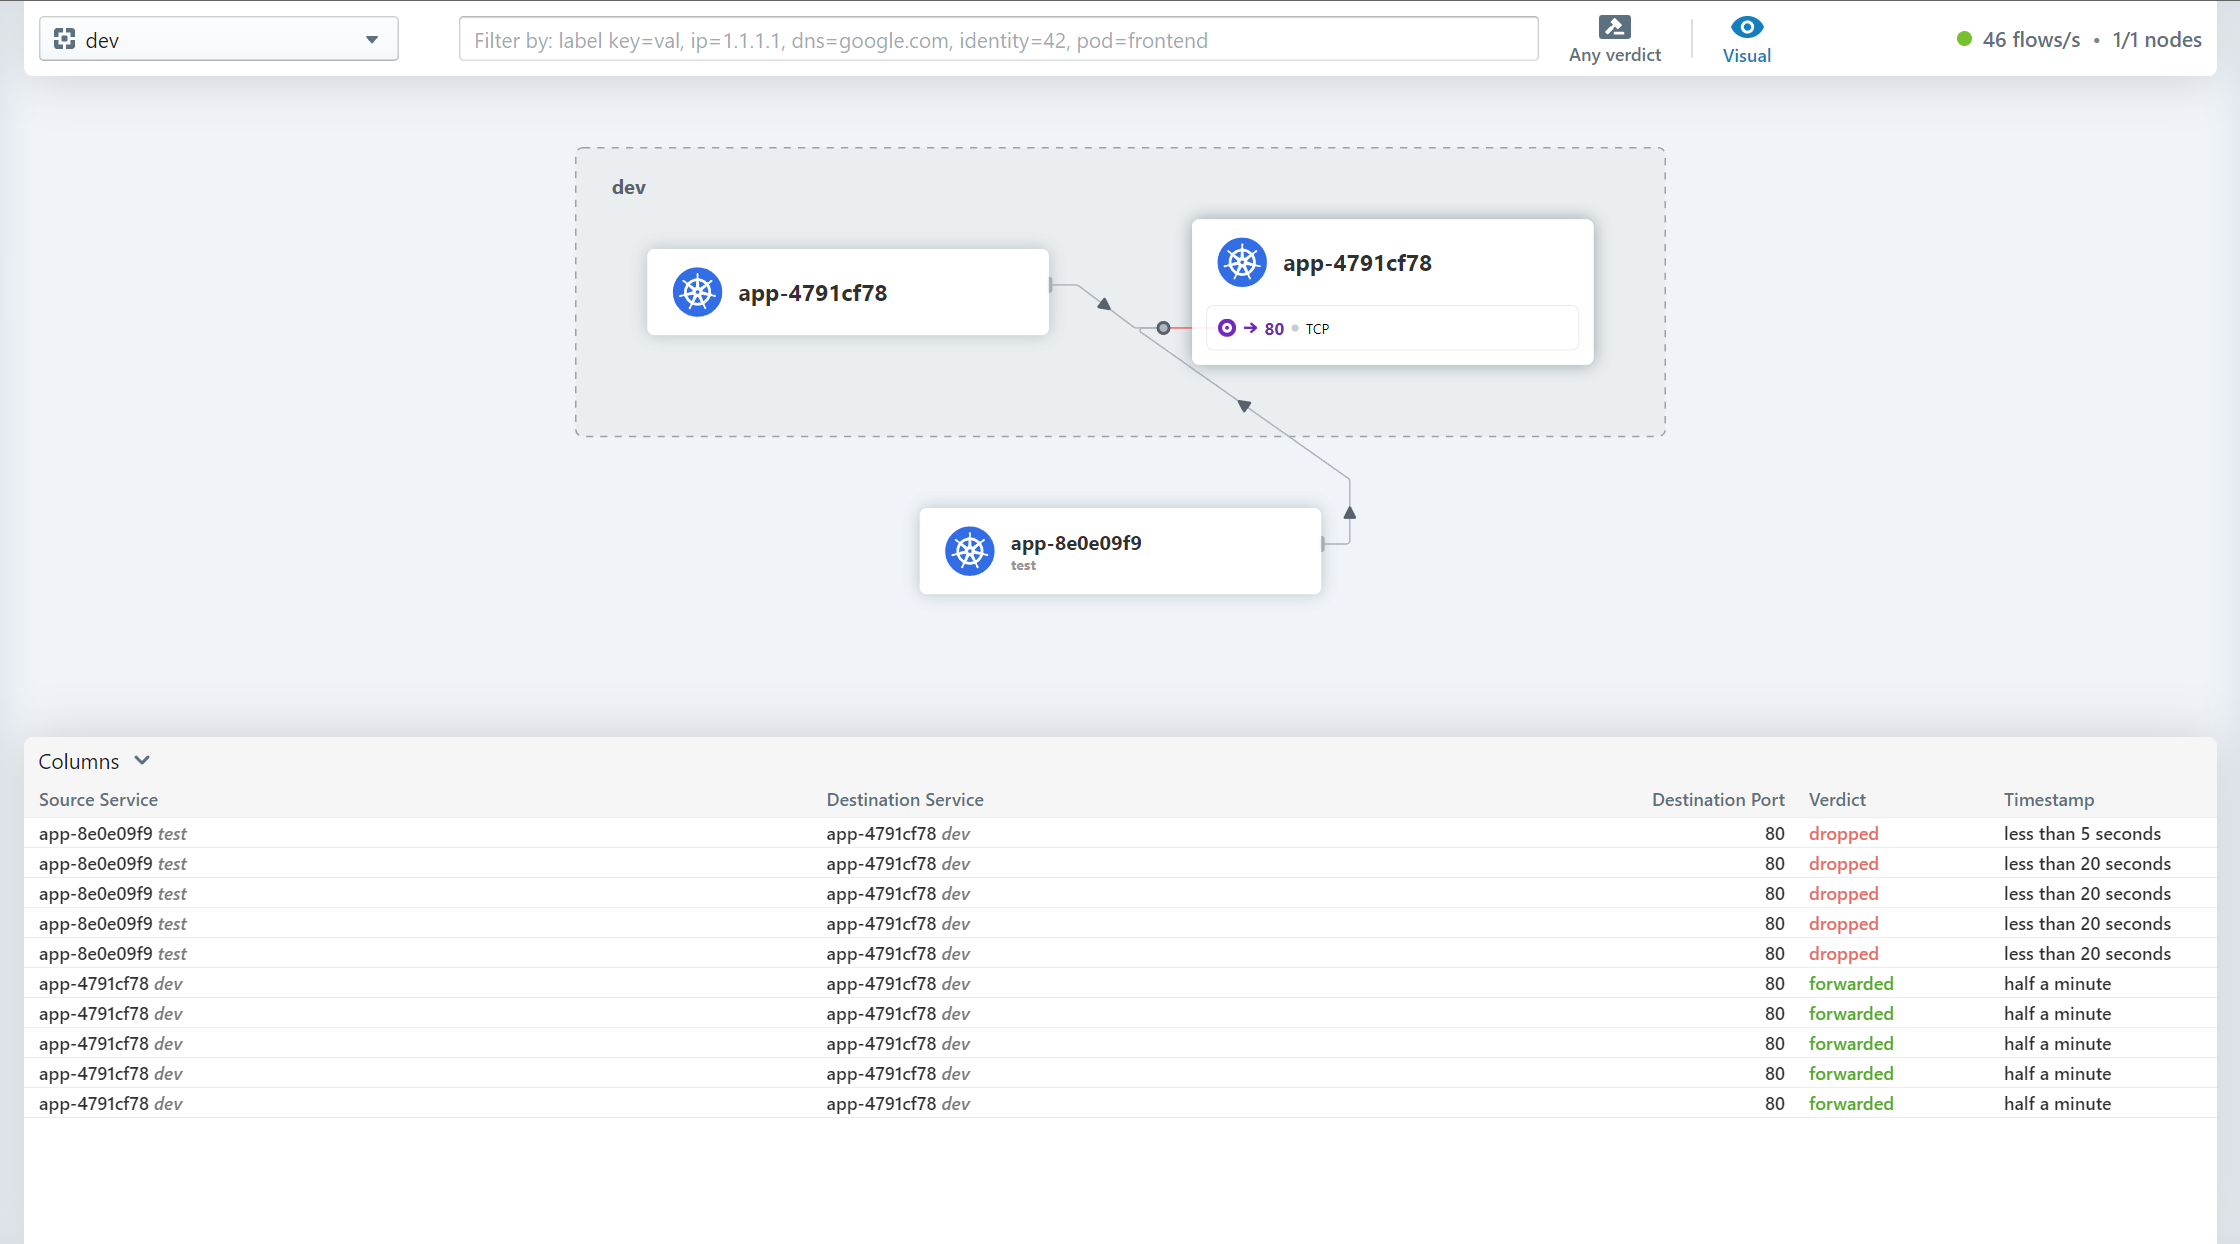
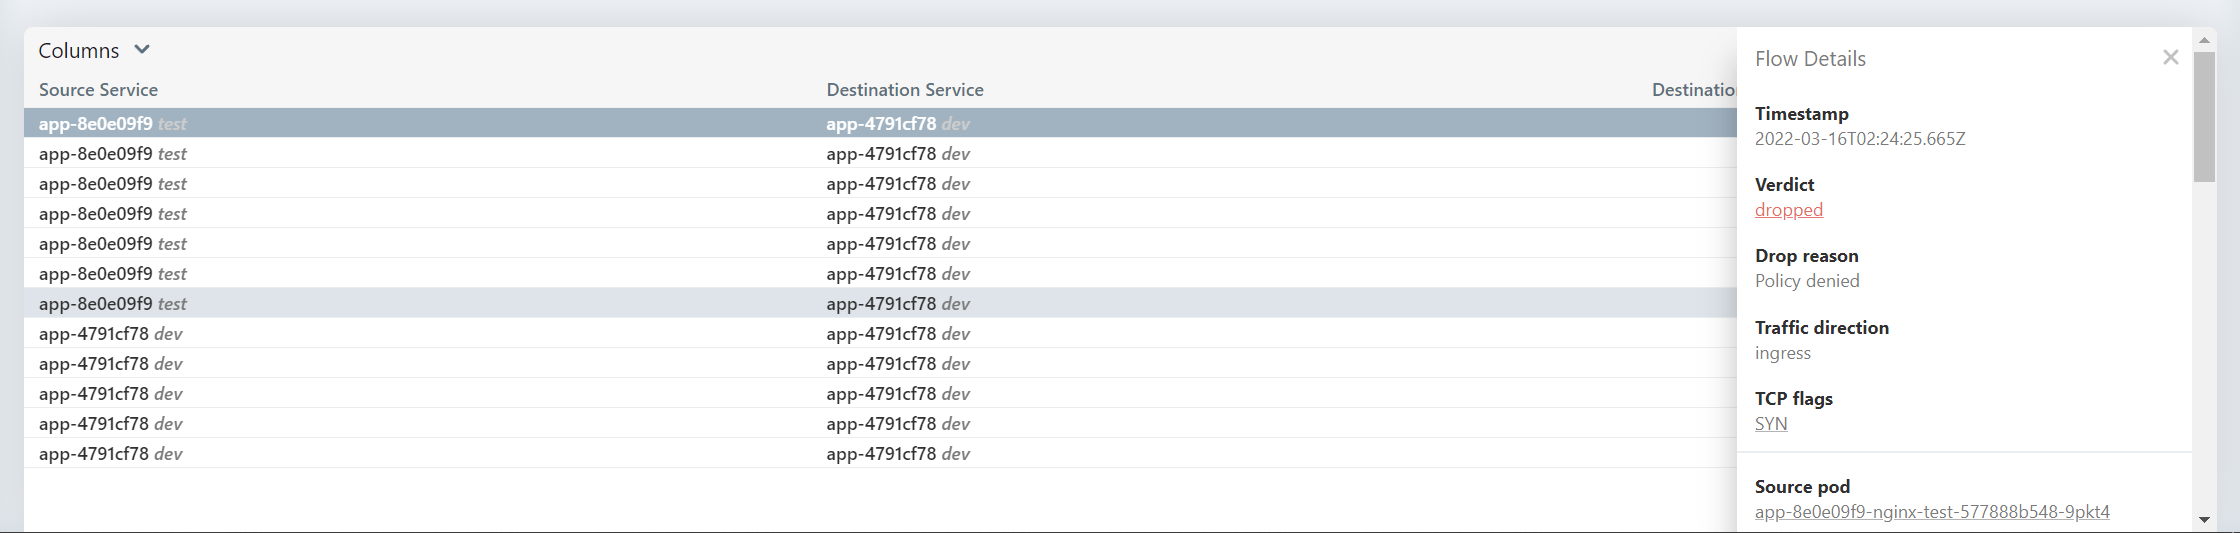
Click the traffic record to view the details
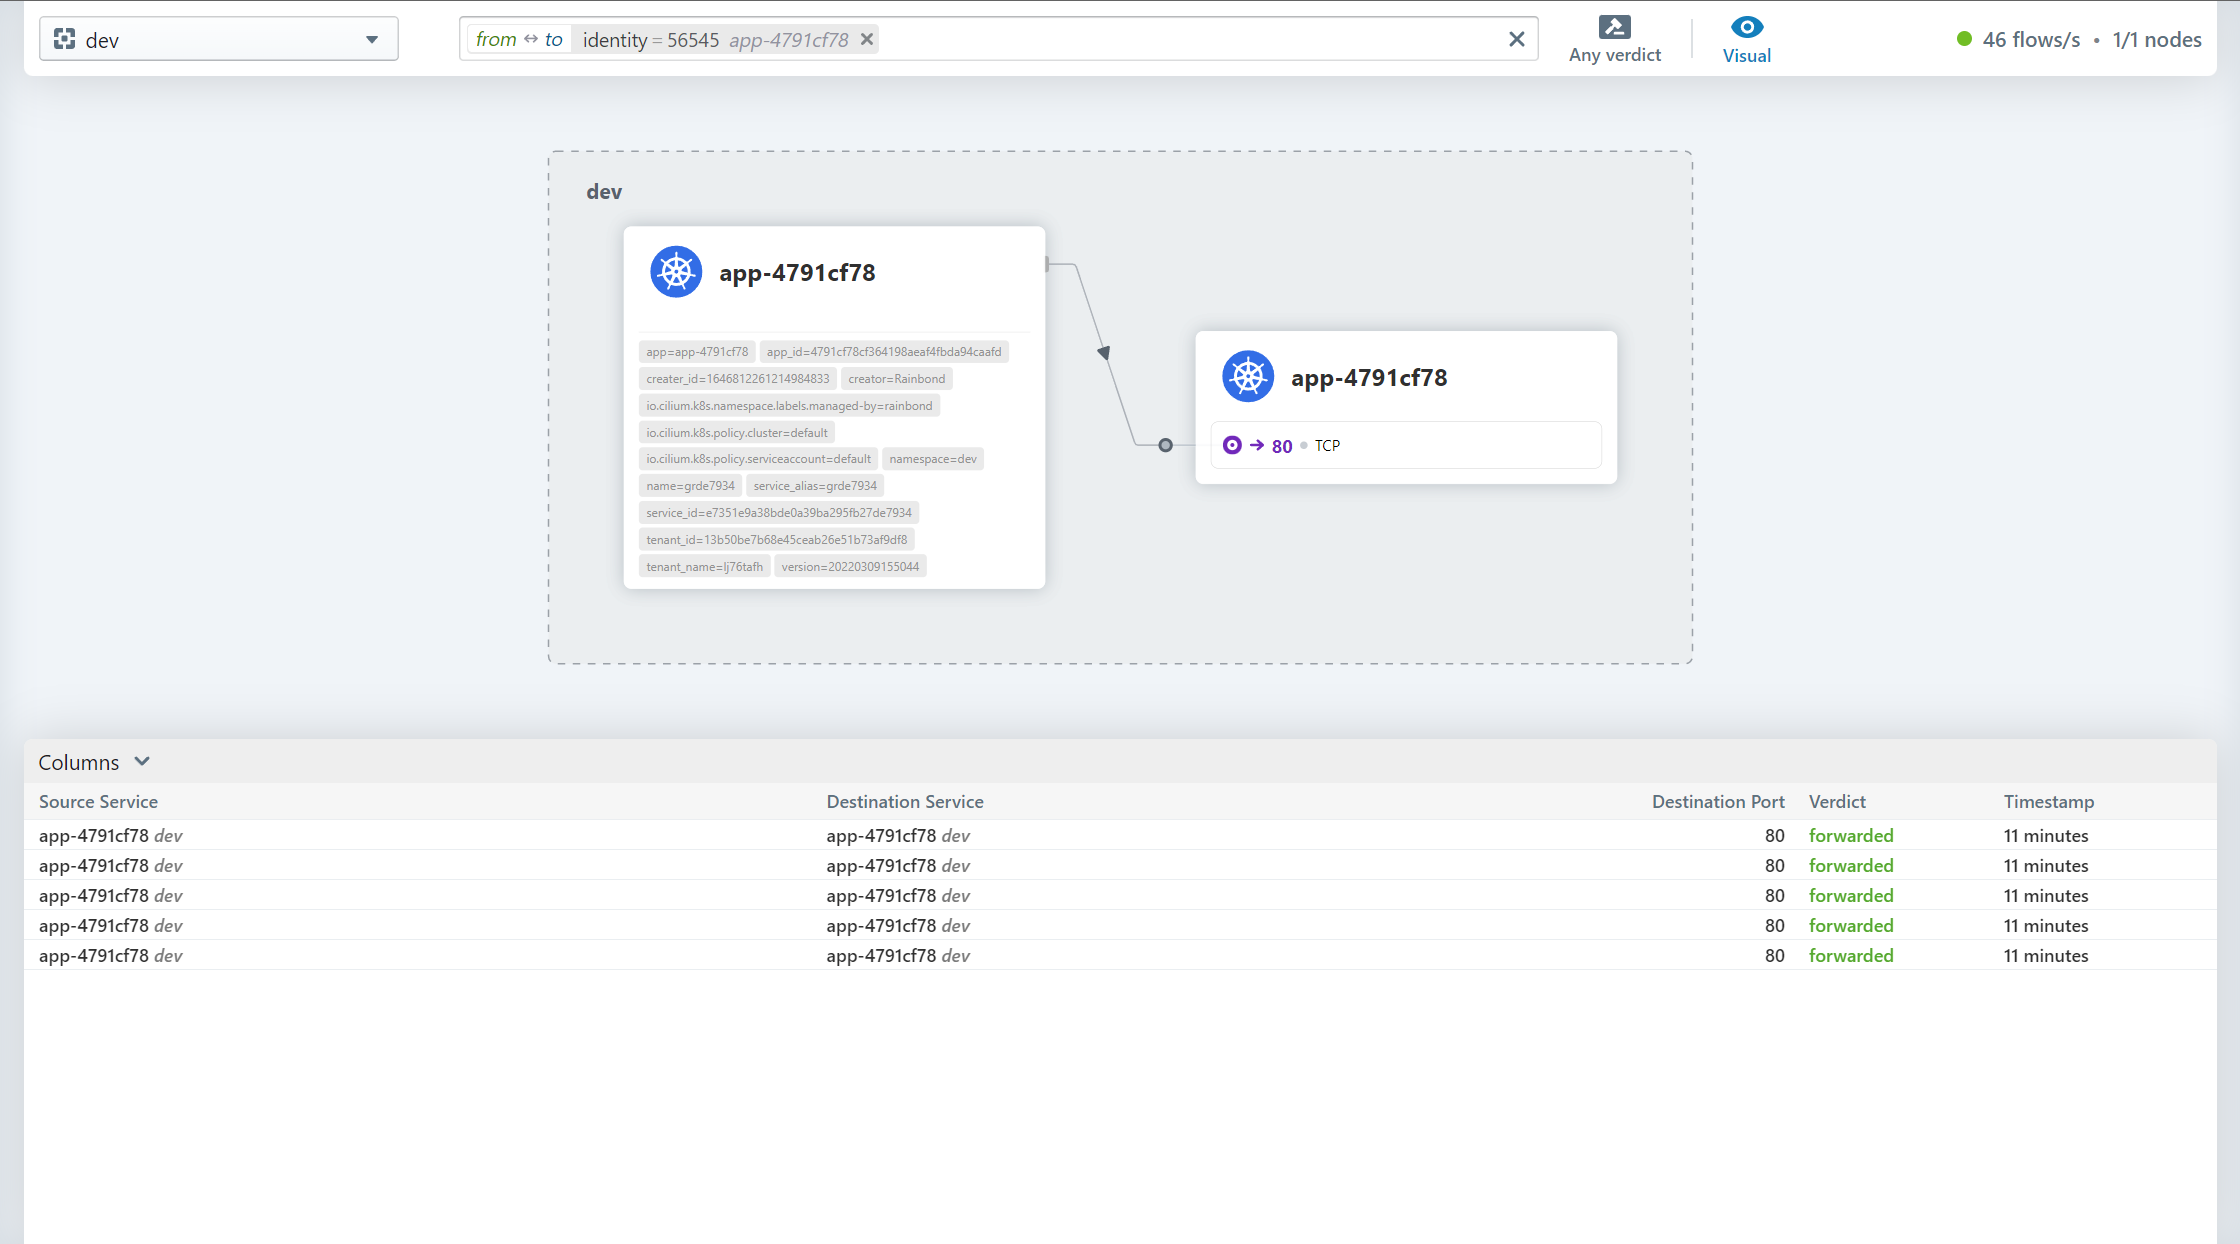
After clicking the component, only the relevant traffic is displayed
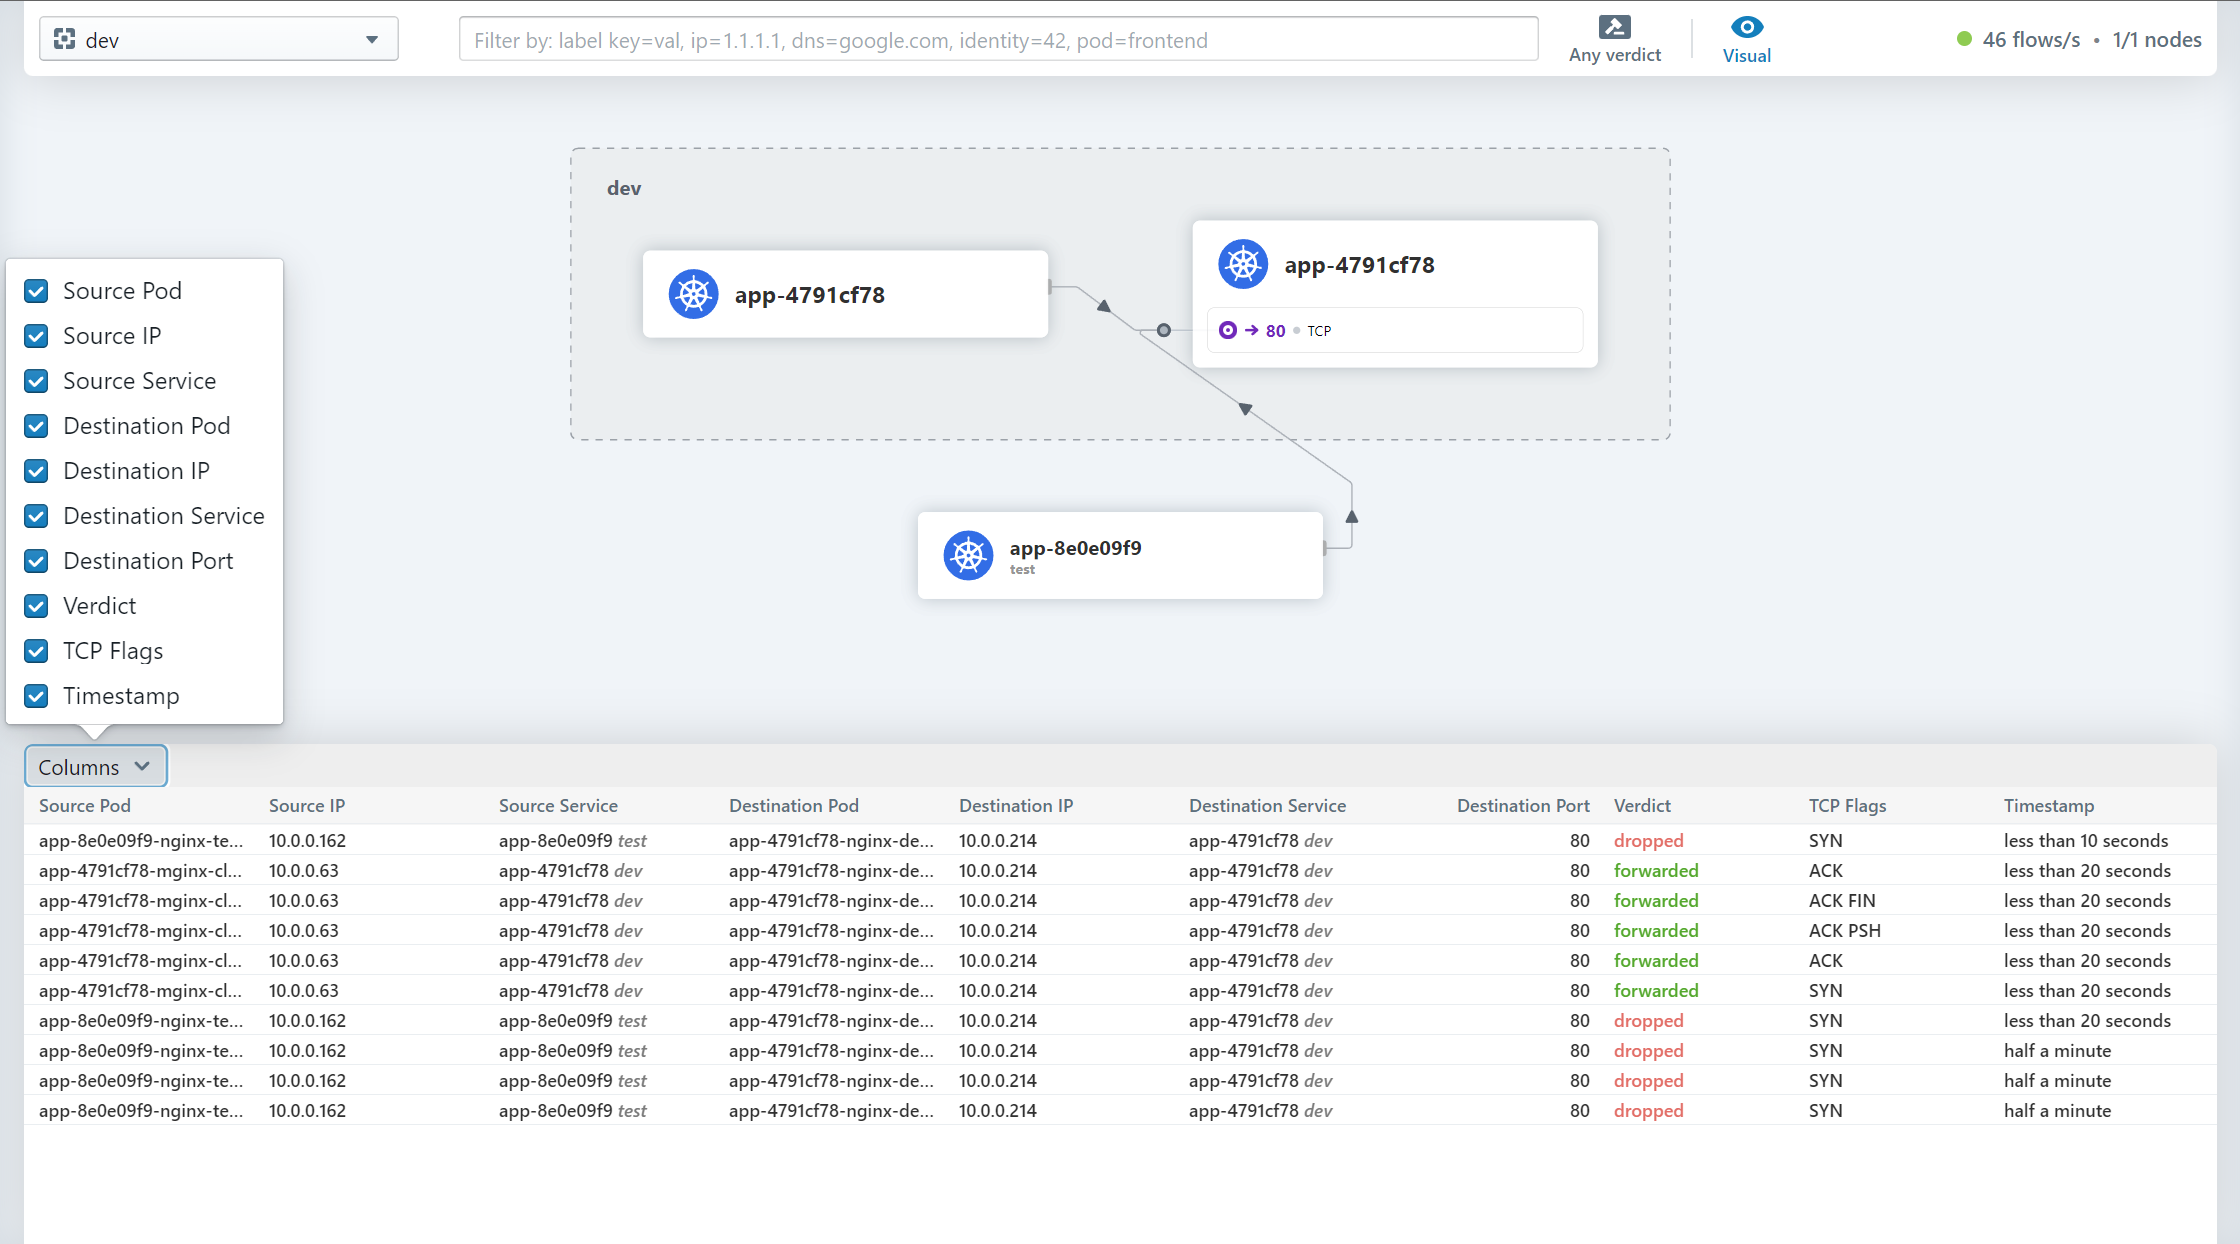
Select the information column displayed by the traffic record
Select the type of traffic to show
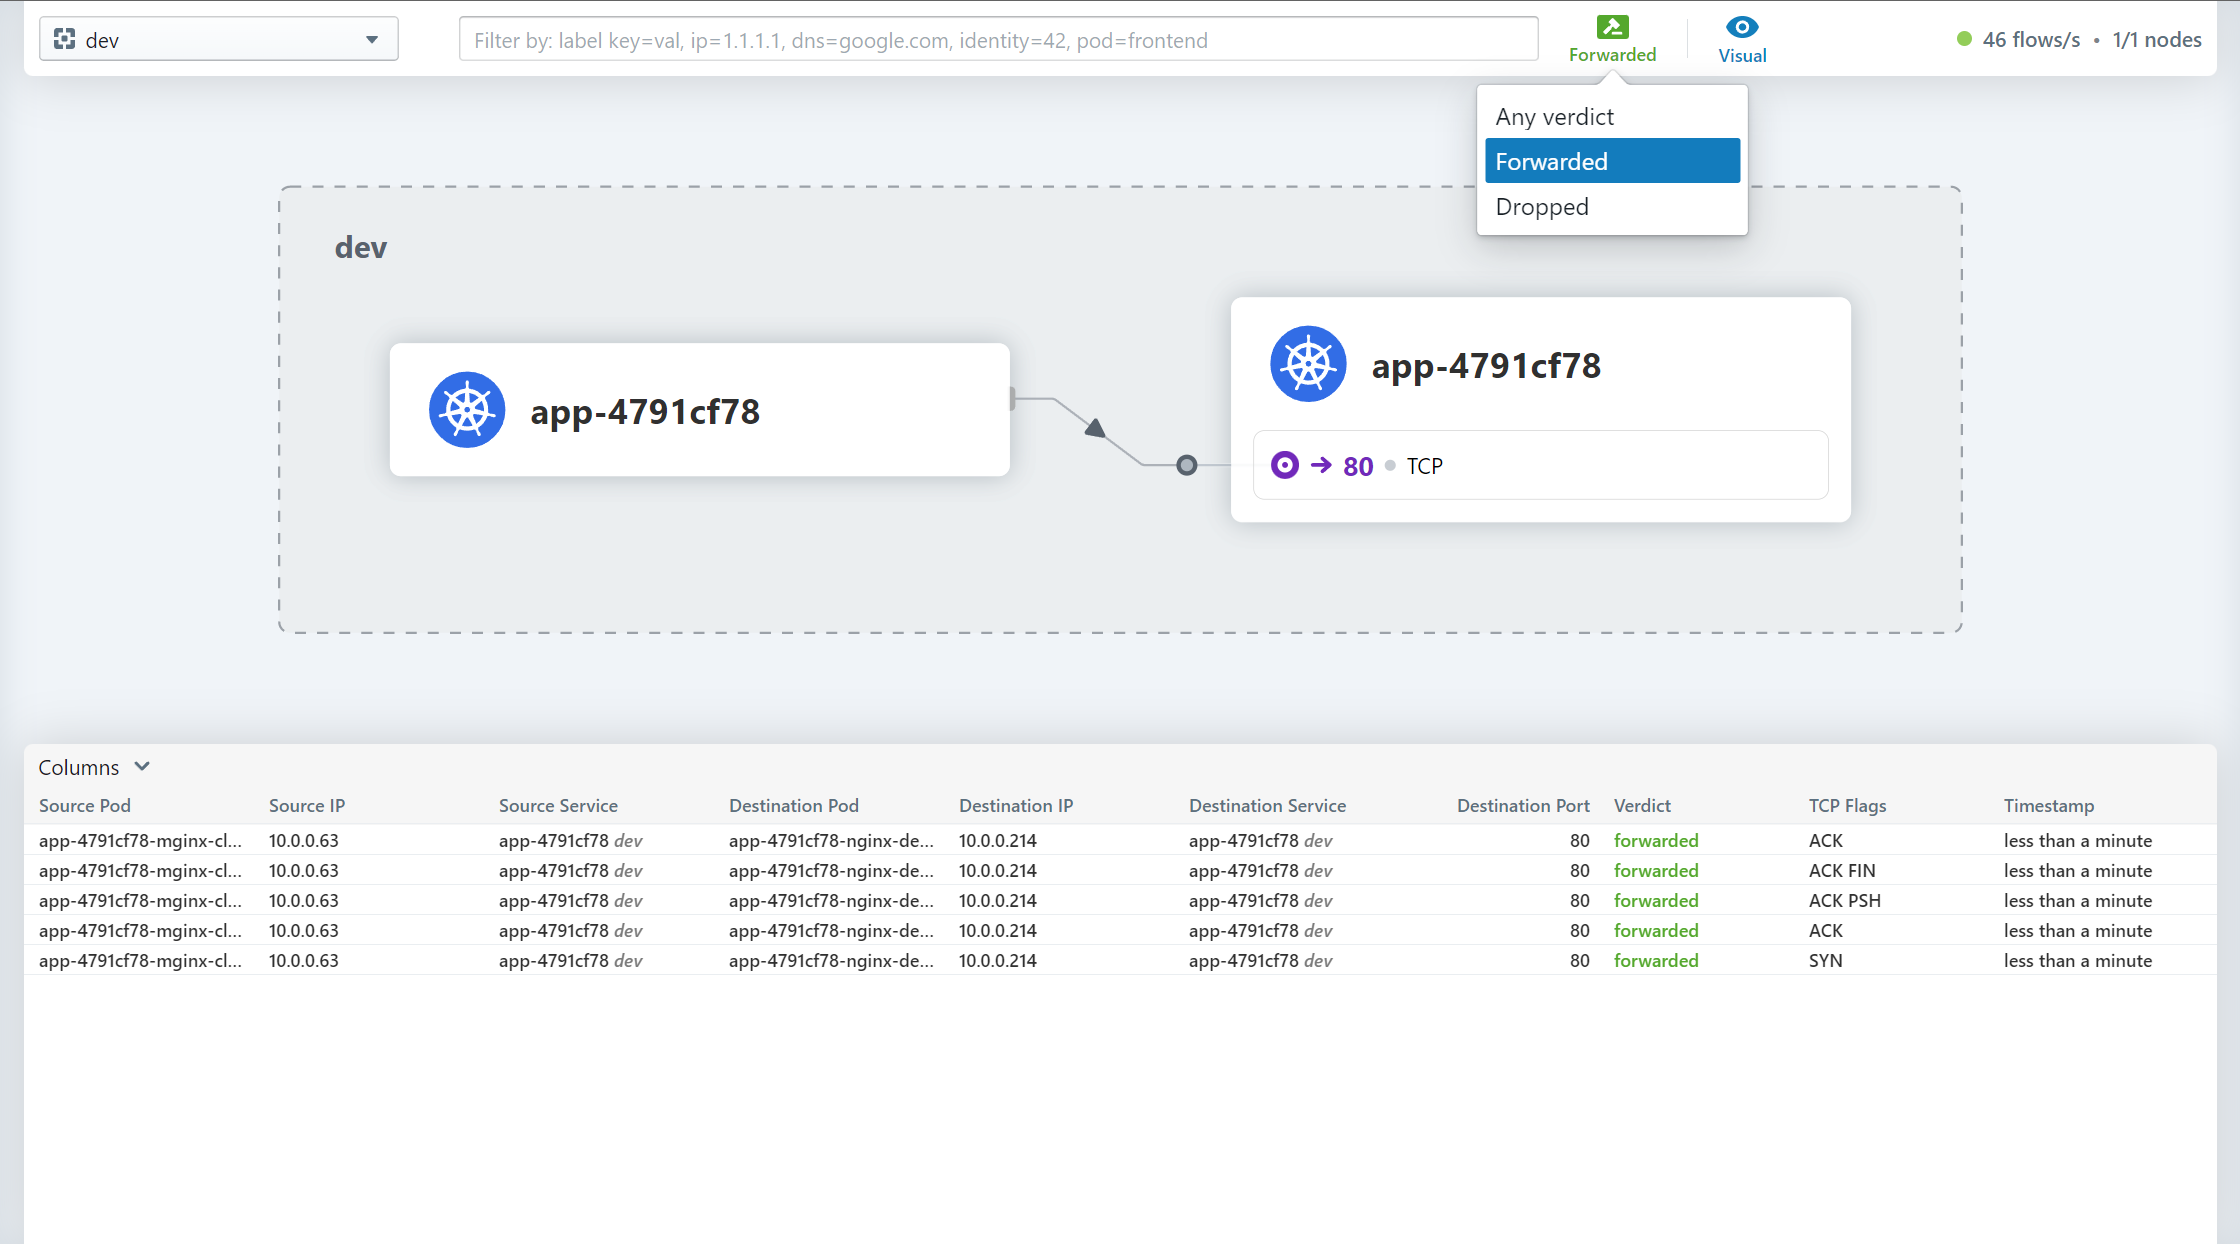
Select whether to ignore special types of traffic during display

docking Prometheus and Grafana
cilium Provides deployment Prometheus and Grafana Of yaml file , Which includes Grafana Template file , but cilium There are no open monitoring indicators when installed by default , Therefore, the monitoring indicators need to be enabled before deployment Prometheus and Grafana
Start monitoring indicators
helm upgrade cilium cilium/cilium --version 1.11.2 \ --namespace kube-system \ --reuse-values \ --set prometheus.enabled=true \ --set operator.prometheus.enabled=true \ --set hubble.enabled=true \ --set hubble.metrics.enabled="{dns,drop,tcp,flow,port-distribution,icmp,http}"Deploy Prometheus and Grafana
$ kubectl apply -f https://raw.githubusercontent.com/cilium/cilium/1.11.2/examples/kubernetes/addons/prometheus/monitoring-example.yamlnamespace/cilium-monitoring createdserviceaccount/prometheus-k8s createdconfigmap/grafana-config createdconfigmap/grafana-cilium-dashboard createdconfigmap/grafana-cilium-operator-dashboard createdconfigmap/grafana-hubble-dashboard createdconfigmap/prometheus createdclusterrole.rbac.authorization.k8s.io/prometheus unchangedclusterrolebinding.rbac.authorization.k8s.io/prometheus unchangedservice/grafana createdservice/prometheus createddeployment.apps/grafana createddeployment.apps/prometheus createdConfirm the operation status
$ kubectl get po -n cilium-monitoringNAME READY STATUS RESTARTS AGEgrafana-d69c97b9b-5ztrj 1/1 Running 0 5d20hprometheus-655fb888d7-456n4 1/1 Running 0 5d20h$ kubectl get svc -n cilium-monitoringNAME TYPE CLUSTER-IP EXTERNAL-IP PORT(S) AGEgrafana ClusterIP 10.43.230.15 <none> 3000/TCP 5d20hprometheus ClusterIP 10.43.219.180 <none> 9090/TCP 5d20hOpen external access
Temporarily open
kubectl -n cilium-monitoring port-forward service/grafana --address 0.0.0.0 --address :: 3000:3000kubectl -n cilium-monitoring port-forward service/prometheus --address 0.0.0.0 --address :: 9090:9090For a long time
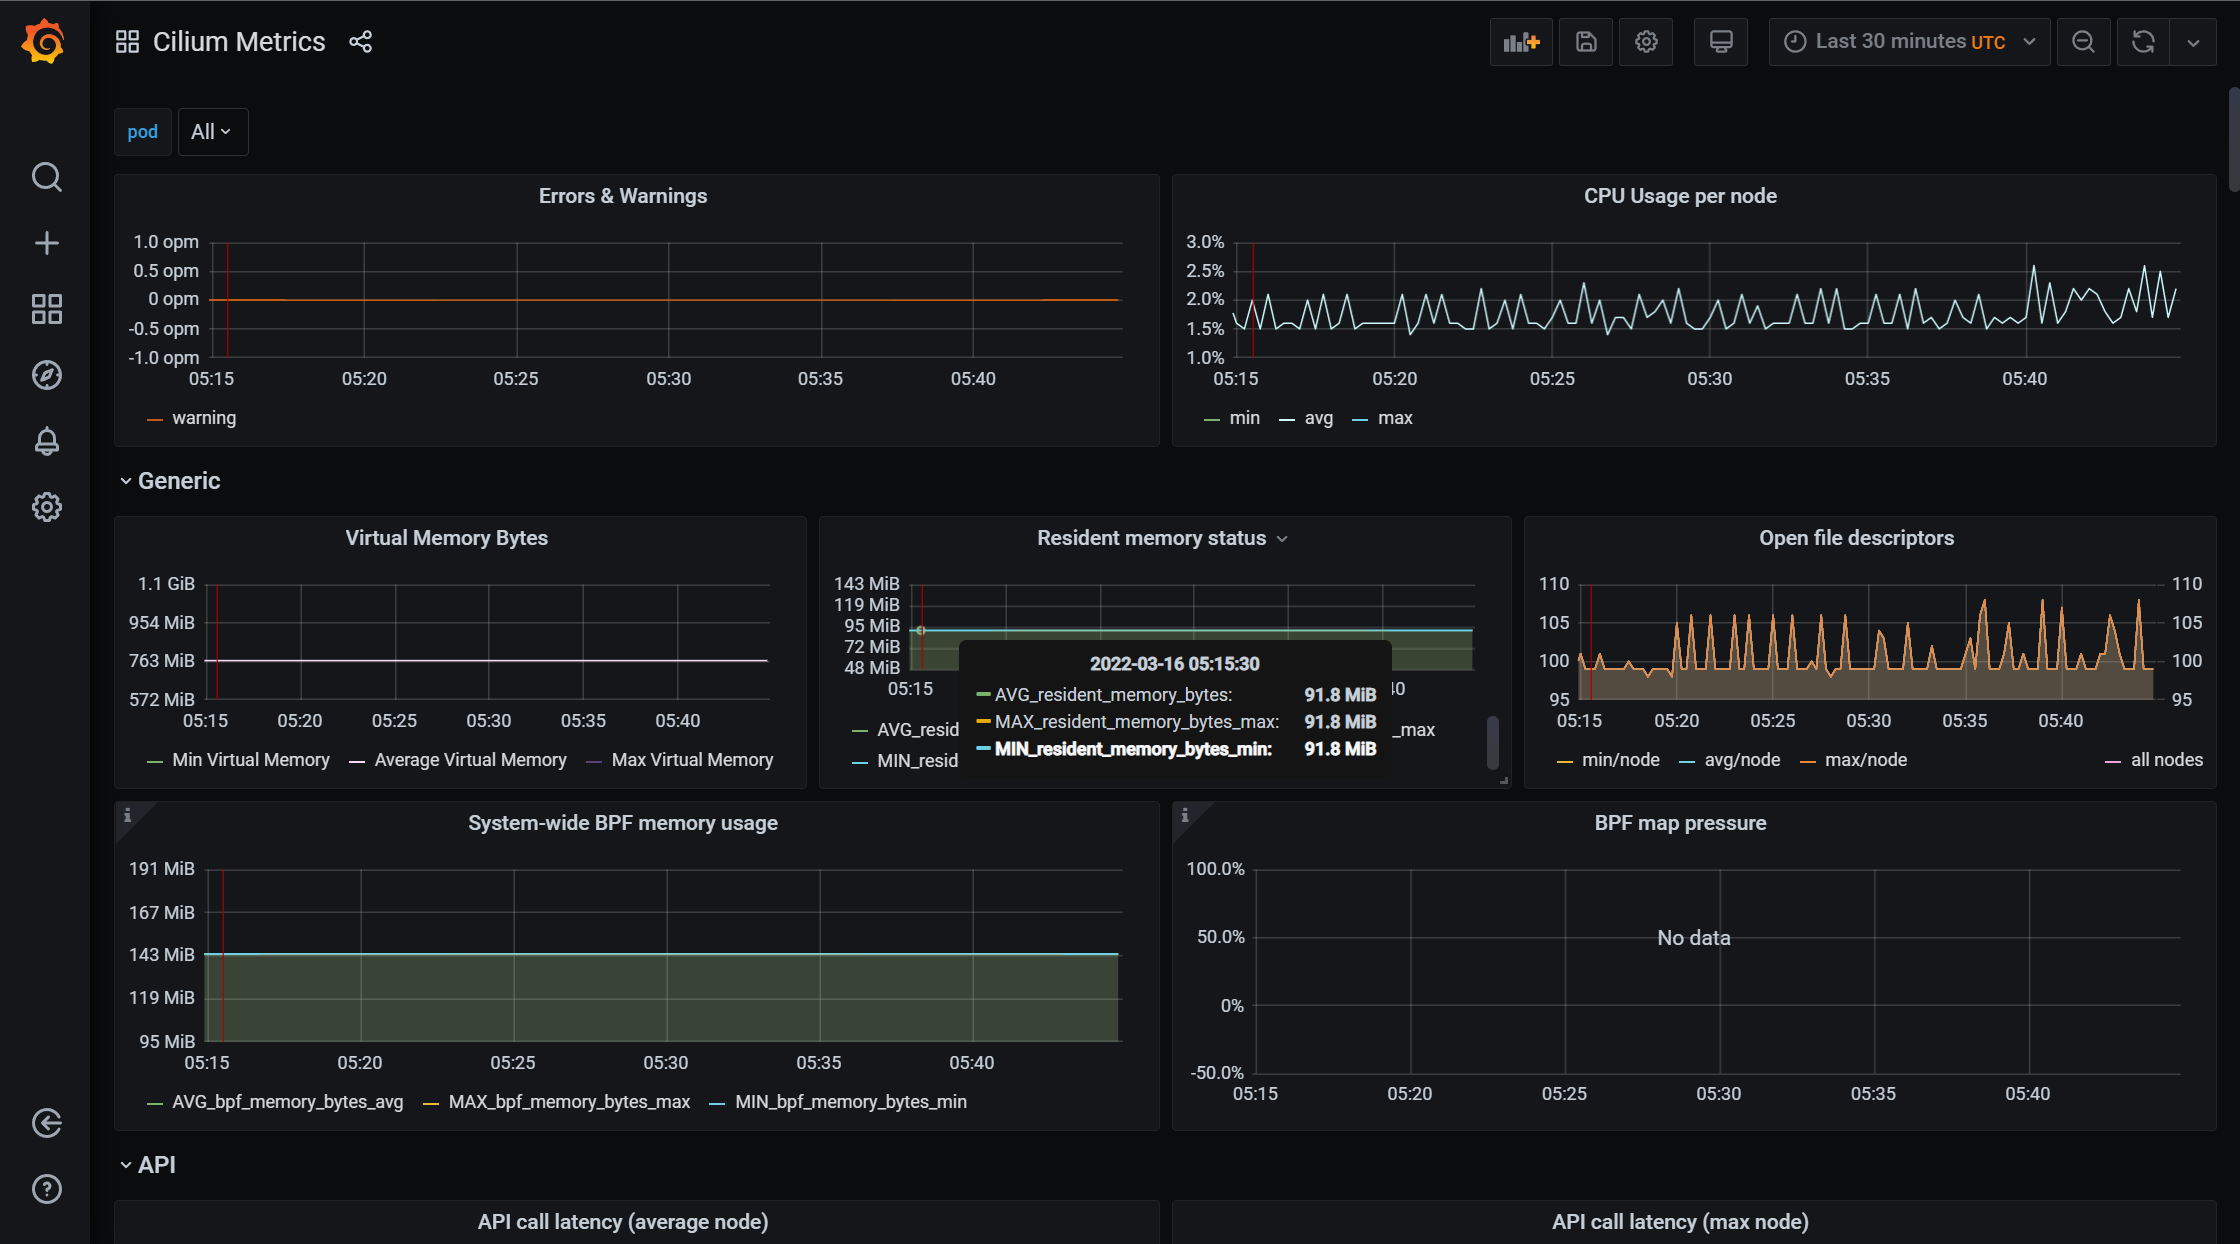
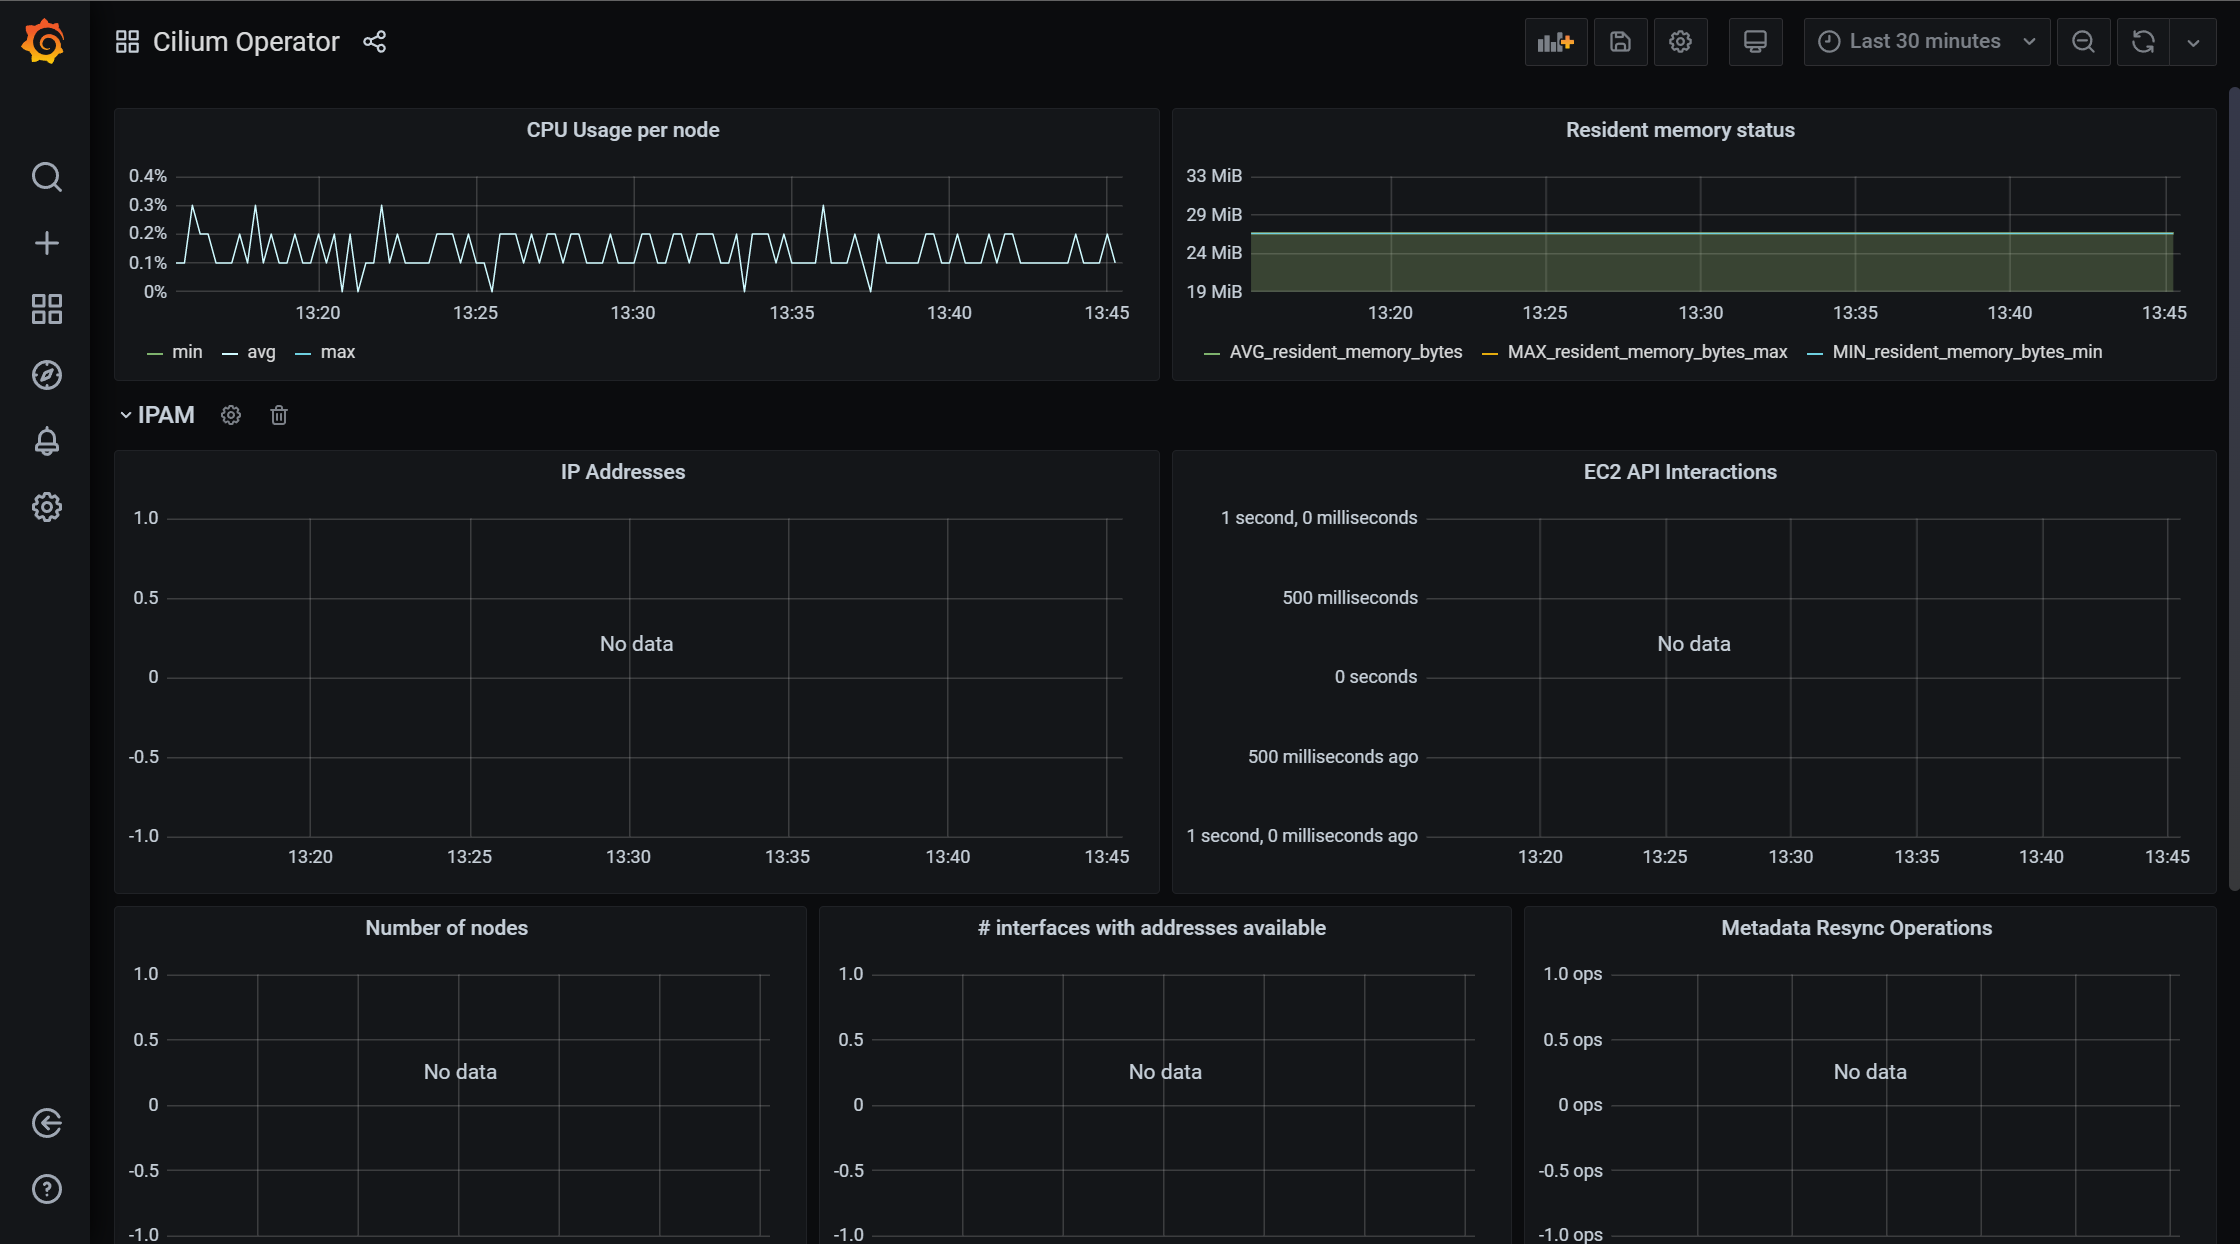
Grafana Display information
Cilium Metrics
Cilium Operator
Hubble

边栏推荐
- Call pytorch API to complete linear regression
- 【雅思口语】安娜口语学习记录 Part3
- Rainbond 5.6 版本发布,增加多种安装方式,优化拓扑图操作体验
- Offer harvester: add and sum two long string numbers (classic interview algorithm question)
- Wang Zijian: is the NFT of Tencent magic core worth buying?
- The largest 3 same digits in the string of leetcode simple question
- 【Go ~ 0到1 】 第七天 获取时间戳,时间比较,时间格式转换,Sleep与定时器
- 机器人教育在动手实践中的真理
- Lua 编程学习笔记
- Explore creativity in steam art design
猜你喜欢
Myabtis_Plus
![[quick start of Digital IC Verification] 10. Verilog RTL design must know FIFO](/img/56/82f4533b5bded73df222ef65101a72.png)
[quick start of Digital IC Verification] 10. Verilog RTL design must know FIFO
【无标题】

opencv学习笔记一——读取图像的几种方法
Splunk查询csv lookup table数据动态查询
Rainbond 5.6 版本发布,增加多种安装方式,优化拓扑图操作体验
jeeSite 表单页面的Excel 导入功能

The simple problem of leetcode is to judge whether the number count of a number is equal to the value of the number
漏洞复现-easy_tornado
在Rainbond中一键部署高可用 EMQX 集群
随机推荐
Don't stop chasing the wind and the moon. Spring mountain is at the end of Pingwu
[quick start of Digital IC Verification] 11. Introduction to Verilog testbench (VTB)
Zcmu--1396: queue problem (2)
Call pytorch API to complete linear regression
ZCMU--1396: 队列问题(2)
单元测试报告成功率低
Splunk查询csv lookup table数据动态查询
船载雷达天线滑环的使用
调用 pytorch API完成线性回归
Rainbond 5.6 版本发布,增加多种安装方式,优化拓扑图操作体验
offer收割机:两个长字符串数字相加求和(经典面试算法题)
The legend about reading the configuration file under SRC
数据库实时同步利器——CDC(变化数据捕获技术)
ZCMU--1492: Problem D(C语言)
Rainbond结合NeuVector实践容器安全管理
Use of any superclass and generic extension function in kotlin
[quick start of Digital IC Verification] 13. SystemVerilog interface and program learning
Lua programming learning notes
eBPF Cilium实战(1) - 基于团队的网络隔离
Famine cloud service management script