当前位置:网站首页>Detailed introduction to drawing complex surfaces using the plot_surface command
Detailed introduction to drawing complex surfaces using the plot_surface command
2022-08-02 15:32:00 【Yang Laotou Soft Worker】
一、引言
The 3 d geometry in,Often need to draw the complex curved surface,For example, the closed space curved surface.Based on the drawing by planez=1,旋转抛物面z=x^2 + y^2And parabolicy=2xIn the closed surface, for example,In detail usingPython命令plot_surfaceThe process of drawing complex curved surface.
二、Draw a closed surface
1、First draw rotating parabolicz=x^2 + y^2
Consider rotating parabolic function domain is a circle domain,So using polar coordinates to indicate the graphic abscissa and ordinate,Let get some graphics look better on the vision.
具体的步骤为:
1)First of all make graphics window,And with the provisions of the three-dimensional coordinate system
2)Determine the extremely diameter and Angle of the grid coordinates
3)According to the relationship of rectangular coordinates and polar coordinates gets the abscissa of rotating paraboloid、Axis and the vertical coordinates of
4)利用plot_surfaceFunction mapping rotating parabolic
5)Increase each coordinate axis labels,Determine the Angle of 3 d graphics
参考代码如下:
import matplotlib.pyplot as plt
import numpy as np
import math

fig = plt.figure()             #建立图形窗口
ax = fig.gca( projection = '3d' )  #Using 3 d coordinate
theta = np.arange( 0, 2 * math.pi, 0.05 )
rou  = np.arange( 0, 1, 0.005 )
T, R = np.meshgrid( theta, rou ) #Polar Angle and diameter of the grid coordinates
Xp = R * np.cos(T)   #Abscissa based on polar coordinates calculation
Yp = R * np.sin(T)    #Based on polar coordinates to calculate the vertical
Zp = Xp**2 + Yp**2  #The abscissa and ordinate generation into the rotating parabolic function to get the vertical coordinates
ax.plot_surface( Xp, Yp, Zp, cstride = 1, rstride = 2, edgecolor = 'b' )  #Draw the rotating parabolic
ax.set_xlabel( 'x' )
ax.set_ylabel( 'y' )
ax.set_zlabel( 'z' )
ax.view_init( 20, 45 )
上述代码运行结果为: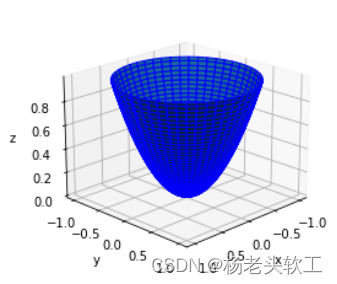
2、Draw the parabolicy=x^2
With the above drawing of rotating paraboloid experience,此处直接上代码.
fig = plt.figure()   #建立图形窗口
ax = fig.gca( projection = '3d' )  #三维坐标系
Xc, Zc = np.meshgrid( np.arange(-1, 1, 0.005), np.arange(0, 1, 0.005 ) )#Independent variable grid coordinates
Yc = Xc**2
ax.plot_surface( Xc, Yc, Zc, cstride = 1, rstride = 2, edgecolor = 'y' )#绘图
ax.set_xlabel( 'x' )
ax.set_ylabel( 'y' )
ax.set_zlabel( 'z' )
ax.view_init( 20, 45 )
上述代码运行结果为: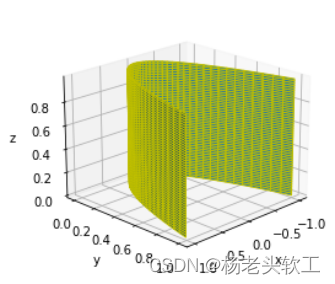
3、Draw with rotating parabolic plane with the same domainz=1
With the above drawing of rotating paraboloid experience,此处直接上代码.
fig = plt.figure()              #建立图形窗口
ax = fig.gca( projection = '3d' )  #三维坐标系
[ m, n ] = np.shape( Xp )
Zf = np.ones( Xp.shape )
ax.plot_surface( Xp, Yp, Zf, cstride = 1, rstride = 2, edgecolor = 'r' )
ax.set_xlabel( 'x' )
ax.set_ylabel( 'y' )
ax.set_zlabel( 'z' )
ax.view_init( 20, 45 )
上述代码运行结果为: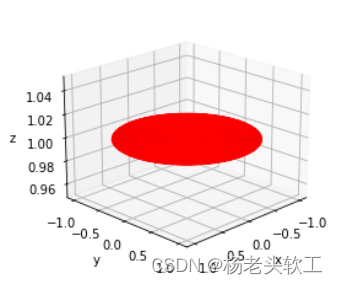
4、The above code into a running can get the graphic below: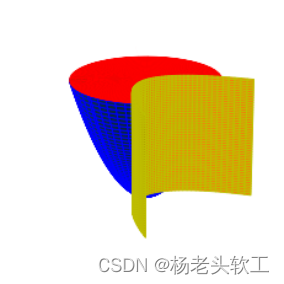
注意:Need to draw the parabolic and code in the following two statements to delete
fig = plt.figure()              #建立图形窗口
ax = fig.gca( projection = '3d' )  #三维坐标系
5、Delete redundant on each graphic primitives
从上图可以看出,结果不尽人意,If you can remove the surface spare parts,You can get better closed surface.So speak the following code is used to delete respectively select paraboloid、On the surface of the parabolic peace redundant data,Just need to make extra the vertical coordinate components of the primitive value ofNone即可.
1)Delete the parabolic redundant data(This method is of low efficiency)
[ mc, nc ] = np.shape( Xc )
for i in range( mc ):
    for j in range( nc ):
        if Zc[ i, j ] < Xc[ i, j ] * Xc[ i, j ] + Yc[ i, j ] * Yc[ i, j ]:
            Zc[ i, j ] = None
      ```
2)Delete selected paraboloid and redundant data(This method is of low efficiency)
```python
[ m, n ] = np.shape( Xp )
Zf = np.ones( Xp.shape )
for i in range( m ):
    for j in range( n ):
        if Yp[ i, j ] < Xp[ i, j ] * Xp[ i, j ]:
            Zf[ i, j ] = None
            Zp[ i, j ] = None
So you can get the following visual effect in good shape: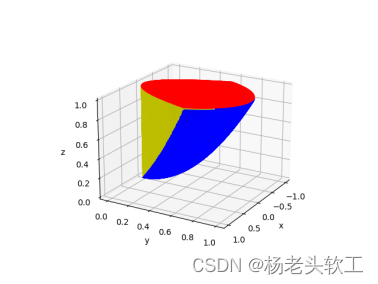
6、The complete drawing closed surface code
import matplotlib.pyplot as plt
import numpy as np
import math
#建立图形窗口
fig = plt.figure()
ax = fig.gca( projection = '3d' )#Axes3D( fig )

#旋转抛物面 Paraboloid 的图形数据
theta = np.arange( 0, math.pi, 0.01 )
rou   = np.arange( 0, 1, 0.01 )
T, R = np.meshgrid( theta, rou )
Xp = R * np.cos(T)
Yp = R * np.sin(T)
Zp = Xp**2 + Yp**2

#抛物柱面 Parabolic Cylinder 的图形数据
Xc, Zc = np.meshgrid( np.arange(-1, 1, 0.01), np.arange(0, 1, 0.01 ) )
Yc = Xc**2
[ mc, nc ] = np.shape( Xc )
#Delete the parabolic redundant data
for i in range( mc ):
    for j in range( nc ):
        if Zc[ i, j ] < Xc[ i, j ] * Xc[ i, j ] + Yc[ i, j ] * Yc[ i, j ]:
            Zc[ i, j ] = None

#平面 flat surface 的图形数据
Zf = np.ones( Xp.shape )
[ m, n ] = np.shape( Xp )
#Deletes data plane and rotating parabolic redundant
for i in range( m ):
    for j in range( n ):
        if Yp[ i, j ] < Xp[ i, j ] * Xp[ i, j ]:
            Zf[ i, j ] = None
            Zp[ i, j ] = None
#绘图
ax.plot_surface( Xc, Yc, Zc, cstride = 1, rstride = 1, edgecolor = 'y' )
ax.plot_surface( Xp, Yp, Zp, cstride = 1, rstride = 1, edgecolor = 'b' )
ax.plot_surface( Xp, Yp, Zf, cstride = 1, rstride = 1, edgecolor = 'r' )
ax.set_xlabel( 'x' )
ax.set_ylabel( 'y' )
ax.set_zlabel( 'z' )
ax.view_init( 20, 30 )
边栏推荐
- 【系统设计与实现】基于flink的分心驾驶预测与数据分析系统
- Failed to install using npx -p @storybook/cli sb init, build a dedicated storybook by hand
- 2.4G无线小模块CI24R1超低成本
- DP4301无线收发SUB-1G芯片兼容CC1101智能家居
- 模板系列-二分
- Win11系统找不到dll文件怎么修复
- 如何用硬币模拟1/3的概率,以及任意概率?
- 系统线性、时不变、因果判断
- A clean start Windows 7?How to load only the basic service start Windows 7 system
- win10系统更新错误代码0x80244022怎么办
猜你喜欢
Win11 keeps popping up User Account Control how to fix it
Codeforces Round #605 (Div. 3)
Mysql连接错误解决
倍增和稀疏表

Win11没有本地用户和组怎么解决
win10 system update error code 0x80244022 how to do
Win10上帝模式干嘛的?Win10怎么开启上帝模式?
基于矩阵计算的线性回归分析方程中系数的估计
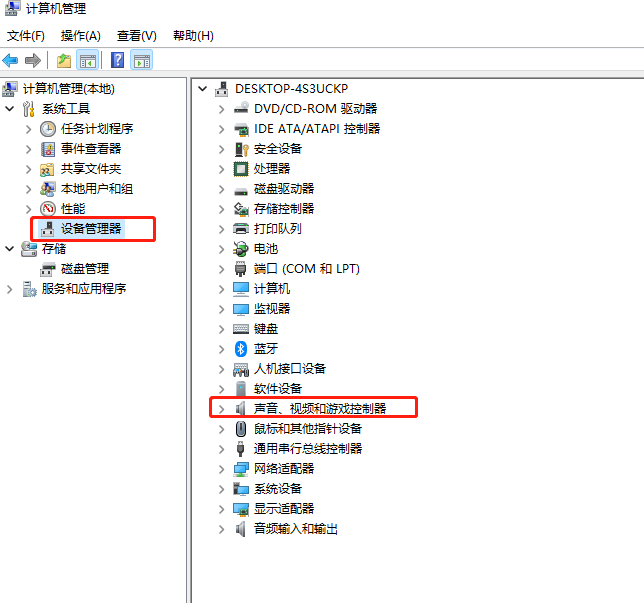
How to update Win11 sound card driver?Win11 sound card driver update method

Do Windows 10 computers need antivirus software installed?
随机推荐
In-depth understanding of Golang's Map
FP7195大功率零压差全程无频闪调光DC-DC恒流芯片(兼容调光器:PWM调光,无极调光,0/1-10V调光)
Cmd Markdown 公式指导手册
STM32LL库——USART中断接收不定长信息
开心一下,9/28名场面合集
DP1332E内置c8051的mcu内核NFC刷卡芯片国产兼容NXP
MATLAB绘制平面填充图入门详解
DP1101兼容CC1101是SUB1GHz无线收发芯片应用于智能家居
STM32LL库使用——SPI通信
The SSE instructions into ARM NEON
cmake configure libtorch error Failed to compute shorthash for libnvrtc.so
C语言函数参数传递模式入门详解
FP7128内置MOS降压恒流调光深度0.01%高辉共阳调光方案
Win10 computer can't read U disk?Don't recognize U disk how to solve?
Detailed explanation of Golang garbage collection mechanism
DP4056电源保护芯片锂电池pin对pinTP4056
Mysql之MVCC
pygame draw arc
Win10无法连接打印机怎么办?不能使用打印机的解决方法
将SSE指令转换为ARM NEON指令