当前位置:网站首页>(super detailed II) detailed visualization of onenet data, how to plot with intercepted data flow
(super detailed II) detailed visualization of onenet data, how to plot with intercepted data flow
2022-07-06 13:20:00 【Lunan wind】
Catalog
Dashboard segment ( Get and upload the last set of data )
Preface
In the last article, we used sensors to access onenet platform , Upload the collected data in real time . When we turn on the device , Open the data flow and look at the rows of refreshed data , Is there any more intuitive method ? For example, intercept the data stream for visual processing , Draw a curve with data points , Or use instruments to feel the changes of collected data ?
Hardware construction
https://blog.csdn.net/qq_45998204/article/details/124686714
See the previous chapter
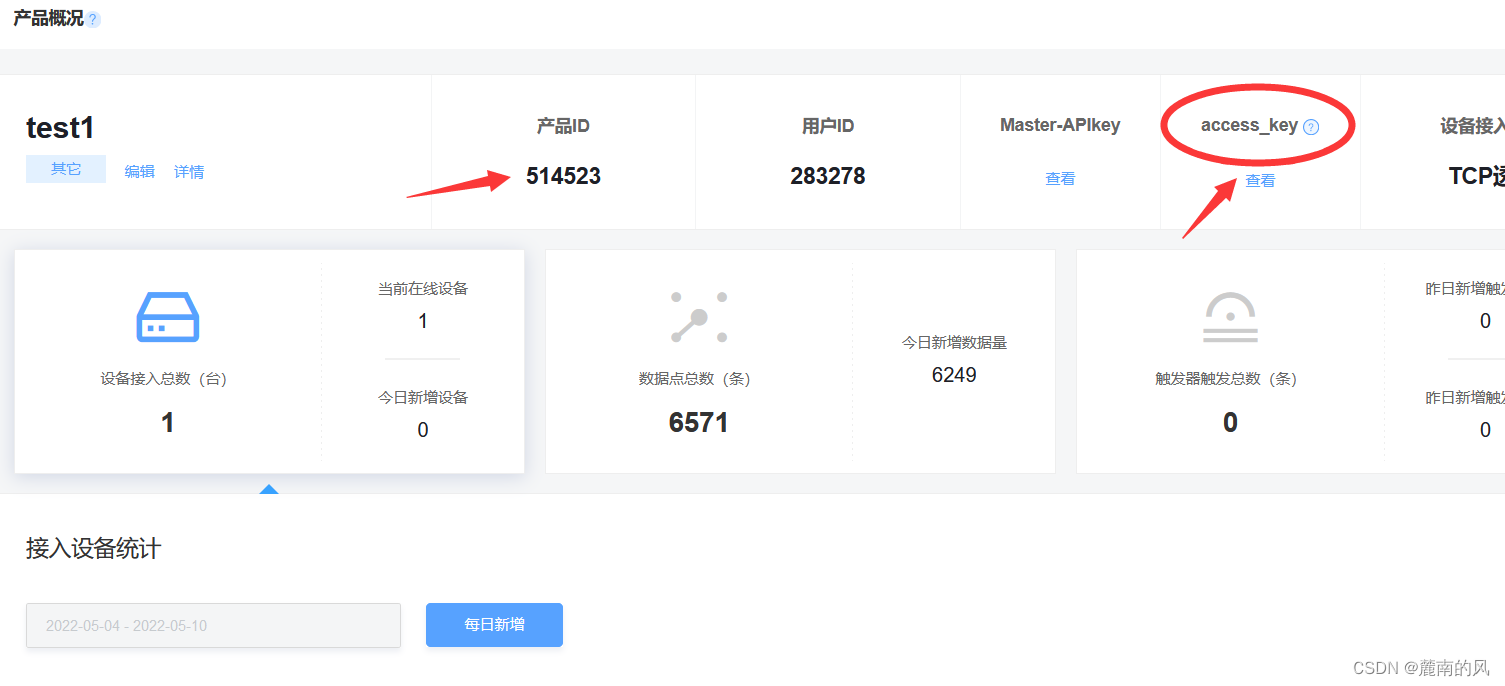
onenet Platform preparation
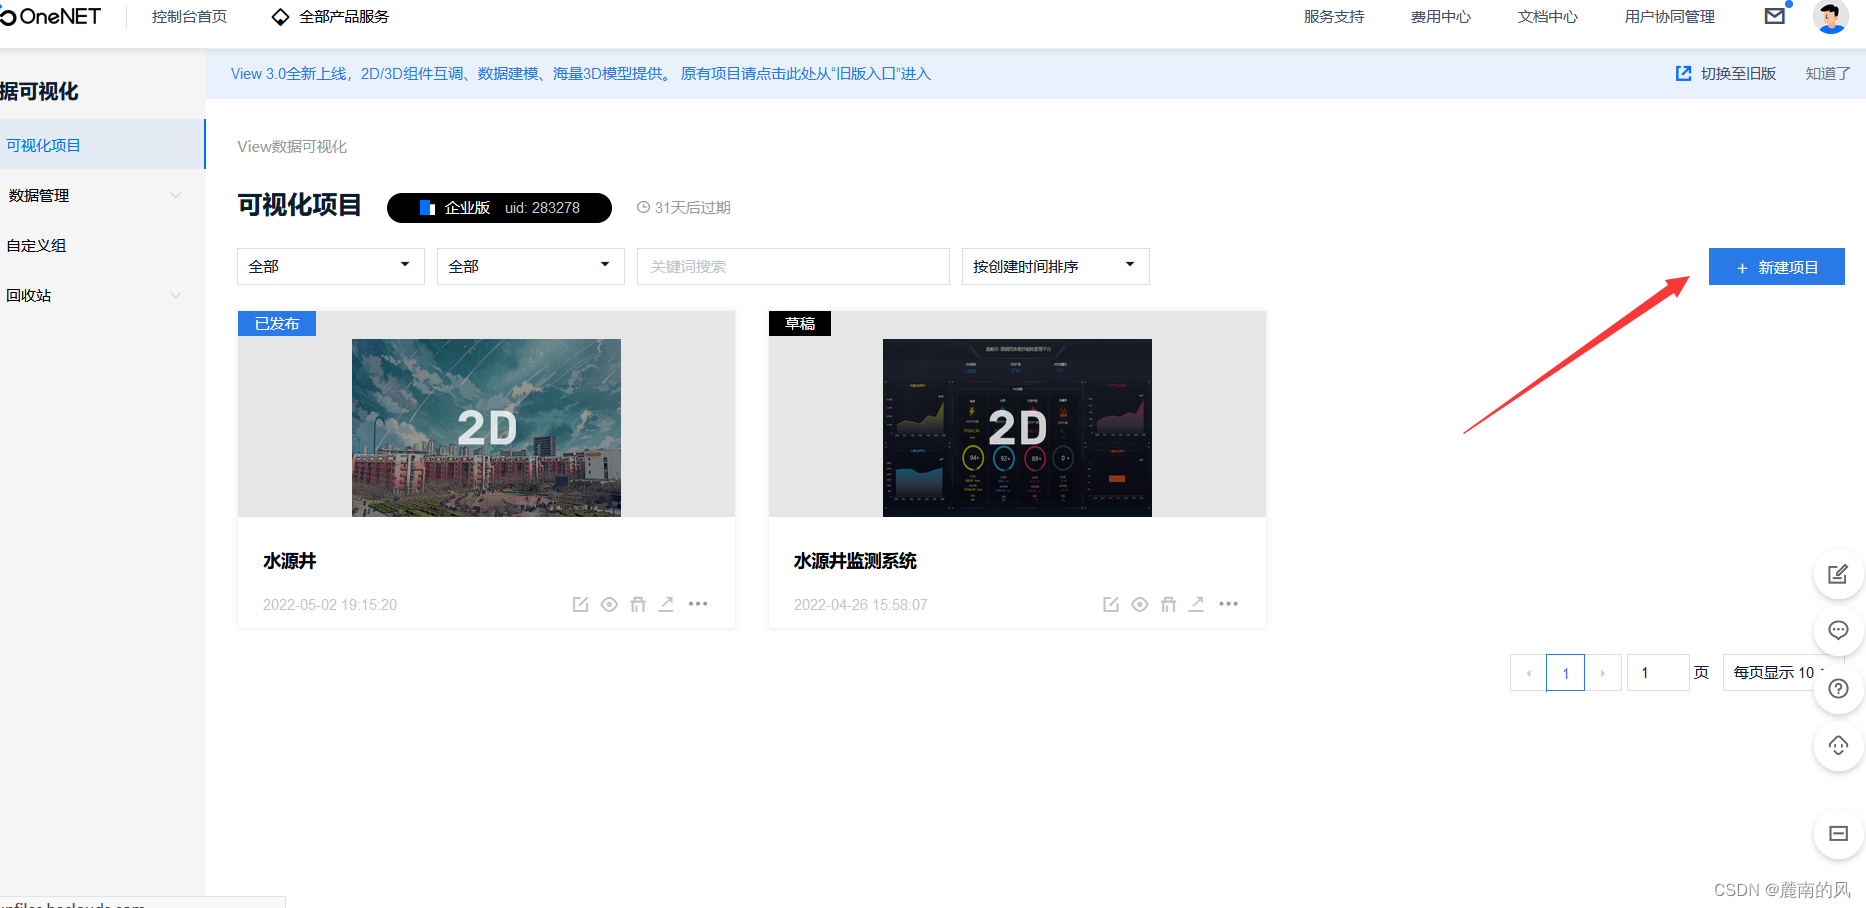
Create a new panel
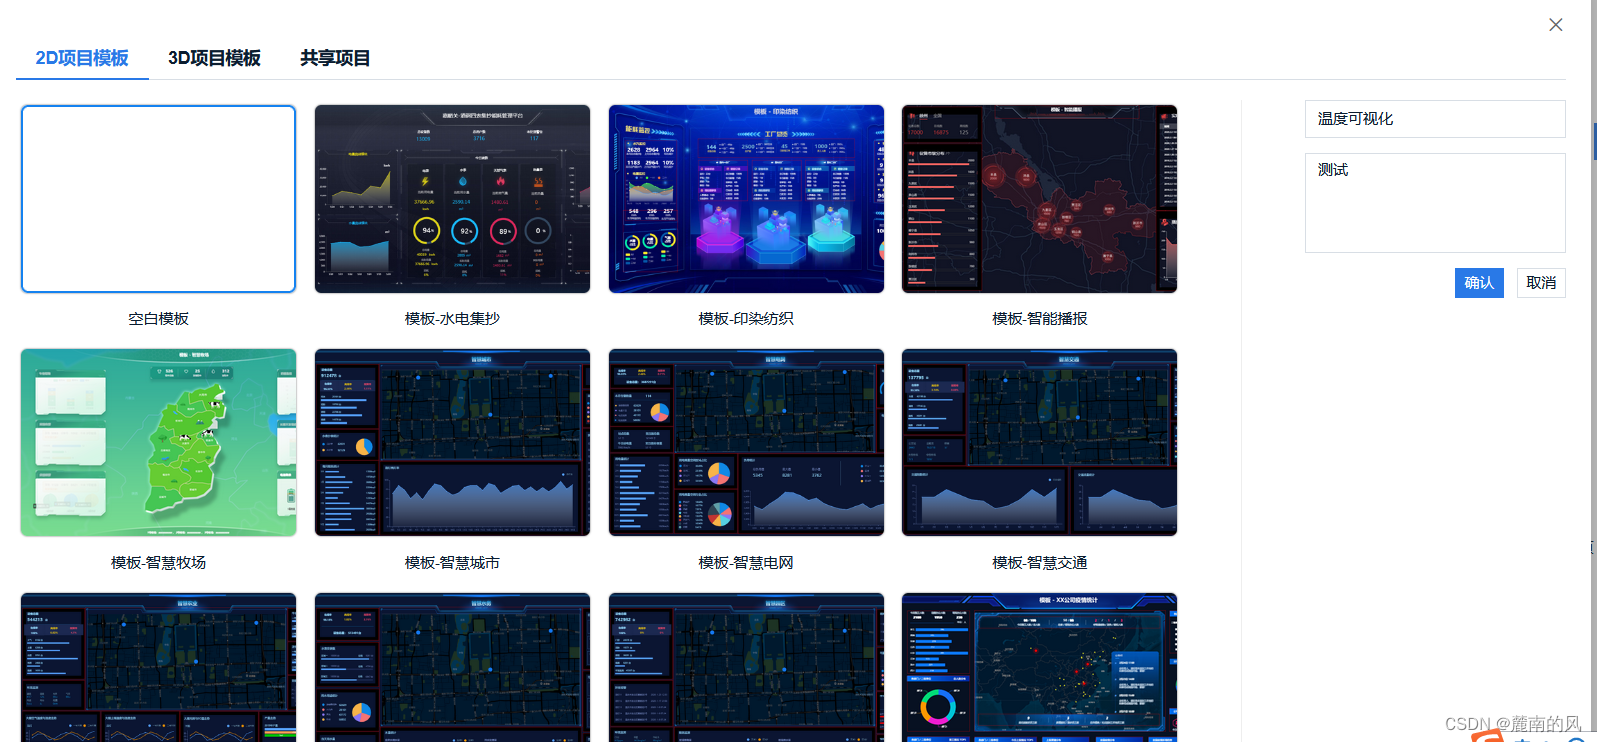
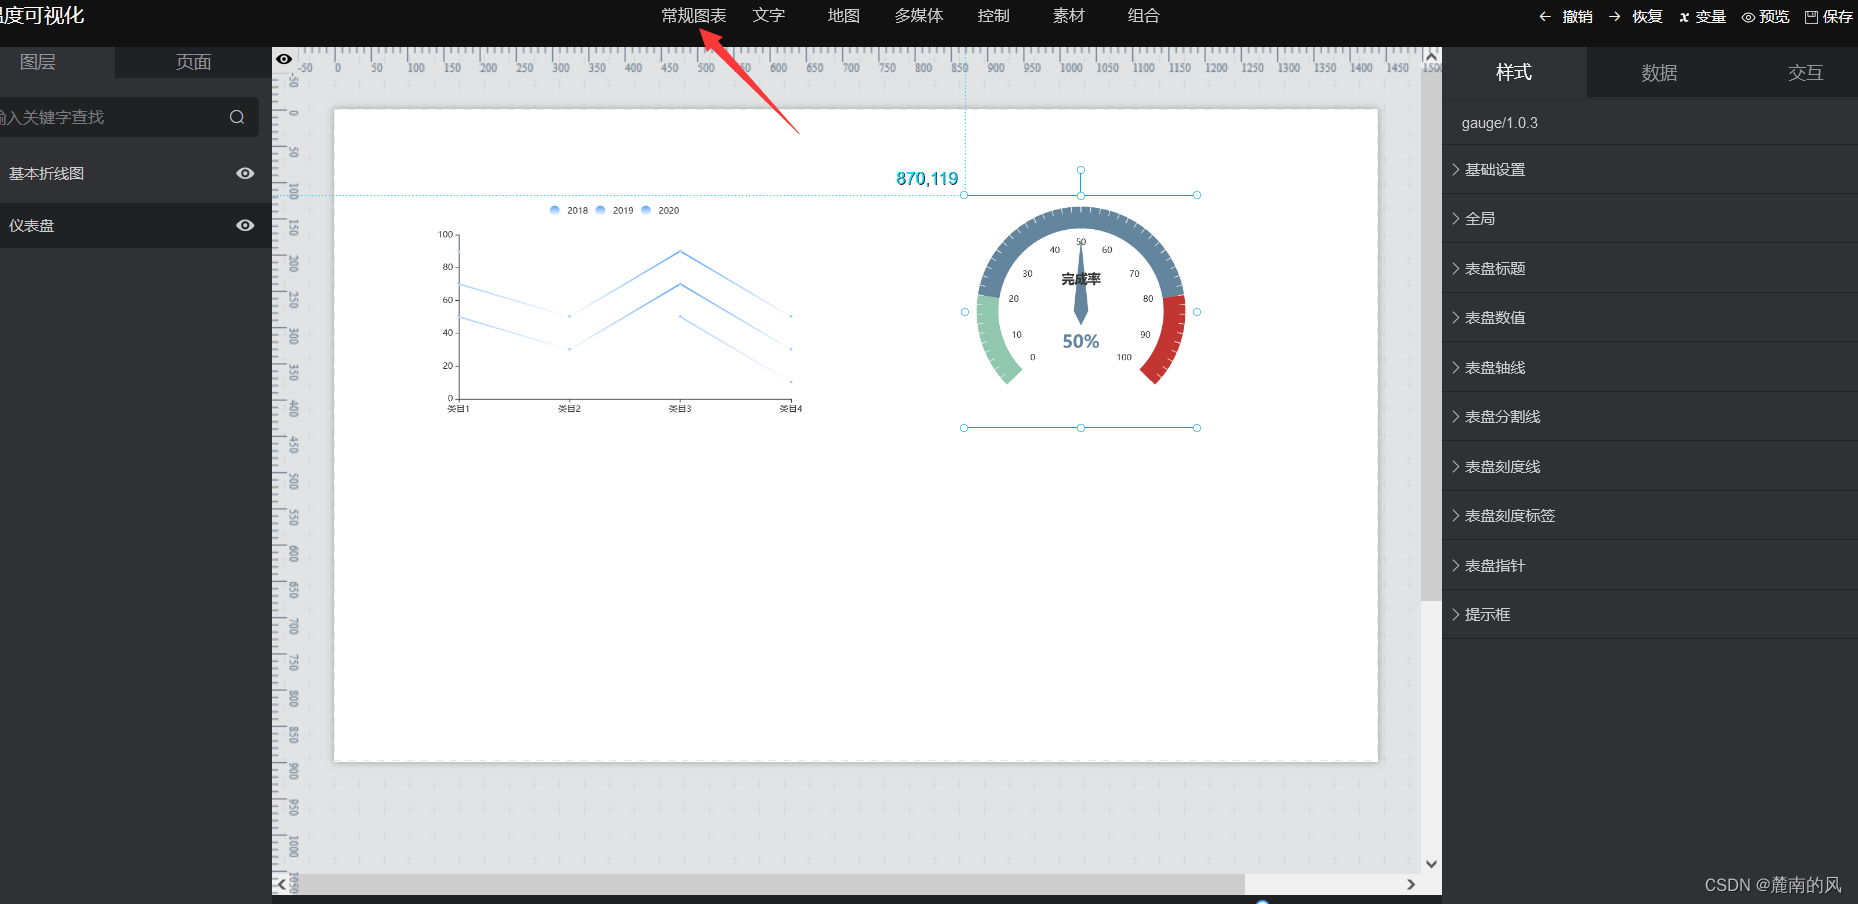
Add regular charts in the required format by yourself
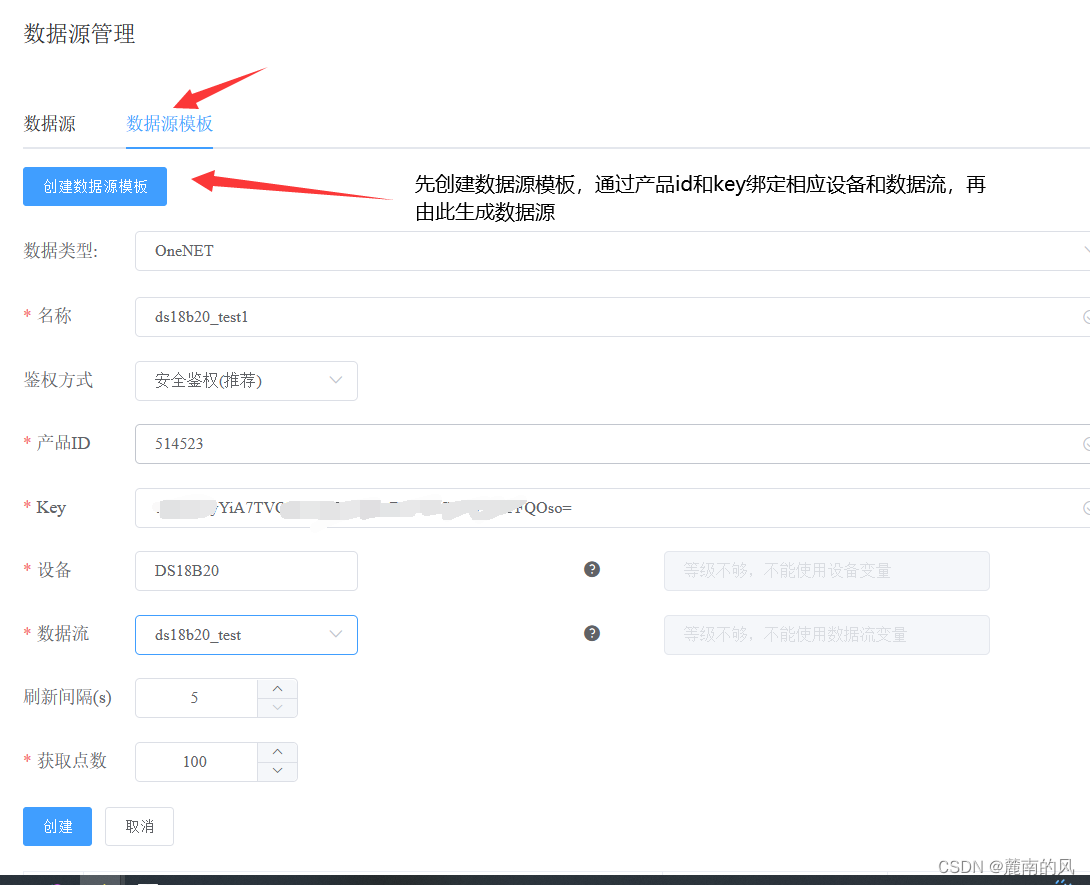
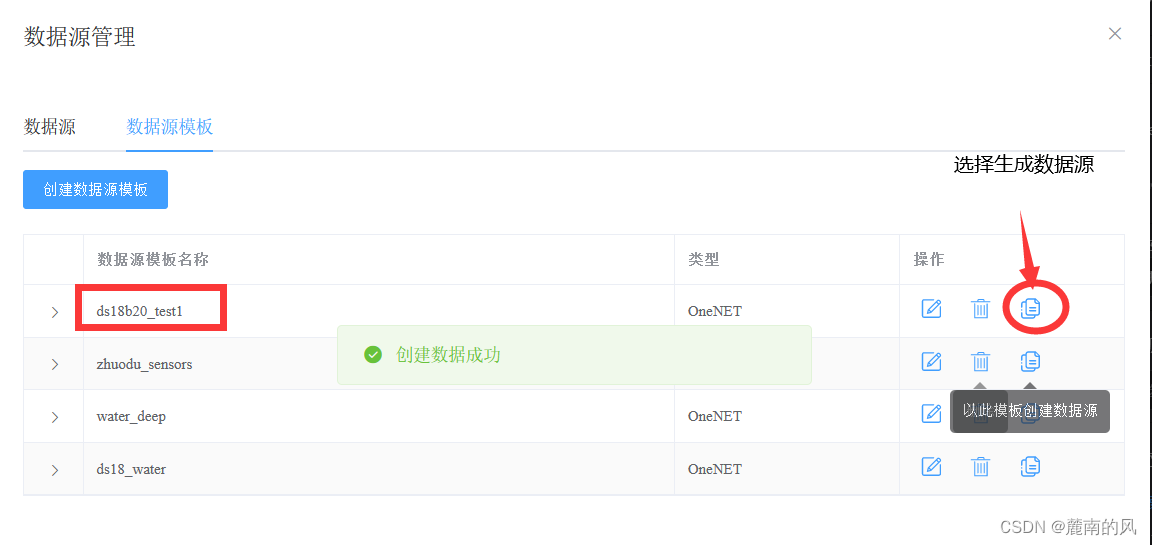
Data flow import
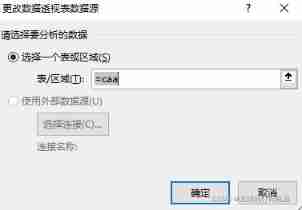
Open the data , Manage data sources
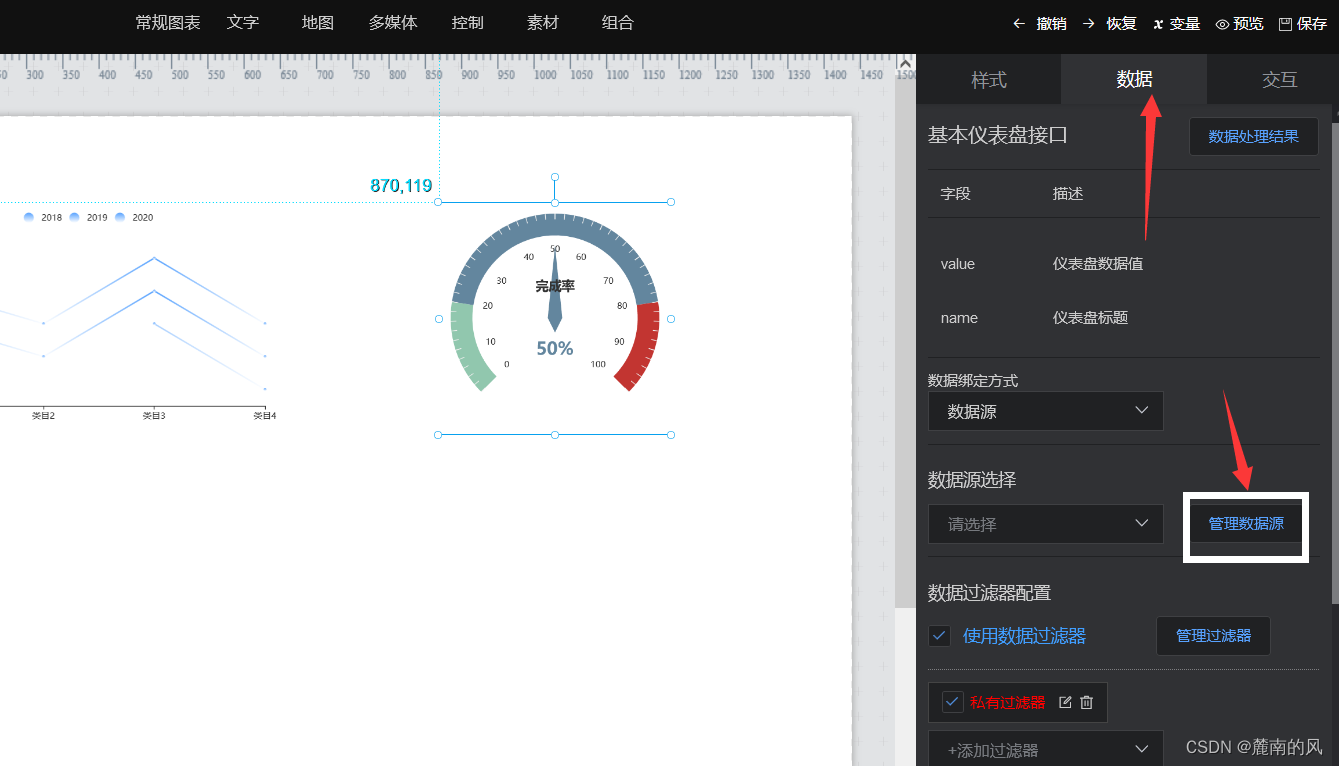
In this way, when we open the data source selection , We can find the data stream we uploaded
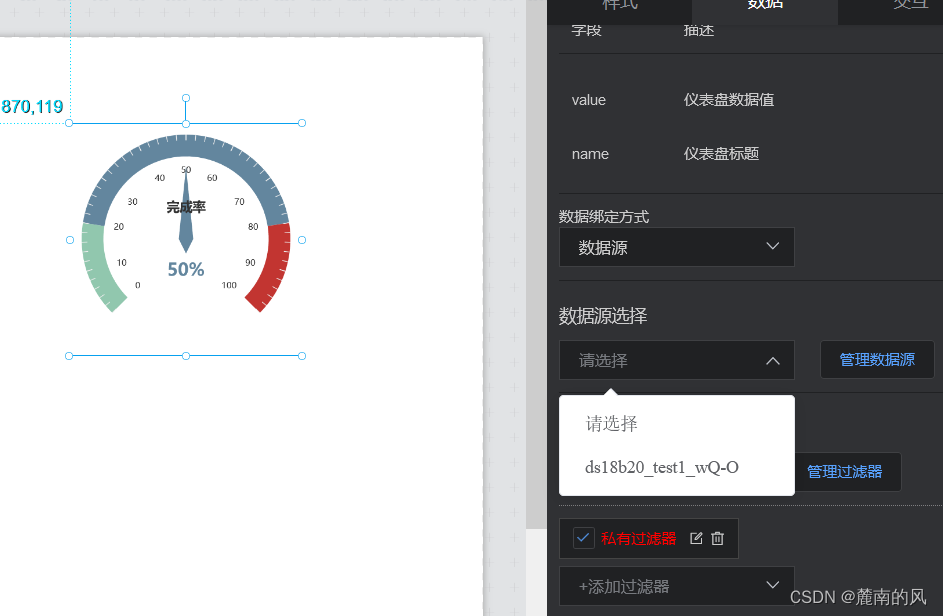
How to control the dashboard , Open the private filter , Make changes , Look at the value changes
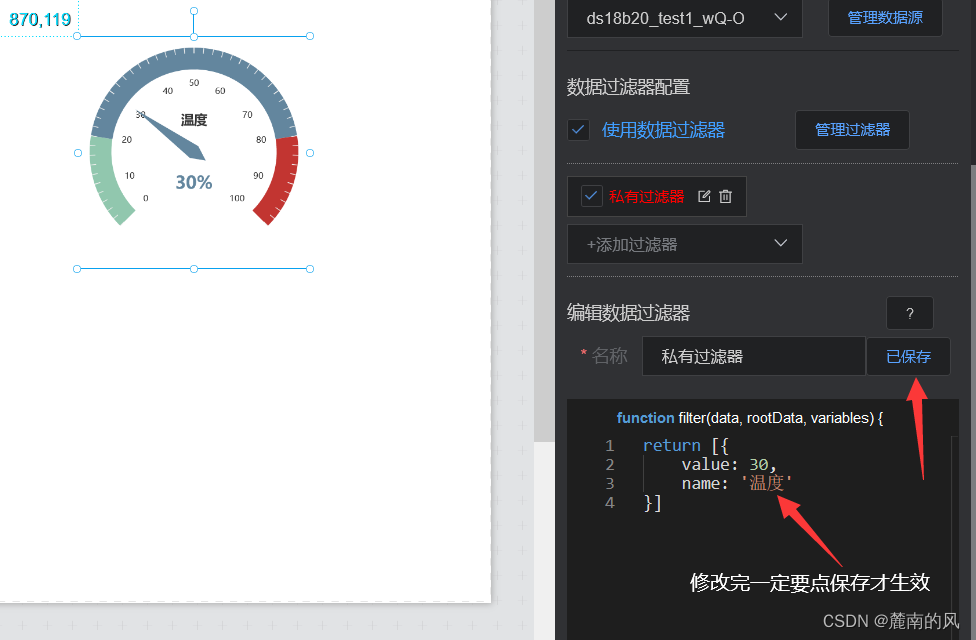
data----- Selected data flow value
rootdata---- All data flow values under the device
OneNET View Filters are provided to personalize data sources , Users can write by themselves JavaScript Code , Realize data structure transformation 、 Screening and some simple calculations
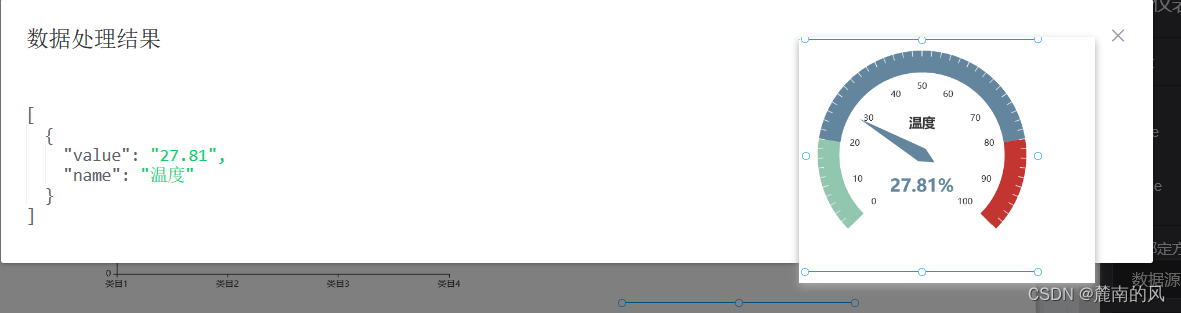
Input data, We can observe that , The dashboard changes with the returned data flow value
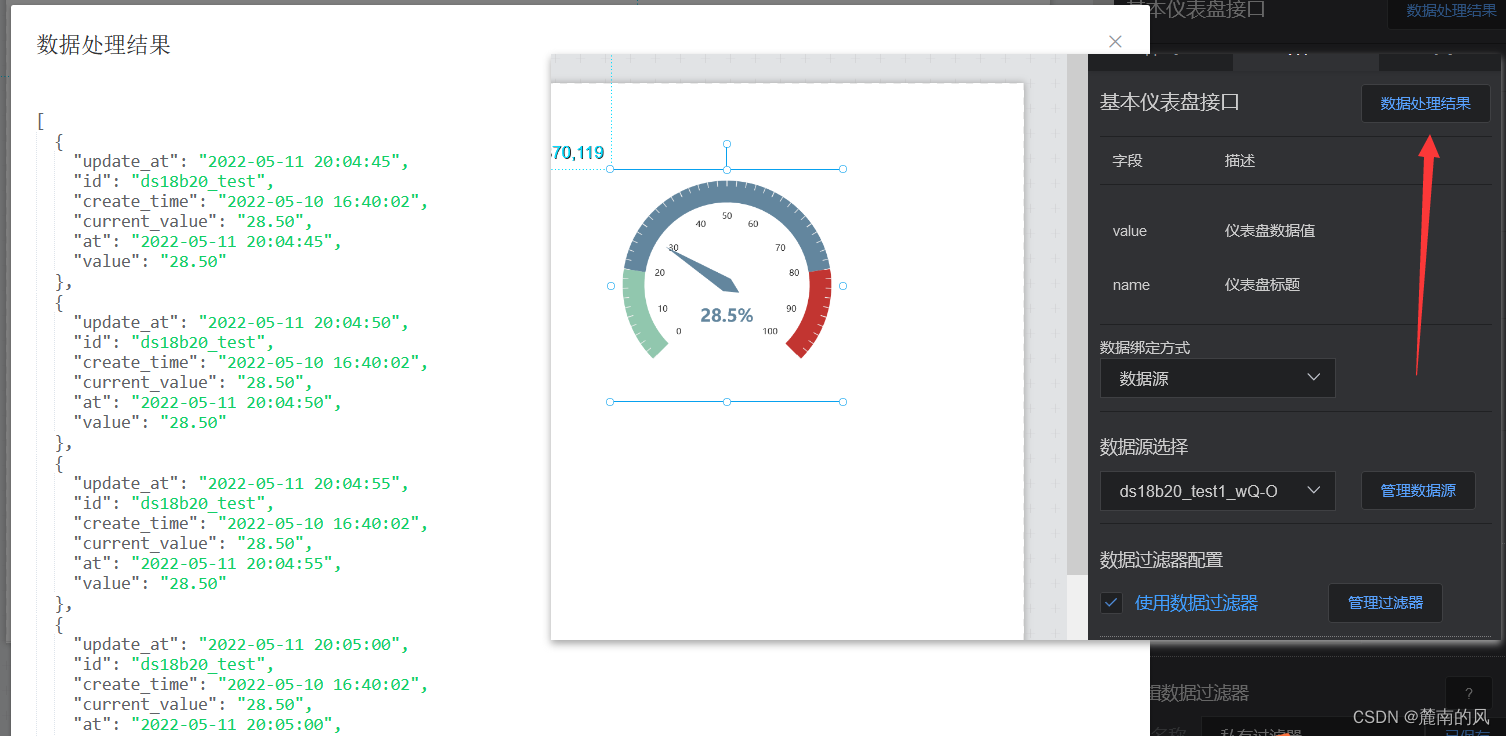
Open the data processing result , You can intuitively observe the information returned by the data flow , We set the refresh interval 5 second , Data points 100, In so many data processing results , We need to intercept The latest set of data Application dashboard display
Next is how to intercept the data values we need to plot
Open the private filter , Make changes , Let it return the last set of data
call function last(arr)
take last(data) Assign to value
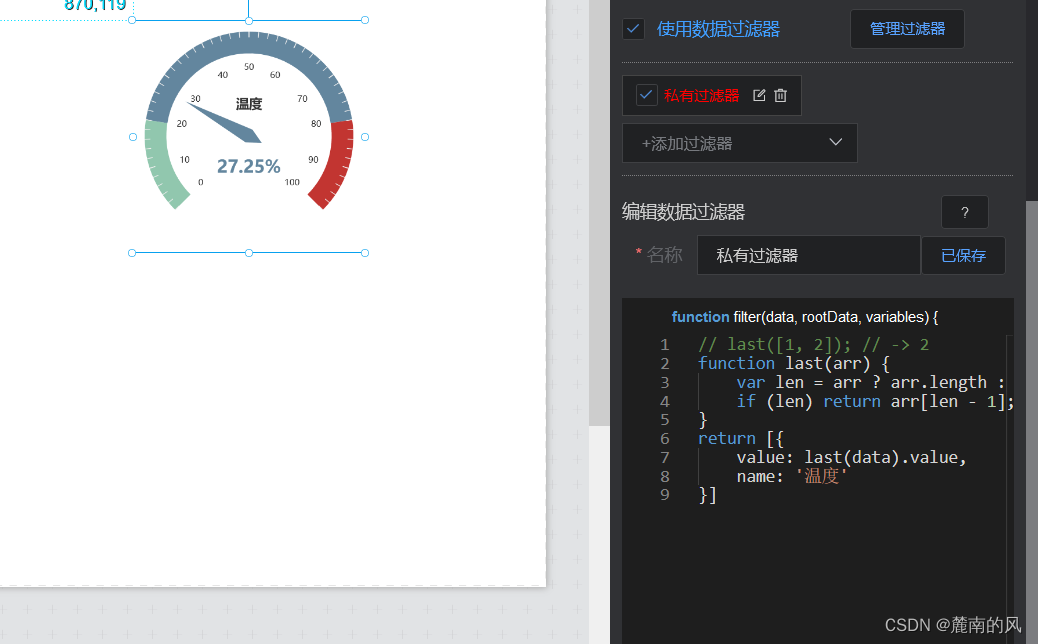
Open the data processing result , The latest set of data shows the same
Dashboard segment ( Get and upload the last set of data )
// last([1, 2]); // -> 2
function last(arr) {
    var len = arr ? arr.length : 0;
    if (len) return arr[len - 1];
}
return [{
    value: last(data).value,
    name: ' temperature '
}]
After modifying the program, be sure to save
Observing a single data cannot express the overall situation well
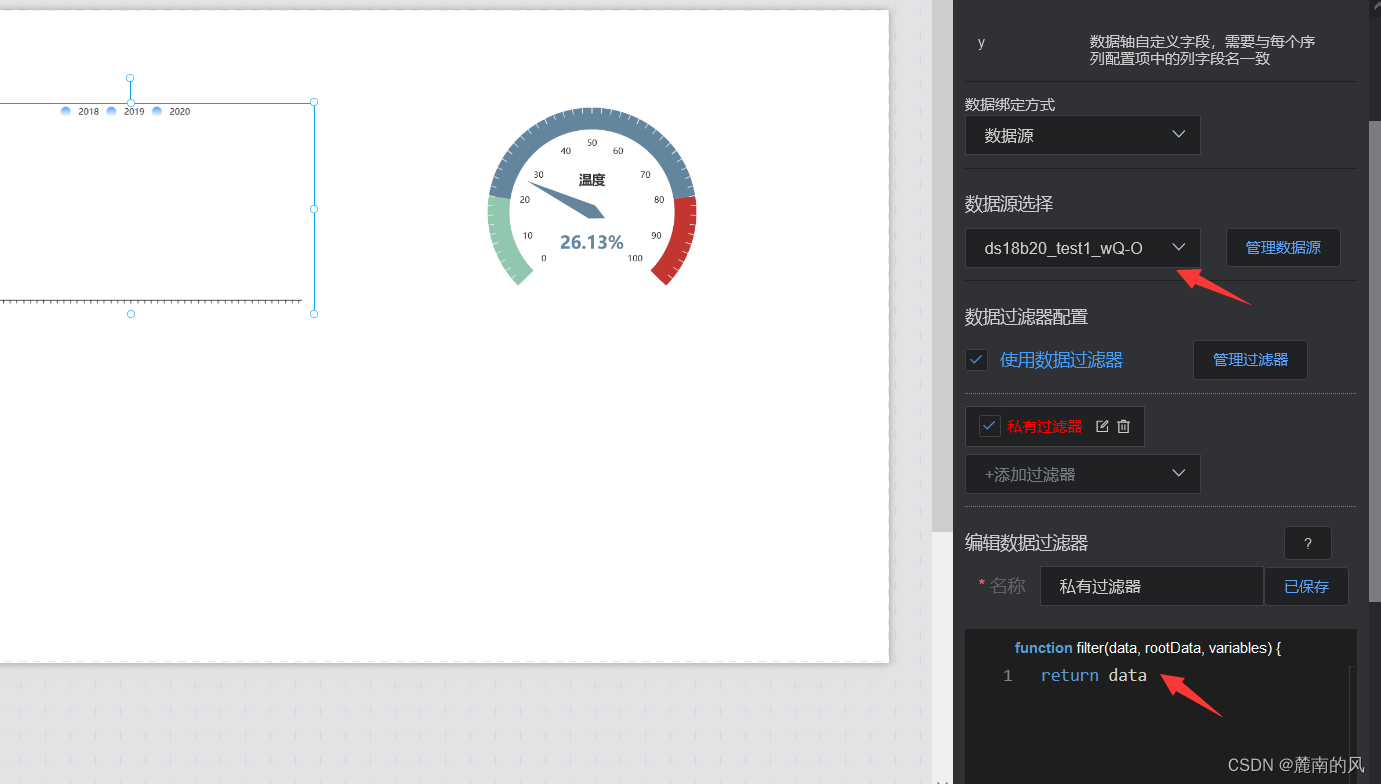
So we introduce the graph
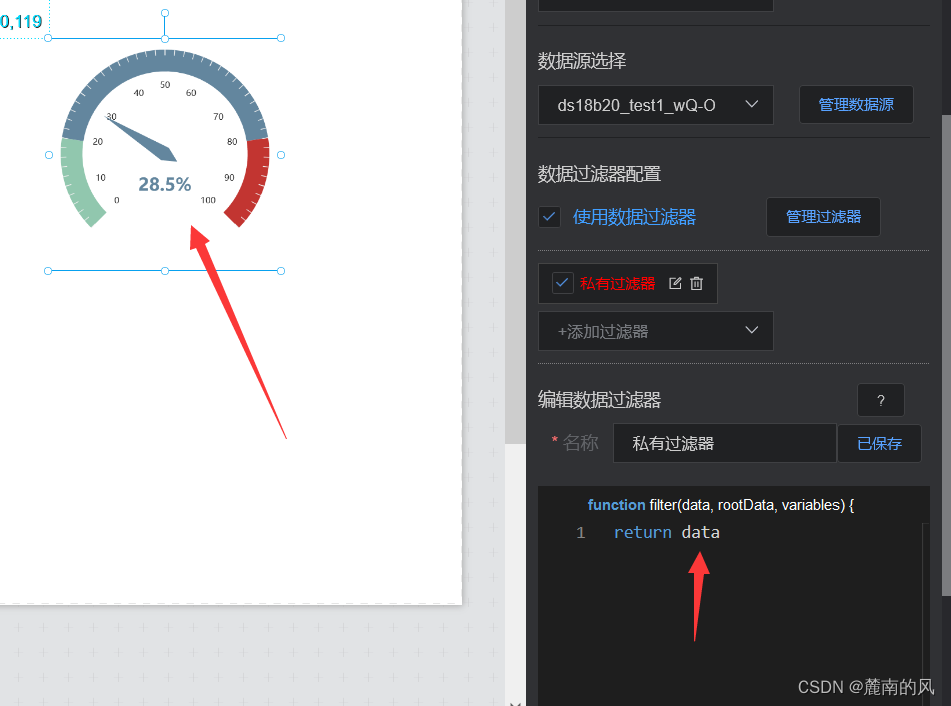
Select the defined graph , After adding data sources , Modify private filter , Return the data stream data( preservation !)
Then open the data processing results , There are many groups of data , We need to select useful data to help draw , such as Upload time , The uploaded Sampling value ( temperature )
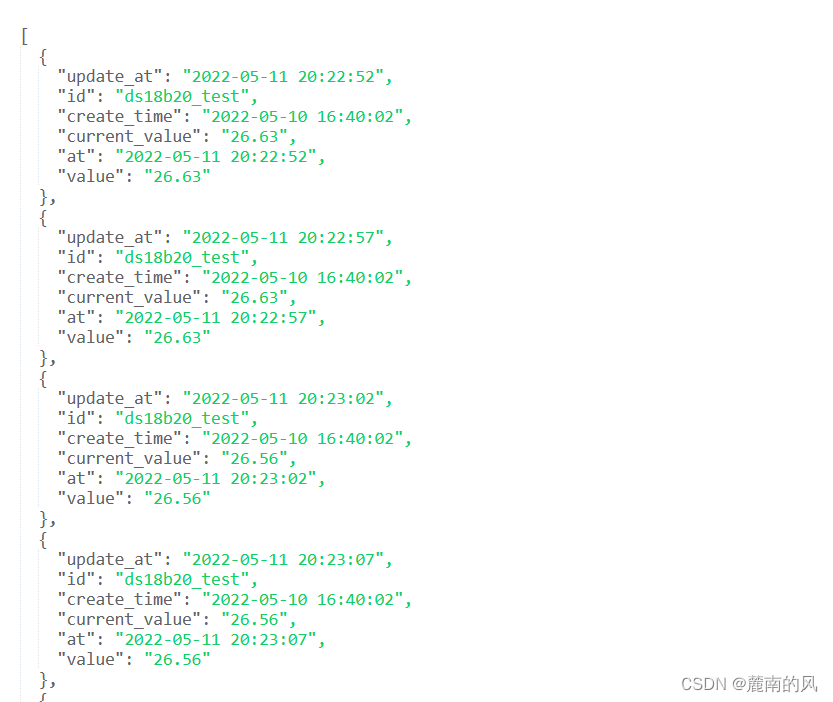
Usually, the results returned by the data source are mostly array types , Each element can be processed through iteration .
Open the private filter
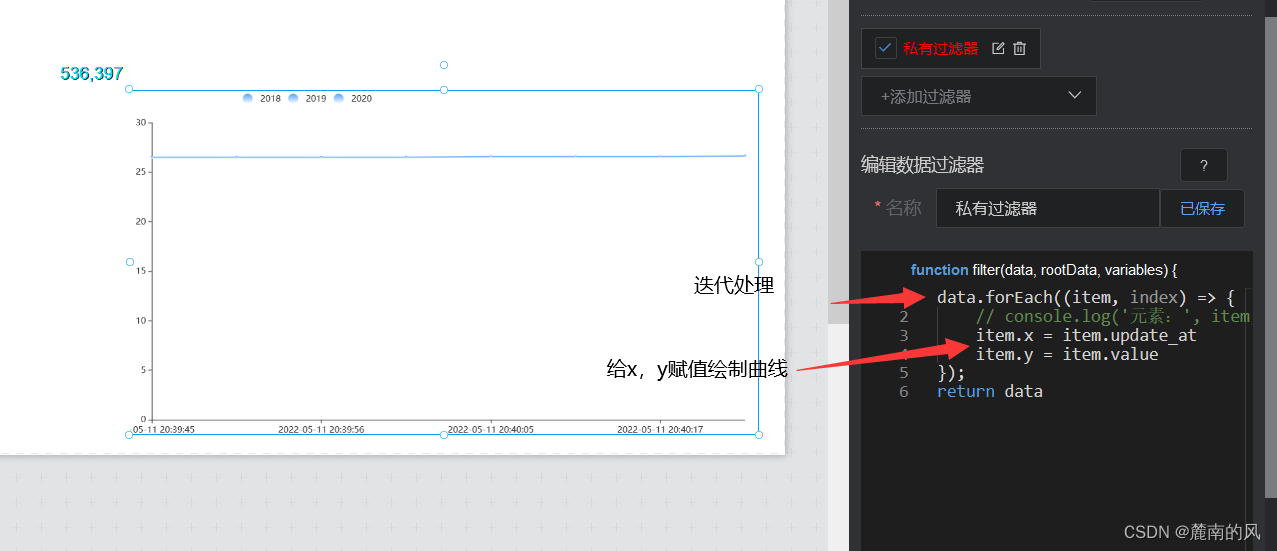
Curve code segment
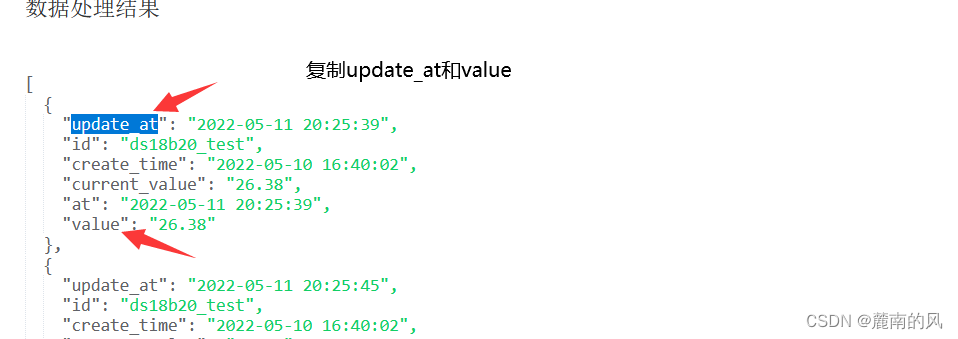
data.forEach((item, index) => {
    // console.log(' Elements :', item, '; Subscript :', index);
    item.x = item.update_at
    item.y = item.value
});
return data 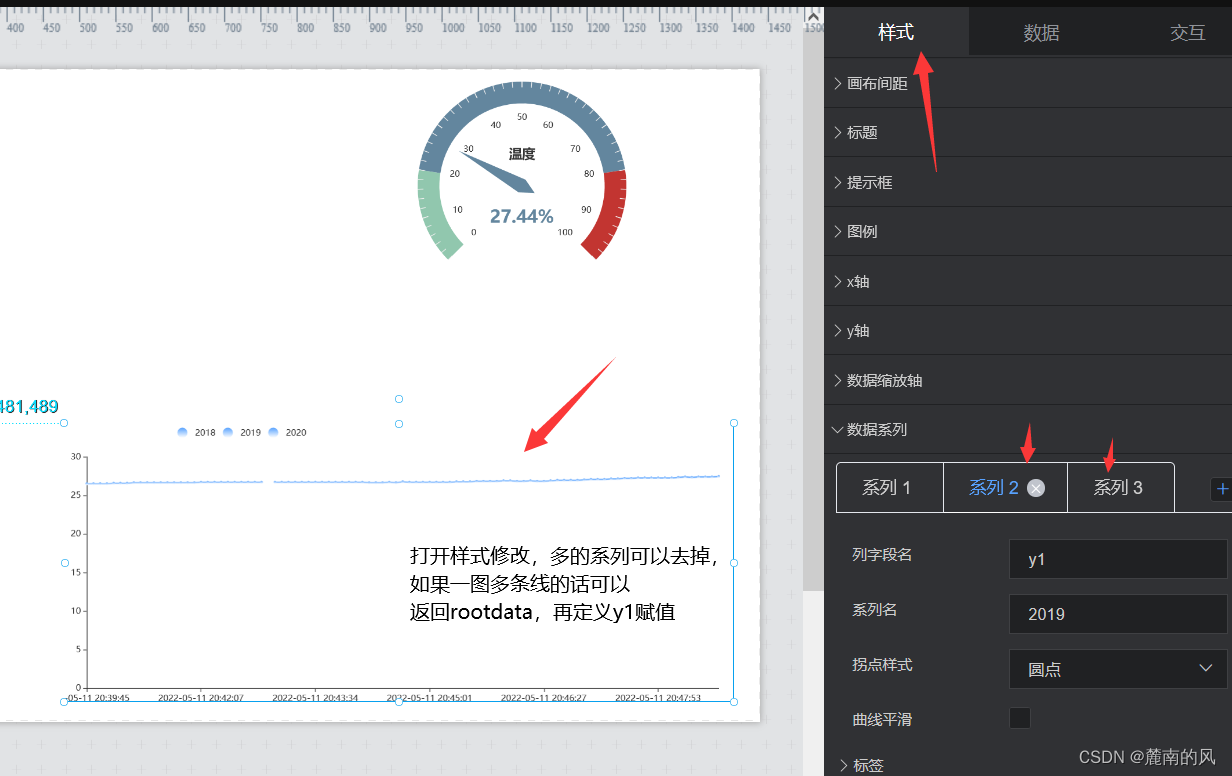
The same is true for uploading multiple devices and data streams
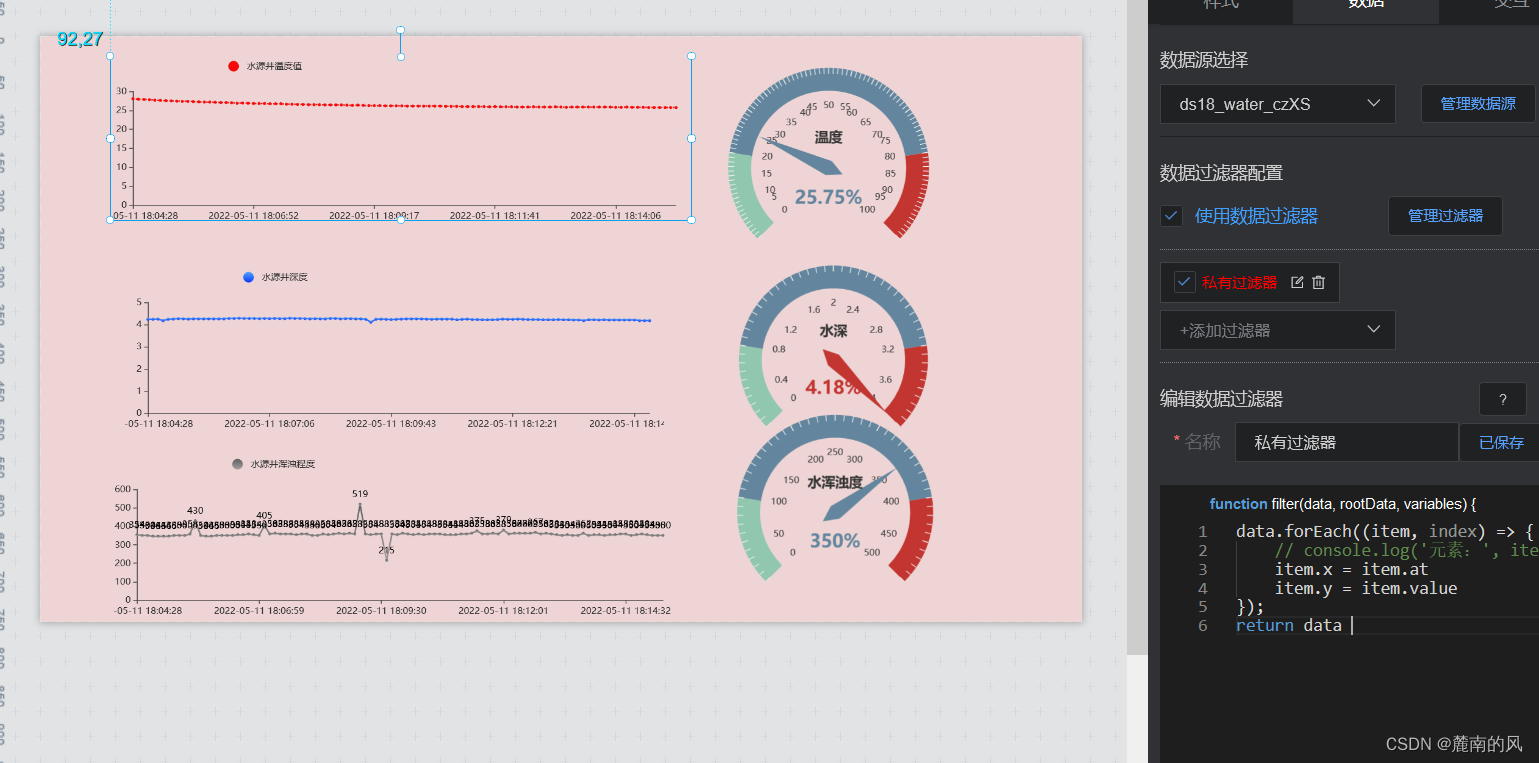
link
( The personal visualization was later redone for the project , Temporarily close access )
Be careful
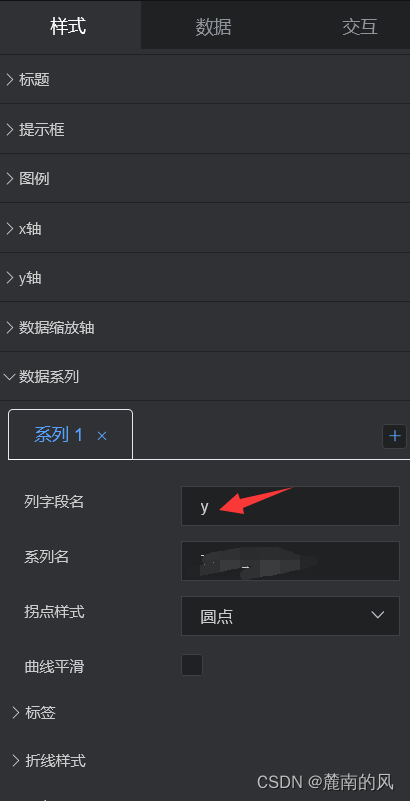
After reading the comments, I found that some people did not draw , There is no problem with the process , There is a small detail to pay attention to
When importing general charts, there are three series , After copying the program, only x Axis update , It's because of here y The axis field name is y1, And the program assignment is y, Just modify here
I'll do it again when I'm free rootdata Use
Welcome to exchange
边栏推荐
猜你喜欢
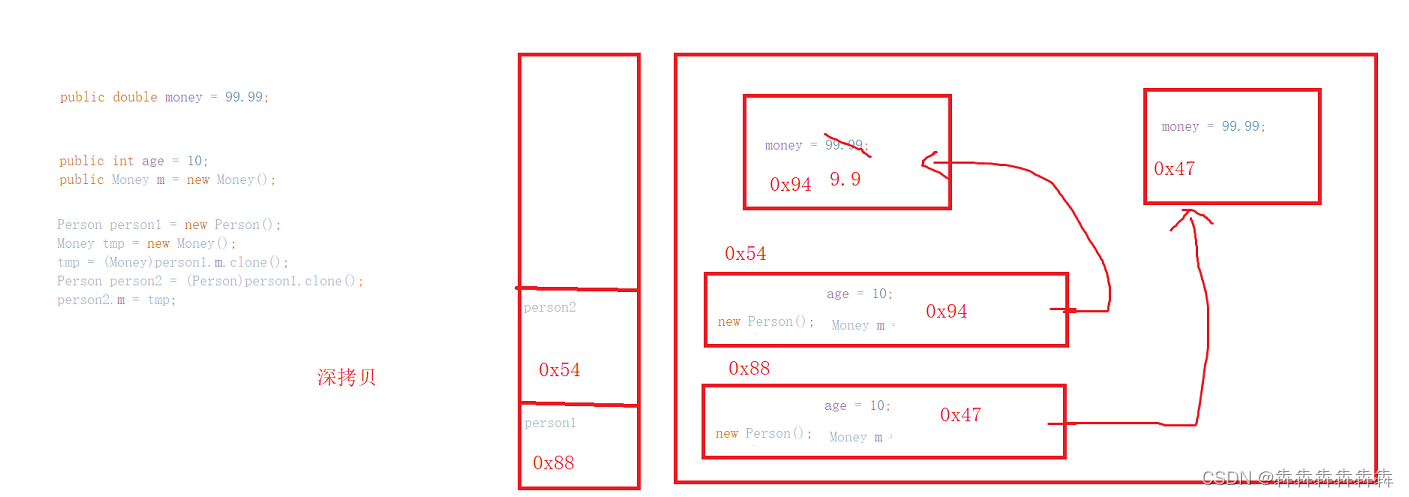
Abstract classes and interfaces
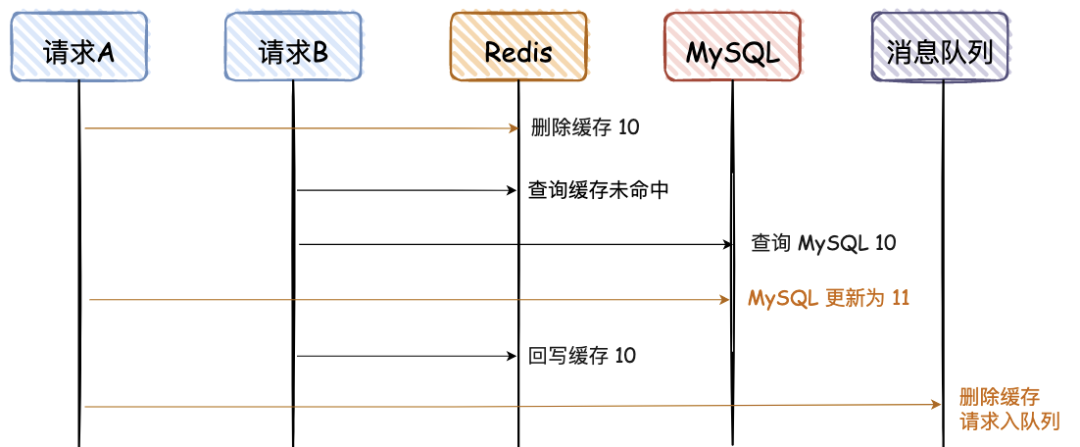
如何保障 MySQL 和 Redis 的数据一致性?
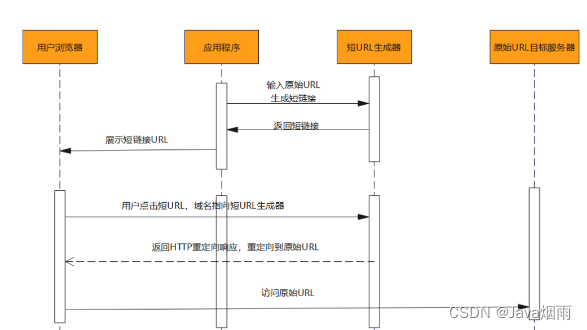
架构师怎样绘制系统架构蓝图?
How to ensure data consistency between MySQL and redis?
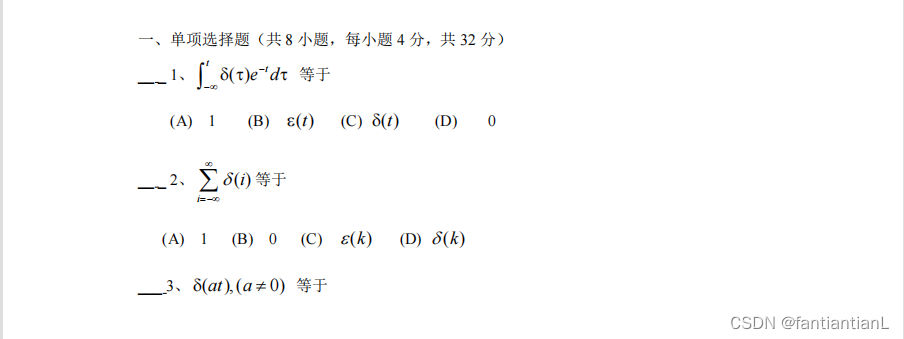
西安电子科技大学22学年上学期《信号与系统》试题及答案
Edit distance (multi-source BFS)

Fairygui bar subfamily (scroll bar, slider, progress bar)
TYUT太原理工大学2022软工导论大题汇总

121道分布式面试题和答案
12 excel charts and arrays
随机推荐
String类
阿里云微服务(一)服务注册中心Nacos以及REST Template和Feign Client
13 power map
十分鐘徹底掌握緩存擊穿、緩存穿透、緩存雪崩
Conceptual model design of the 2022 database of tyut Taiyuan University of Technology
First acquaintance with C language (Part 2)
Error: sorting and subscript out of bounds
TYUT太原理工大学2022数据库考试题型大纲
(超详细onenet TCP协议接入)arduino+esp8266-01s接入物联网平台,上传实时采集数据/TCP透传(以及lua脚本如何获取和编写)
Alibaba cloud microservices (I) service registry Nacos, rest template and feign client
记录:动态Web项目servlet访问数据库404错误之解决
TYUT太原理工大学2022数据库大题之概念模型设计
Record: solution of 404 error of servlet accessing database in dynamic web project
MPLS experiment
The earth revolves around the sun
架构师怎样绘制系统架构蓝图?
Fgui project packaging and Publishing & importing unity & the way to display the UI
ROS machine voice
Application architecture of large live broadcast platform
阿里云微服务(三)Sentinel开源流控熔断降级组件