当前位置:网站首页>Using clip path to draw irregular graphics
Using clip path to draw irregular graphics
2022-07-06 19:28:00 【Buer blog】
In the daily development process UI Designers will have irregular shapes and designs , In most cases, we use background images to render irregular shapes , But this is related to performance optimization Reduce HTTP request The principle of is contrary .
for instance UI The designer wants us to render a diamond with gradient colors .

Maybe you think you can pass transform: skew(-10deg) Function to tilt the graph , This seems to be a good plan , But we want to add some content .
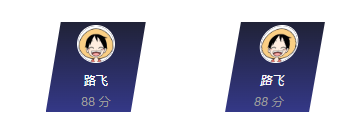
As shown on the right side of the figure below, we use transform: skew(-10deg) Change the tilt angle of your element , But its internal elements also inherit the parent transform Attribute is skewed . Obviously this is not UI The effect the designer wants .
At this moment, there must be a witty partner saying , Since the child element inherits the parent element transform: skew(-10deg) attribute , So let's set the sub element transform: skew(10deg) Attribute is OK ?
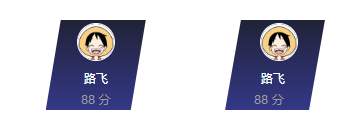
At this moment, there is a new problem , Although we have made the sub elements display horizontally , But the midpoint of our element also tilts , Also can't reach UI The designer's requirements .
And it's actually very simple to achieve the effect , We just need clip-path To replace transform that will do .
// transform: skew(-10deg);
clip-path: polygon(0% 100%, 15% 0%, 100% 0%, 85% 100%);
clip-path
seeing the name of a thing one thinks of its function ,clip-path Is a clipping path , Display in the path , Hidden outside the path .
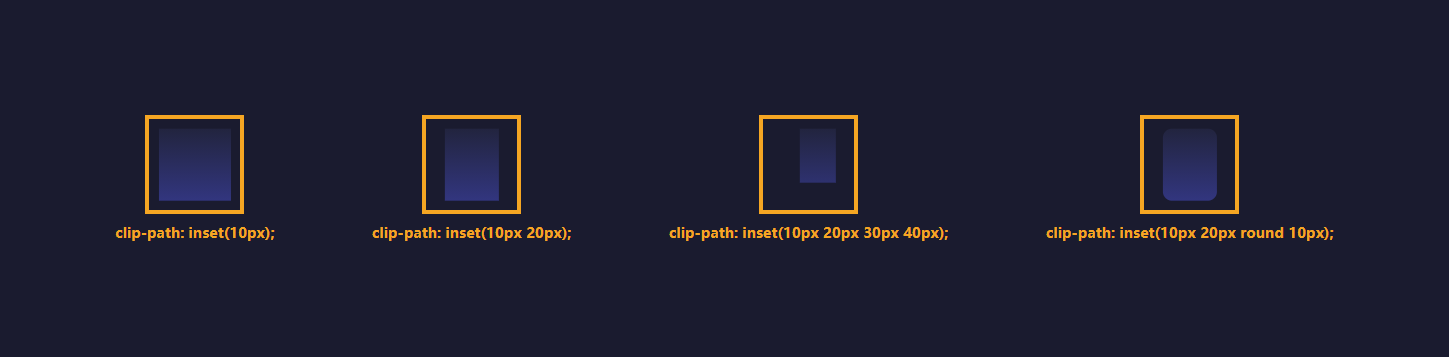
inset rectangular
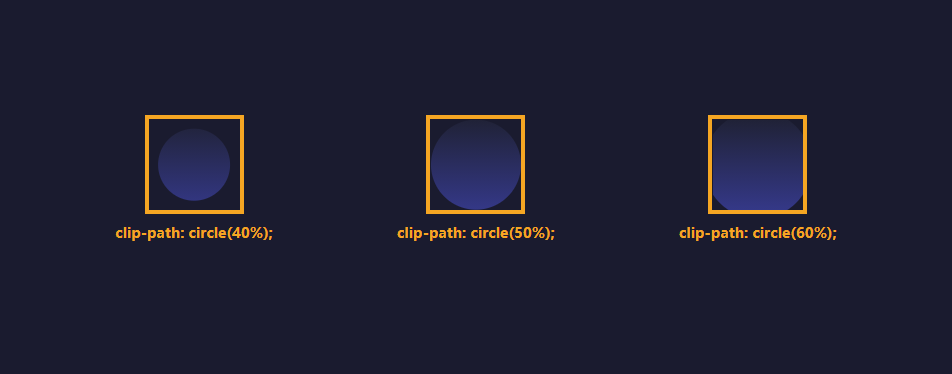
circle circular
ellipse The ellipse
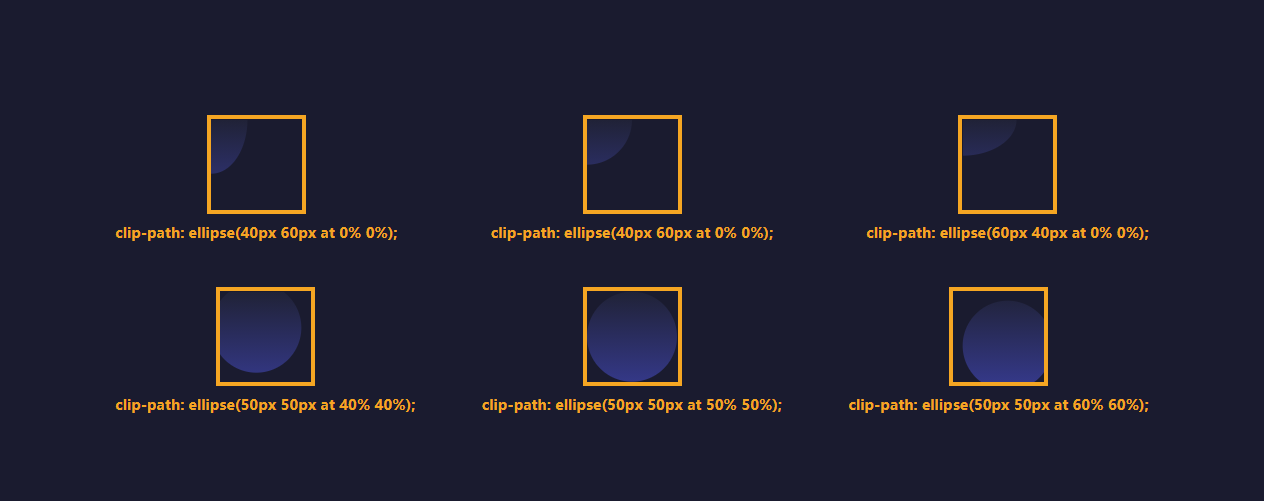
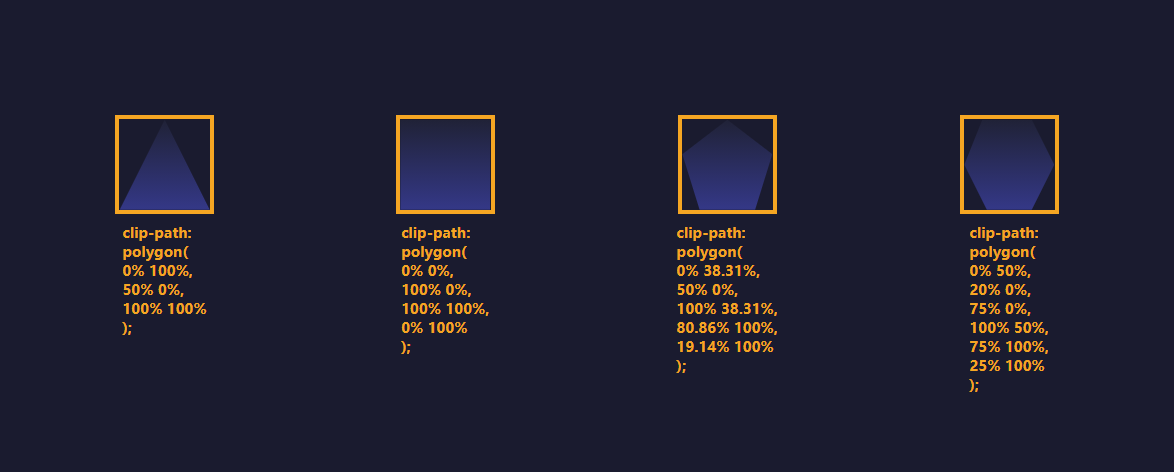
polygon polygon
What about? , Now see the above properties , Reflect on the previous project , There will be clip-path Places that can be replaced or simplified .
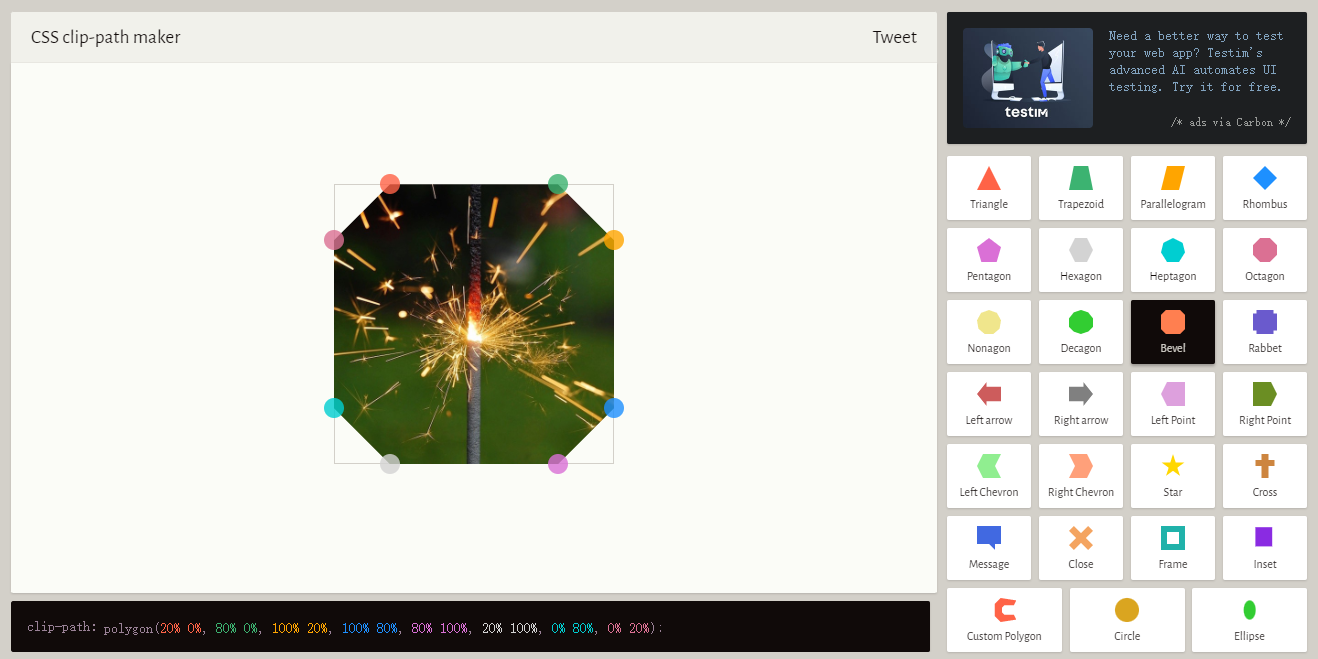
Here is a recommendation clip-path Visualization tools , It can help us quickly build the desired graphics .
https://bennettfeely.com/clippy/
url route
In addition to the above basic graphics , We can also set svg Cut as our path .
<!--  love  svg -->
<svg>
  <clipPath id="love" clipPathUnits="objectBoundingBox">
    <path
      d="M0.5,1
      C 0.5,1,0,0.7,0,0.3
      A 0.25,0.25,1,1,1,0.5,0.3
      A 0.25,0.25,1,1,1,1,0.3
      C 1,0.7,0.5,1,0.5,1 Z"
    />
  </clipPath>
</svg>

<style>
div {
  clip-path: url(#love);
}
</style>

extend
That's all clip-path Some commonly used properties of , So can we pass clip-path What effect is achieved ?
For example, let's draw a chat window containing bubble messages .

<div class="message">
  <div class="message-pohoto">
    <img src="./logo.png" alt="" />
  </div>
  <div class="message-text">
     There is nothing like keeping yourself excellent all the time, which makes people feel hard . From this day onwards , Give up your obsession with excellence . Instead of clinging to excellence , Let yourself have the courage not to escape anything . No fear of failure , Push forward the work decisively , Let yourself become the brave one who dares to face everything as soon as possible .
  </div>
</div>
<style>
  body,
  html {
    background-color: #f9f9f9;
  }

  .message {
    display: flex;
    align-items: flex-start;
    padding: 20px 10px;
  }

  .message-pohoto {
    padding-right: 20px;
  }

  .message-pohoto > img {
    width: 46px;
    height: 46px;
    border-radius: 50%;
  }

  .message-text {
    display: inline-block;
    position: relative;
    min-height: 46px;
    box-sizing: border-box;
    display: flex;
    align-items: center;
    color: #fff;
    font-size: 14px;
    padding: 10px 10px 10px 15px;
    --bg: linear-gradient(45deg, #ff3c41, #ff9800);
    filter: drop-shadow(0 0 4px rgba(0, 0, 0, 0.5));
  }

  .message-text::before,
  .message-text::after {
    content: "";
    position: absolute;
    width: 100%;
    height: 100%;
    left: 0;
    top: 0;
    background: var(--bg);
    z-index: -1;
  }

  .message-text::before {
    clip-path: inset(0 0 0 5px round 5px);
  }
  .message-text::after {
    clip-path: polygon(0% 23px, 5px calc(23px + 5px), 5px calc(23px - 5px));
  }
summary
clip-path You can cut out all kinds of irregular shapes , Good use can simplify our work , At the same time, it can also achieve many special effects , It is very worthy of everyone to learn and apply ~
Last
Thanks for reading ~
If you find this article helpful , give the thumbs-up 、 Watching is the biggest support !
边栏推荐
- LeetCode_格雷编码_中等_89.格雷编码
- 受益匪浅,安卓面试问题
- Swiftui game source code Encyclopedia of Snake game based on geometryreader and preference
- Interview assault 63: how to remove duplication in MySQL?
- GCC [7] - compilation checks the declaration of functions, and link checks the definition bugs of functions
- How to access localhost:8000 by mobile phone
- Fast power template for inverse element, the role of inverse element and example [the 20th summer competition of Shanghai University Programming League] permutation counting
- About image reading and processing, etc
- MRO工业品企业采购系统:如何精细化采购协同管理?想要升级的工业品企业必看!
- PMP practice once a day | don't get lost in the exam -7.6
猜你喜欢
![[translation] a GPU approach to particle physics](/img/07/57036c925155cab36678c696e89440.jpg)
[translation] a GPU approach to particle physics
Php+redis realizes the function of canceling orders over time
Interface test tool - postman
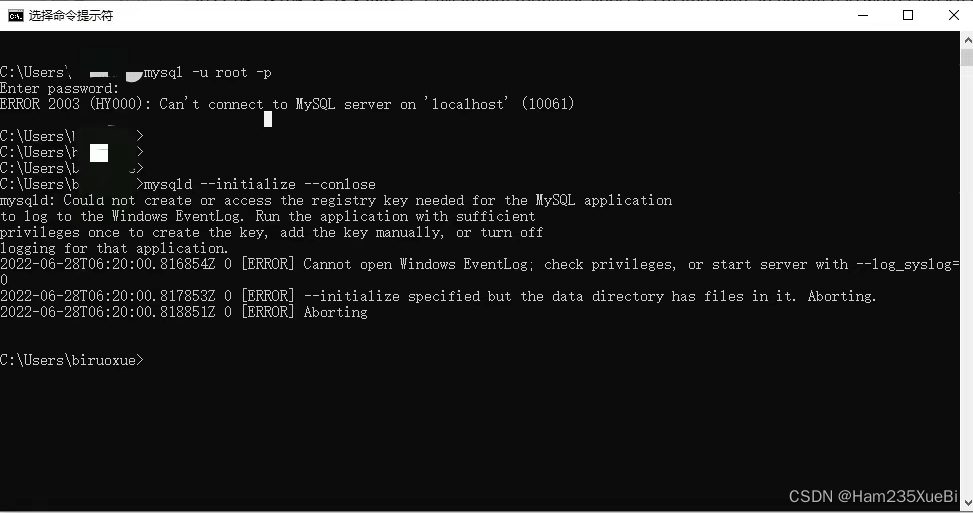
An error occurs when installing MySQL: could not create or access the registry key needed for the
学习探索-无缝轮播图

Based on butterfly species recognition
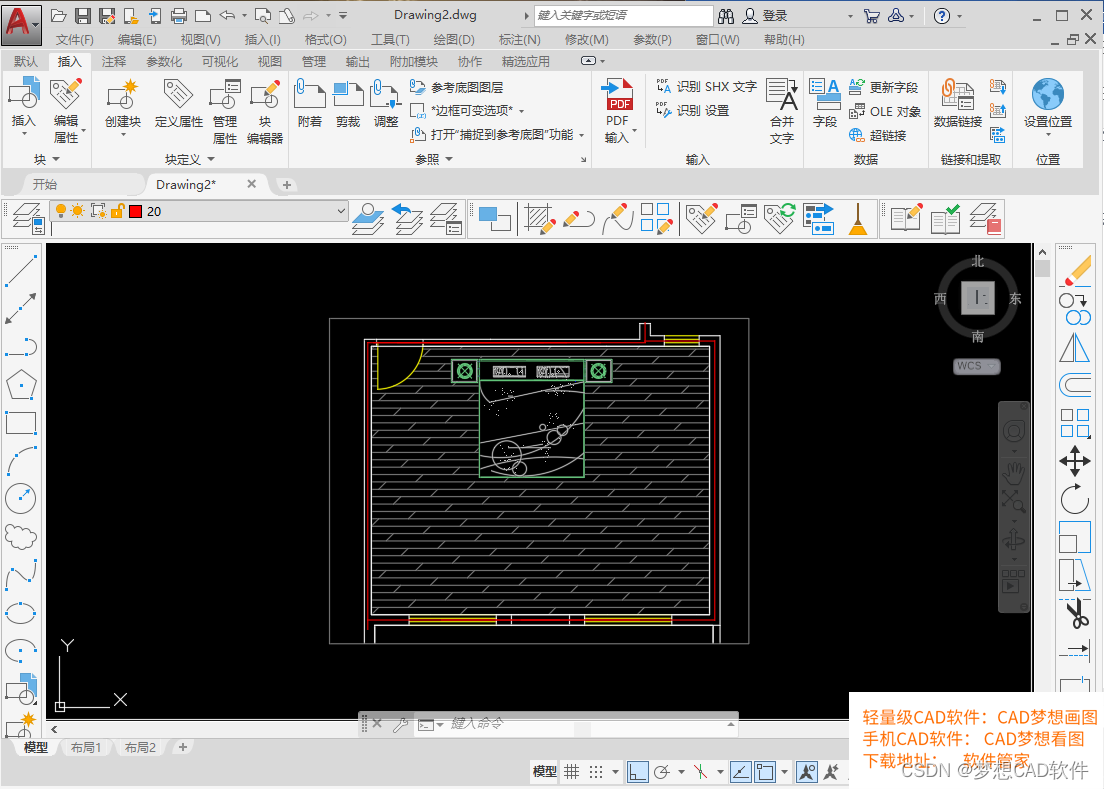
AutoCAD - what is the default lineweight for centerline drawing and CAD? Can I modify it?
C language daily practice - day 22: Zero foundation learning dynamic planning
利用 clip-path 绘制不规则的图形

JDBC details
随机推荐
PMP practice once a day | don't get lost in the exam -7.6
In 50W, what have I done right?
[translation] a GPU approach to particle physics
时钟轮在 RPC 中的应用
Interface test tool - postman
LeetCode-1279. 红绿灯路口
R language uses the order function to sort the dataframe data, and descending sorting based on a single field (variable)
How to do smoke test
Test technology stack arrangement -- self cultivation of test development engineers
map的使用(列表的数据赋值到表单,json逗号隔开显示赋值)
凤凰架构3——事务处理
【翻译】云原生观察能力微调查。普罗米修斯引领潮流,但要了解系统的健康状况仍有障碍...
In depth analysis, Android interview real problem analysis is popular all over the network
Digital "new" operation and maintenance of energy industry
IC设计流程中需要使用到的文件
如何自定义动漫头像?这6个免费精品在线卡通头像生成器,看一眼就怦然心动!
谷粒商城--分布式高级篇P129~P339(完结)
利用 clip-path 绘制不规则的图形
Use of map (the data of the list is assigned to the form, and the JSON comma separated display assignment)
R language ggplot2 visual time series histogram: visual time series histogram through two-color gradient color matching color theme