当前位置:网站首页>Lecture 2 Linear Model Linear Model
Lecture 2 Linear Model Linear Model
2022-08-05 05:23:00 【A long way to go】
参考资料
- 一句话解释numpy.meshgrid()
- matplotlib教程之——Custom profiles and drawing styles(rcParams和style)
- python中zip()函数的用法
- matplotlib之plot()详解
- matplotlib 3D绘图警告
课堂练习
实现线性模型y=wx的平面图
import numpy as np
import matplotlib.pyplot as plt

#保存数据集,The same index is a sample
x_data = [1.0, 2.0, 3.0]
y_data = [2.0, 4.0, 6.0]

#Feedforward of the model
def forward(x):
    return x * w

#损失函数
def loss(x, y):
    y_pred = forward(x)         #According to the feedforward requirementy_hat
    return (y_pred - y) ** 2    #计算损失


# 穷举法
w_list = []     #权重
mse_list = []   #The loss value corresponding to the weight
for w in np.arange(0.0, 4.1, 0.1):
    print("w=", w)
    l_sum = 0
    #从x_data, y_data取出x_val, y_val
    for x_val, y_val in zip(x_data, y_data):
        y_pred_val = forward(x_val)
        loss_val = loss(x_val, y_val)
        l_sum += loss_val
        print('x_val==', x_val, 'y_val==',y_val, 'y_pred_val==',y_pred_val,'loss_val==', loss_val)
    print('MSE=', l_sum / 3)
    w_list.append(w)
    mse_list.append(l_sum / 3)

#调用画图
plt.plot(w_list, mse_list)
plt.ylabel('Loss')
plt.xlabel('w')
plt.show()
pattern trace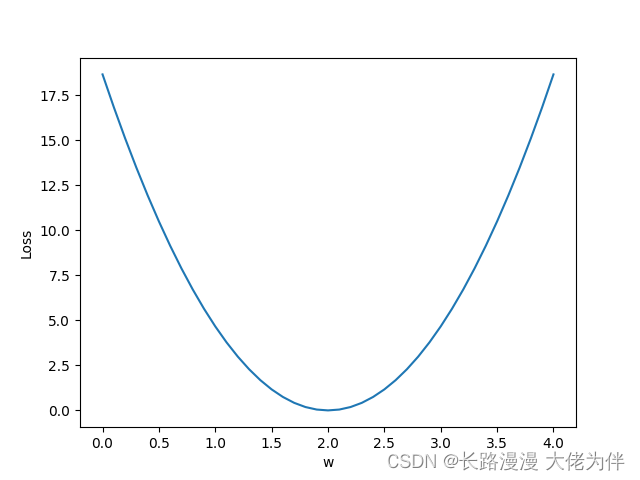
课后练习
实现线性模型(y=wx+b)并输出loss的3D图像
There are several issues that need to be addressed here
1.w,b的取值
in previous class practice,只需要取一个w,因此可以用for循环取值.Correction is required in the exercises after classw,bTwo values for value operation,因此要使用meshgrid函数
2.Images cannot be displayed in Chinese
Add in front
from pylab import * mpl.rcParams[‘font.sans-serif’] = [‘SimHei’]
3.matplotlib 3D绘图警告
matplotlib 3D绘图警告
Code for homework exercises:
import numpy as np
import matplotlib.pyplot as plt
from mpl_toolkits.mplot3d import Axes3D
from pylab import *
mpl.rcParams['font.sans-serif'] = ['SimHei']
#Here the function is set to y=3x+2
x_data = [1.0,2.0,3.0]
y_data = [5.0,8.0,11.0]

def forward(x):
    return x * w + b

def loss(x,y):
    y_pred = forward(x)
    return (y_pred-y)*(y_pred-y)

mse_list = []
W=np.arange(0.0,4.1,0.1)
B=np.arange(0.0,4.1,0.1)

w,b=np.meshgrid(W,B)
# print("w==",w)
# print('b==',b)

l_sum = 0
for x_val, y_val in zip(x_data, y_data):
    y_pred_val = forward(x_val)
    loss_val = loss(x_val, y_val)
    print('x_val==', x_val,'\ny_val==', y_val,'\ny_pred_val==', y_pred_val, '\nloss_val==',loss_val)
    l_sum += loss_val

fig = plt.figure()
ax = Axes3D(fig,auto_add_to_figure=False)
fig.add_axes(ax)
ax.plot_surface(w, b, l_sum/3)
ax.set_xlabel("权重 W")
ax.set_ylabel("偏置项 B")
ax.set_zlabel("损失值")
plt.show()
3D图: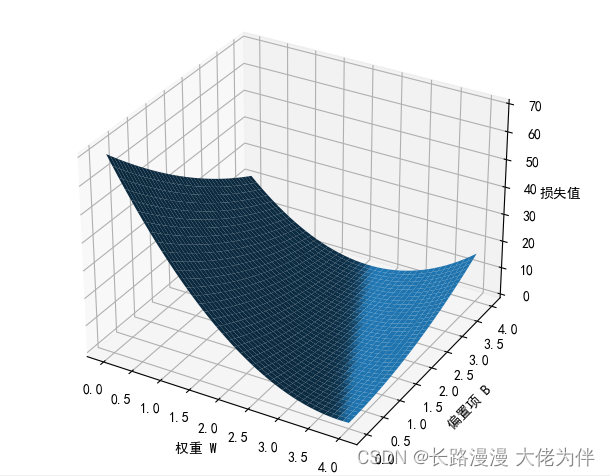
边栏推荐
- 第三讲 Gradient Tutorial梯度下降与随机梯度下降
- A blog clears the Redis technology stack
- Flutter学习三-Flutter基本结构和原理
- ESP32 485 Illuminance
- 【微信小程序】WXML模板语法-条件渲染
- 【练一下1】糖尿病遗传风险检测挑战赛 【讯飞开放平台】
- pycharm中调用Matlab配置:No module named ‘matlab.engine‘; ‘matlab‘ is not a package
- Structured Light 3D Reconstruction (2) Line Structured Light 3D Reconstruction
- Qt produces 18 frames of Cupid to express his love, is it your Cupid!!!
- [Decoding tools] Some online tools for Bitcoin
猜你喜欢
![[cesium] element highlighting](/img/99/504ca9802db83eb33bc6d91b34fa84.png)


随机推荐
Flutter学习4-基本UI组件
Opencv中,imag=cv2.cvtColor(imag,cv2.COLOR_BGR2GRAY) 报错:error:!_src.empty() in function ‘cv::cvtColor‘
Wise Force Deleter强制删除工具
Mysql5.7 二进制 部署
Algorithms - ones and zeros (Kotlin)
1.3 mysql批量插入数据
开发一套高容错分布式系统
数字_获取指定位数的小数
Dashboard Display | DataEase Look at China: Data Presents China's Capital Market
第三讲 Gradient Tutorial梯度下降与随机梯度下降
Mesos学习
物理层的接口有哪几个方面的特性?各包含些什么内容?
2022 Hangzhou Electric Multi-School 1st Session 01
Judgment statement _switch and case
使用二维码解决固定资产管理的难题
2023 International Conference on Information and Communication Engineering (JCICE 2023)
小白一枚各位大牛轻虐虐
OFDM 十六讲 5 -Discrete Convolution, ISI and ICI on DMT/OFDM Systems
【过一下10】sklearn使用记录
jvm three heap and stack