当前位置:网站首页>Alibaba cloud Prometheus monitoring service
Alibaba cloud Prometheus monitoring service
2022-07-02 09:54:00 【Don't talk about Xiao Li】
What is? Prometheus?
Prometheus Is an open source system monitoring and alerting toolkit
Native Prometheus:Overview | Prometheus
working principle :prometheus Introduction of the principle _ Yuan Sheng's blog -CSDN Blog _prometheus principle
frame :

Alibaba cloud Prometheus
1. brief introduction :
Alibaba cloud Prometheus Monitoring and comprehensive docking Prometheus ecology , Support component monitoring with rich types , Provide a variety of out of the box preset monitoring market , And provide fully managed Prometheus service .
Please refer to Alibaba cloud Prometheus Official documents explain .
explain Prometheus It is an open source monitoring and alarm system . The main features include multidimensional data model 、 Flexible query statements PromQL And visual display of data . For more information , Please see the Prometheus Official documents .
2. Use : Application real-time monitoring service ARMS
1) establish Prometheusf example
for The cloud service :
1. Suitable for passing Prometheus Monitor to collect 、 Scenarios for storing and displaying monitoring data of various Alibaba cloud services . Supported cloud services include ECS、RDS、 Message service RocketMQ、 Message service Kafka etc.
2. At present, our company's services are deployed ecs , Alibaba cloud Prometheus Direct access .

for VPC:
1. Suitable for Alibaba cloud VPC Inside ( Usually it is ECS colony ) Conduct Prometheus The scene of monitoring . You can add... Through the integration center VPC Monitoring of applications and components in .
2. At present, our company's redis,mq And other components are deployed in ecs But for independence , Not Alibaba cloud integrated components , So use vpc Instance to monitor

After creation, you can see the instance list .

2) Component access
Enter the access center , Select the components to be accessed , Here we choose three components of our company , For database RDS Direct access to cloud services , There is no need to monitor

Configure the accessed components : Enter the corresponding address and port password

3) Configure related security groups , Enable data to be monitored
As shown below , After adding corresponding components , You need to check whether the corresponding port is in the security group white list

Security group link , If it is already within the scope, there is no need to add

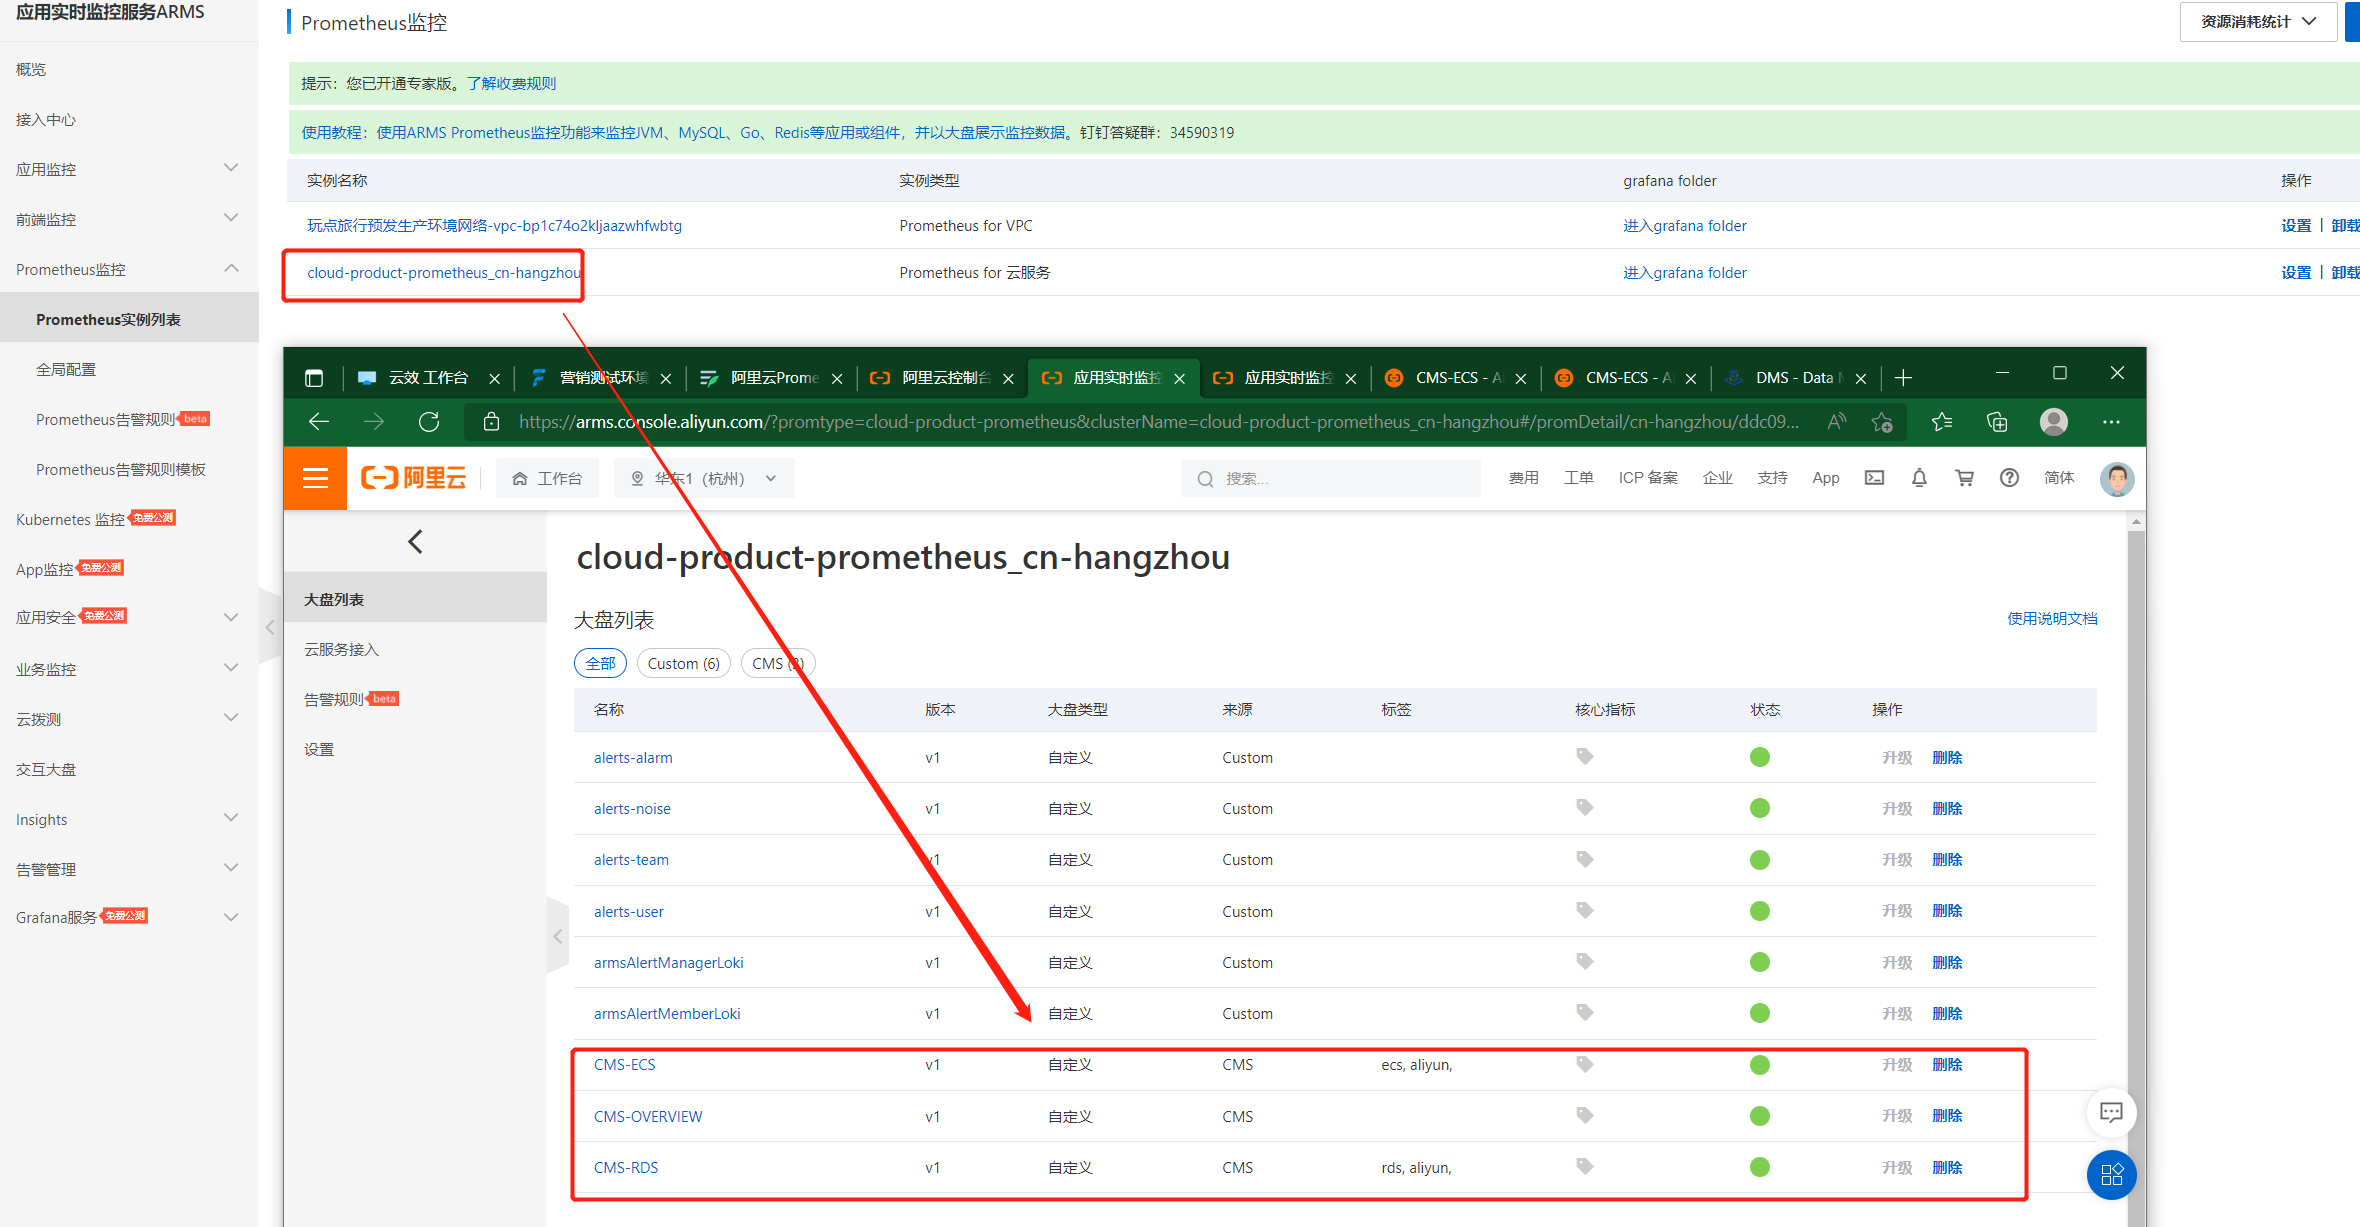
4) Check the market list
After access, the vpc The list of monitored components can be seen in the instance

View the monitored in the cloud service instance list ecs Services and rds
Enter cloud services ecs Monitoring interface , Select the service you want to view , You can view the real-time service

5) Monitor alarms and notifications
Set up contacts
Real people and robots can be set Real people can be added directly The robot is as follows :
1. Choose group chat to create robot

2. Copy the robot address here Add

Set alarm rules

1. Customize PromQL For Alibaba cloud products , Static threshold is for k8s pod Of memory
2. We choose to customize PromQL that will do , And select the monitoring examples
3. Select the reference index , Or write it yourself PromQL
4. The alarm content can be edited , To distinguish which service sent it , You can print the instance name { { $labels.instanceName }} The system used to print id You can't tell which service it is at a glance .
5. You can select the corresponding notification policy , Or not .
Be careful : Because the warning rules can only monitor the target accurately example And which cloud products cannot be distinguished from which specific services , Therefore, you cannot create alarm rules for specific services , Nor can it be created for any environment , It can only be distinguished by creating and assigning different notification policies Different environments and services . See notification strategy

Set notification policy
1. For services that need to be monitored , Or create notification policies in specific environments
2. This strategy can be assigned to specific alarm rules .
3. Save and enable after creation

Alarm handling
1.Prometheus The created alarm will be sent to the corresponding contact through the notification strategy
2. After receiving the alarm , The alarm can be handled , If it is not handled, the alarm will be sent continuously after the set time , Until the alarm is restored

边栏推荐
- 三相并网逆变器PI控制——离网模式
- BugkuCTF-web24(解题思路及步骤)
- Junit5 支持suite的方法
- MySQL default transaction isolation level and row lock
- Safety production early warning system software - Download safety production app software
- XA Transaction SQL Statements
- 2837xd Code Generation - Supplement (1)
- 2837xd 代码生成——补充(1)
- Vs+qt set application icon
- Personal experience & blog status
猜你喜欢
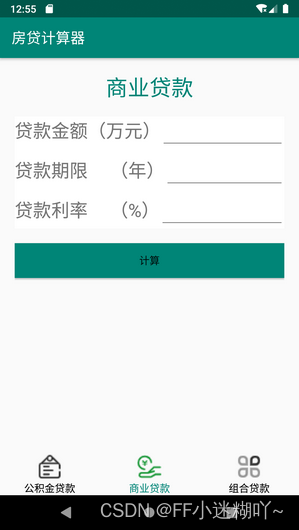
FragmentTabHost实现房贷计算器界面

BugkuCTF-web21(详细解题思路及步骤)
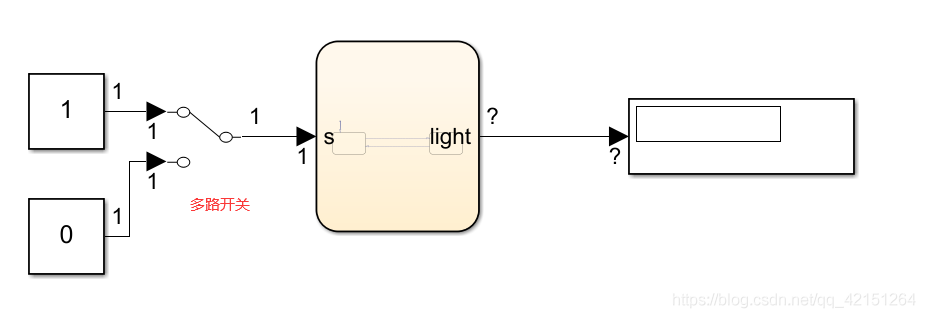
2837xd code generation - stateflow (1)

The latest progress and development trend of 2022 intelligent voice technology
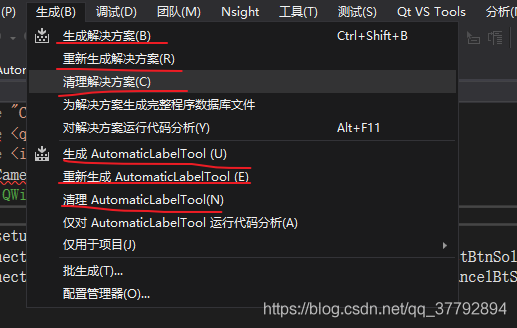
Vs+qt set application icon
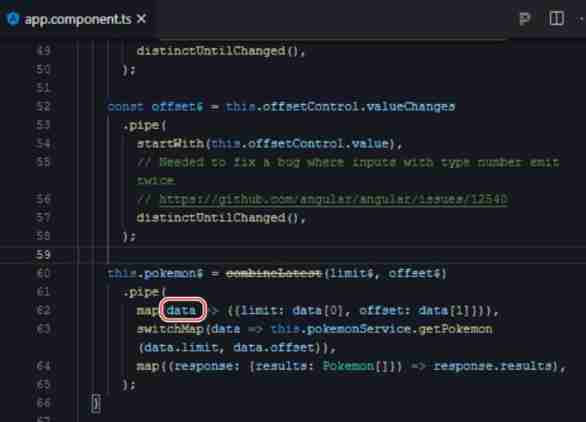
Learn combinelatest through a practical example
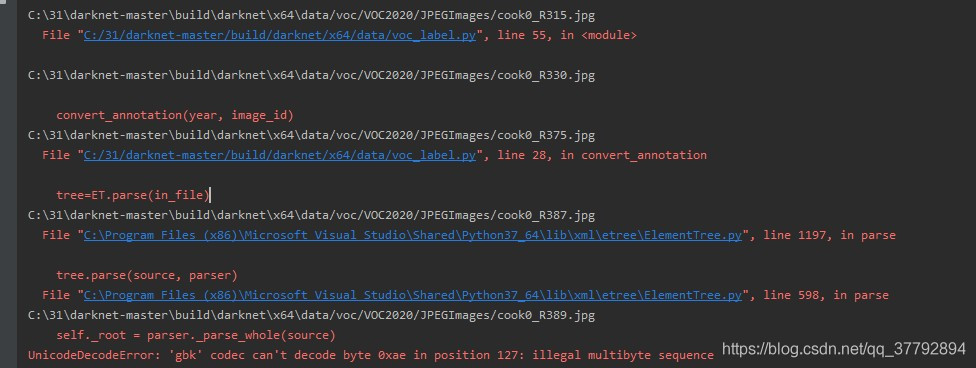
YOLO物体识别,生成数据用到的工具

Operation and application of stack and queue

TD联合Modelsim进行功能仿真

2837xd 代码生成——补充(3)
随机推荐
图像识别-数据增广
2837xd code generation - stateflow (4)
PI control of grid connected inverter (grid connected mode)
Read Day6 30 minutes before going to bed every day_ Day6_ Date_ Calendar_ LocalDate_ TimeStamp_ LocalTime
Attack and defense world web advanced area unserialize3
2837xd 代码生成——StateFlow(3)
Cmake command - Official Document
Record personal understanding and experience of game console configuration
Off grid control of three-phase inverter - PR control
How to install PHP in CentOS
In SQL injection, why must the ID of union joint query be equal to 0
Image recognition - data augmentation
C语言之数据插入
2837xd 代码生成——StateFlow(1)
阿里云ack介绍
What are the differences between TP5 and laravel
每天睡觉前30分钟阅读_day3_Files
Image recognition - Data Acquisition
Junit4运行mvn test 测试套件升级方案
Because of hard work, the fruit goes with fate