当前位置:网站首页>Catalogue of digital image processing experiments
Catalogue of digital image processing experiments
2022-07-02 23:11:00 【Atractylodes macrocephala_ Zhuling】
matlab Learn and operate Fourier transform and frequency domain processing of images
matlab Learning and operation
Experimental content :
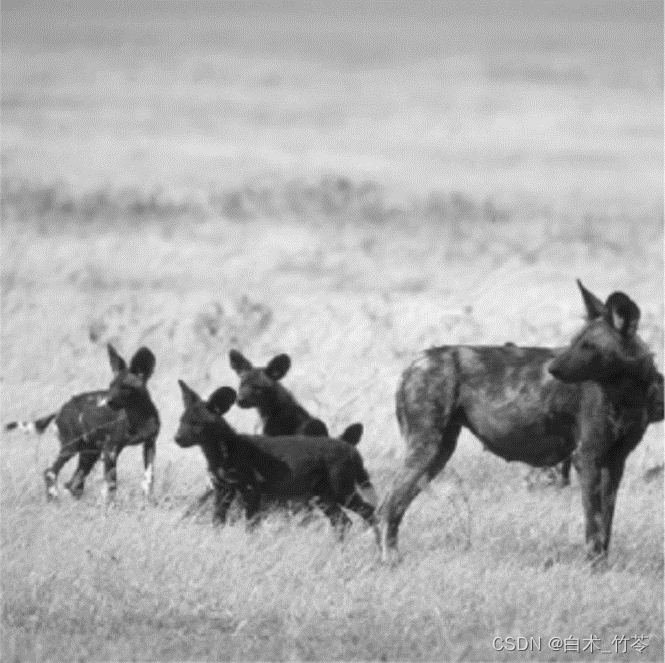
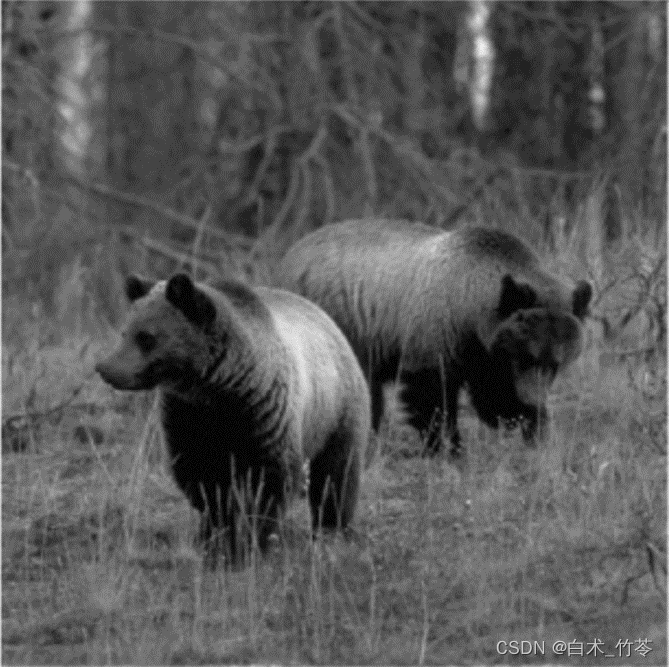
6. Read in two color images , And display the size information of the image respectively , Crop the two pictures to the same square size , And save it as two new pictures A and B.
7. Put two color images A And B In different proportions (0.7:0.3, 0.5: 0.5, 0.3:0.7) Add and synthesize a new image , And display the original image in an image window 、 Three composite images .
8. Take the image from RGB Color space is converted to gray space , Use the weighting method 、 Mean value method and maximum value method 、 as well as matlab Self contained function rgb2gray.
The weighting method is GRAY=0.3R+0.59G+0.11*B
The mean method is GRAY= (R+G+B)/3
The maximum value is GRAY= max(R,G,B)
And display these four gray-scale images in an image window , And make a discussion .
9. According to the gray transformation curve , Carry out gray-scale mapping transformation on a gray-scale image , And display the original image and the transformed image in the same window .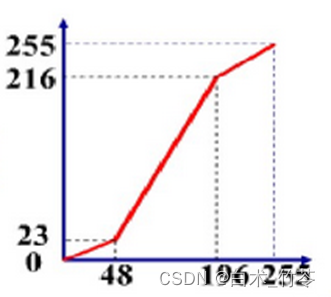
Fourier transform and frequency domain processing 
1. Generate a bright block image as shown in the figure f(x,y)(256×256 size 、 dark place =0, Bright place =255), On the FFT:
(1) The original picture is displayed on the same screen f and FFT(f) Amplitude spectrum of ( Tips : Use two-dimensional Fourier transform function fft2, To avoid excessive changes in Fourier transform data , Display the result after logarithmic transformation log(1.001+abs(FFT(f))) , use imshow or surf The function shows the spectrum );
(2) If order f1(x,y)=(-1)x+y f(x,y), Repeat the above process , Compare the similarities and differences of their amplitude spectra , Brief reasons ;
(3) If the f (x,y) Clockwise rotation 45 Degrees get f2(x,y), Trial display FFT(f2) Amplitude spectrum of , And with FFT(f) The amplitude spectrum of .( Tips : use imrotate Function to rotate the image );
10. Yes, one 256×256 size 、256 Gray level digital images are carried out in the frequency domain of the ideal low-pass 、 High pass filtering , The original picture is displayed on the same screen 、 Amplitude spectrum and low pass 、 Result diagram of high pass filtering .( Tips : Use two-dimensional Fourier transform function fft2, Two dimensional inverse Fourier transform function ifft2, Centralization function fftshift, Decentralized function ifftshift. Adopt different cut-off frequencies D0 Repeat the experiment , Observations )
Resource guidance : Digital image experiment ——matlab Learn and operate Fourier transform and frequency domain processing of images
experiment 2 Image spatial enhancement and image enhancement based on histogram
Spatial enhancement of image
Experimental content :
1. Read in a picture 256 Grayscale digital image
2. Image smoothing and filtering
1) Gaussian noise is added to the original image respectively 、 Salt and pepper noise .
2) Using the neighborhood average method , We adopt 3×3,5×5, 7×7, 9×9 The template smoothes the noisy image , Show the original image 、 Noisy image and processed image .
3) Using median filtering , We adopt 33,55, 77, 99 The template denoises the noisy image , Show the original image 、 Noisy image and processed image .
4) Compare the processing results of various filtering methods and filtering templates
answer : The neighborhood average method is to take the average value of a circle around each pixel , To reduce some sudden changes in pixel values ( Noise point ) Influence . One obvious result is : While suppressing noise, the image becomes blurred , That is, the details of the image ( For example, edge information ) Weakened ; Median filtering is for every pixel , Take the median value of the surrounding pixel value , To replace the gray value of the pixel . It can suppress noise and keep details .
3. Image sharpening
1) utilize Laplacian Sharpening operator (α=-1) Yes 256 Sharpen the gray-scale digital image , Show before processing 、 Post image .
2) Laplacian sharpening is performed on the image with noise , Compare with the processing result of the image without noise .
3) Separate use Roberts、Prewitt and Sobel Edge detector , Edge detection of digital image , Show before processing 、 Post image .
Think about the problem :
1. Mean filtering is adopted 、 median filtering , Which is more effective to suppress Gaussian noise or salt and pepper noise ?
2. Different template sizes , What is the difference in the treatment effect ? Why? ?
3. Yes Laplacian In the processing result of sharpening operator , For less than 0 Part of , Adopt different methods to standardize to [0,255] when , What is the difference between the display effect of the image ? Why? ?
Image enhancement based on histogram
Experimental content :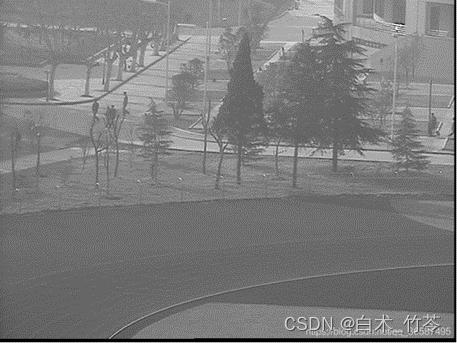

1. Using functions imhist Histogram equalization of the original image , The images before and after processing and their histograms are displayed on the same screen , Compare the similarities and differences , It also discusses why the histogram of digital image is not completely evenly distributed after equalization .
2. Using functions histeq The histogram of the original image is specified , The images before and after processing and their histograms are displayed on the same screen , Compare the similarities and differences .
Additional questions , Write your own myhist Function to achieve histogram equalization .
Resource guidance : digital image processing —— Image spatial enhancement and image enhancement based on histogram
Image segmentation experiment
Experimental content :
1. Using threshold method to realize image segmentation , Try taking a variety of thresholds , Get the best results .
2. Use them separately robert,sobel And Laplace Gaussian operator for image edge detection , Compare the differences between the three operators .
Resource guidance : digital image processing —— Image segmentation experiment
Morphological experiments
Experimental content :

1. Read image 1 and 2, And binarization (im2bw).
2. Select the square respectively 、 Circular and diamond structures on the image 1 To corrode (imerode) Handle 、 inflation (imdilate) Handle 、 Open operation (bwmorph) And closed operations (bwmorph). Display the observation processing results .
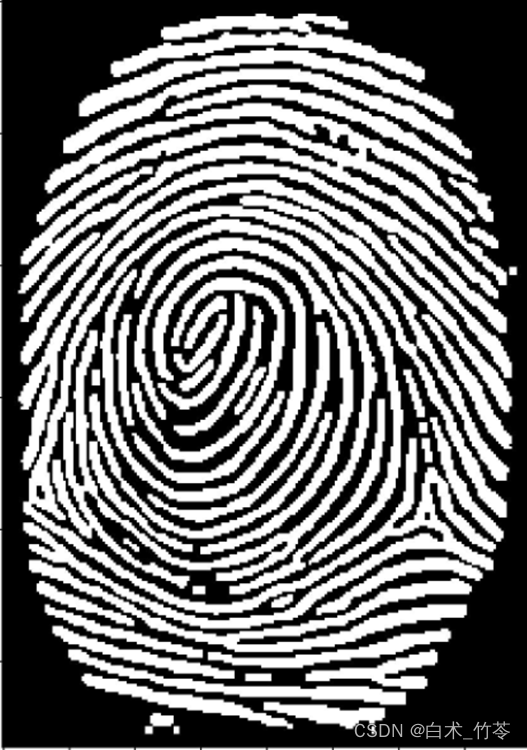
3. For fingerprint images 3, Design processing program based on morphology , Get the fingerprint image with the best processing effect you can achieve .
Resource guidance : digital image processing —— Morphological experiments
边栏推荐
- [chestnut sugar GIS] how does global mapper batch produce ground contour lines through DSM
- Tronapi-波场接口-源码无加密-可二开--附接口文档-基于ThinkPHP5封装-作者详细指导-2022年7月1日08:43:06
- 门牌制作 C语言
- 海思调用接口之Makefile配置
- Mask R-CNN
- pytorch训练CPU占用持续增长(bug)
- Methods to solve the tampering of Chrome browser and edeg browser homepage
- 20220524_ Database process_ Statement retention
- 20220527_数据库过程_语句留档
- SQL advanced syntax
猜你喜欢
![[Yangcheng cup 2020] easyphp](/img/12/da28f738e50e625b0a66a94af3703d.png)


![[adjustment] postgraduate enrollment of Northeast Petroleum University in 2022 (including adjustment)](/img/a3/d8421ea1539eba08bf7a5a629d92e6.jpg)
![P7072 [csp-j2020] live broadcast Award](/img/bc/fcbc2b1b9595a3bd31d8577aba9b8b.png)

随机推荐
Splunk audit 的设定
聊聊内存模型与内存序
AES高級加密協議的動機闡述
Use the scroll bar of souI when using the real window in souI
潘多拉 IOT 开发板学习(HAL 库)—— 实验4 串口通讯实验(学习笔记)
Learning Websites commonly used by circuit designers
P1007 single log bridge
Loss function~
海思调用接口之Makefile配置
海思3559万能平台搭建:在截获的YUV图像上画框
密码技术---分组密码的模式
Splunk audit setting
Antd component upload uploads xlsx files and reads the contents of the files
Realize the linkage between bottomnavigationview and navigation
剑指 Offer II 099. 最小路径之和-双百代码
2016. 增量元素之间的最大差值
Pytorch training CPU usage continues to grow (Bug)
Go multithreaded data search
Static file display problem
【硬件】标准阻值的由来