当前位置:网站首页>Introduction to MATLAB drawing functions ezplot explanation
Introduction to MATLAB drawing functions ezplot explanation
2022-08-02 15:32:00 【Yang Lao head soft work】
I. Introduction
The ezplot command can be used to draw the graph of the explicit function, the graph of the implicit function, or the graph of the function determined by the parameter equation, and the system will automatically add the title of the graph, xaxis labels.While fplot is mainly used to draw graphs of explicit functions and functions determined by parametric equations, fimplicit is mainly used to draw graphs of implicit functions.So from a functional point of view, ezplot covers the fplot and fimplicit functions.However, it is not as convenient as fplot and fimplicit to use ezplot to set the color and other attributes of primitives, and you need to use set to set them.If multiple curves are drawn in a graphics window, the system automatically assigns the last function to be the title of the graph, resulting in ambiguity. You need to manually use the title command to add the title.
Second, the basic syntax of ezplot
1) Draw the graphics of the explicit function (I):
ezplot( function, interval )Its function is to draw the graph of the explicit function function on the interval interval. When the interval is default, the interval is -2π < x < 2π .The format of interval is [ min, max ].
2) Drawing the graph of the explicit function (II):
ezplot( @(varible)function, interval )The parameter variable variable is explicitly specified.Its function is to draw the graph of the explicit function function with varible as the independent variable on the interval interval. When the interval is default, the interval is -2π < x < 2π .The format of interval is [ min, max ].
3) Draw the graph of the implicit function (I):
ezplot( function, xyinterval )Its function is to draw the graph of the implicit function determined by the equation function=0 on the interval xyinterval. When xyinterval is default, the interval is -2π < x < 2π , -2π < y < 2π .The format of xyinterval is
[ xmin, xmax, ymin, ymax ].
4) Draw the graph of the implicit function (II):
ezplot( @(varibles)function, xyinterval )Its function is to draw the graph of the implicit function with varibles as 2 variables and determined by the equation function=0 on the interval xyinterval. When xyinterval is default, the interval is -2π < x < 2π , -2π < y< 2π .The format of xyinterval is [ xmin, xmax, ymin, ymax ].
5) Plot the graph of the parametric equation to determine the function (I):
ezplot( xfun, yfun, tinterval )Its function is to draw the graph of the function determined by the equation xfun=0, yfun=0 on the interval tinterval to which the parameter belongs. When tinterval is default, the interval is 0 < t < 2π.
6) Plot the graph of the parametric equation to determine the function (II):
ezplot( @(variable)xfun, @(variable)yfun, tinterval )The parameter variable variable is explicitly specified.Its function is to draw the graph of the function determined by the equation xfun=0, yfun=0 on the interval tinterval to which the parameter belongs. When tinterval is default, the interval is 0 < t < 2π.
3. Specific examples
Example 1. Draw the curve of the function y=sin(x).
% sample codeh = ezplot( 'sin(x)', [ 0, 2 * pi ] );set( h, 'LineStyle', '-.', 'color', 'r', 'LineWidth', 2 );% set primitive properties%Running result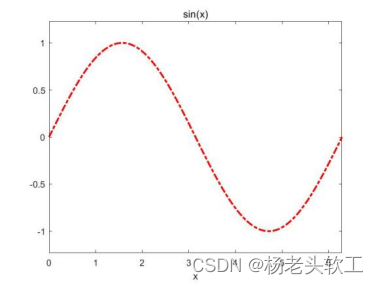
Example 2. Drawing functionThe curve of y=sin(1/x).
% sample codeezplot( @(x)sin(1./x) );%Running Results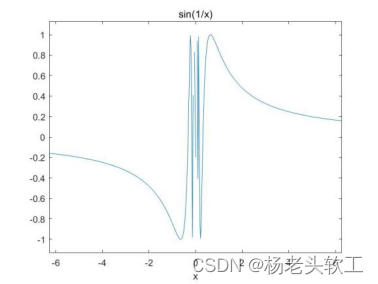
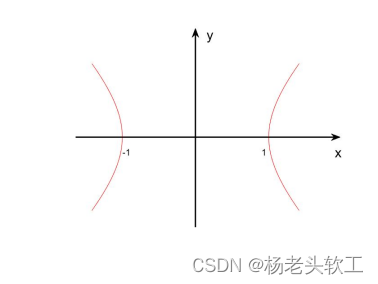
Example 3. Drawing equationThe curve represented by x^2 + y^2 = 1.
% sample codeezplot( @(x,y)x.^2 + y.^2 - 1, [ -1, 1, -1, 1 ]);axis equalaxis( [ -1.5, 1.5, -1.5, 1.5 ] )%Running result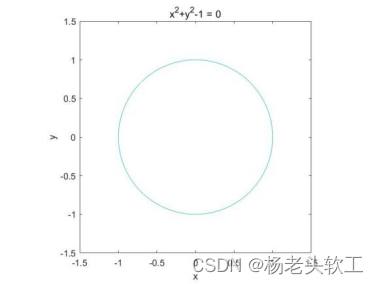
Example 4. Draw byThe curve represented by the parametric equation x=ρcos(t),y = ρsin(t).
% sample codeezplot( @(t)cos(t), @(t)sin(t), [ 0, 2*pi ]);axis equalaxis( [ -1.5, 1.5, -1.5, 1.5 ] )% Run result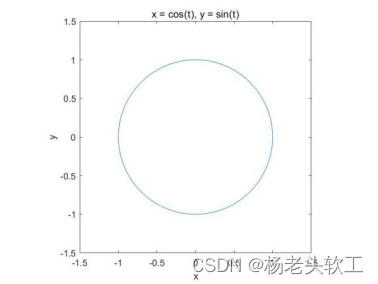
Example 5. In aThe graphics window plots the functions y=sin(x) and y=cos(x).
% sample codeezplot( 'sin(x)', [ 0, 2 * pi ] );hold onezplot( 'cos(x)', [ 0, 2 * pi ] );% running results (the title of the figure only shows cos(x) at this time)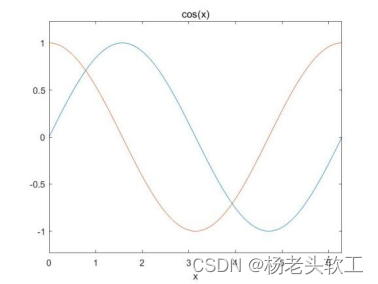
If the code is modified to:
ezplot( 'sin(x)', [ 0, 2 * pi ] );hold onezplot( 'cos(x)', [ 0, 2 * pi ] );title( 'sin(x), cos(x)' );There is an output: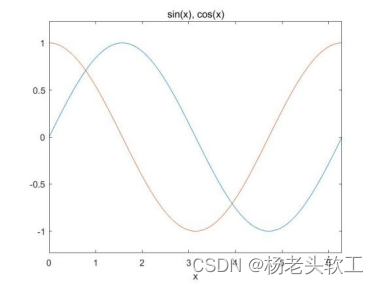
边栏推荐
- Win7怎么干净启动?如何只加载基本服务启动Win7系统
- 项目:数据库表的梳理
- Actual combat Meituan Nuxt +Vue family bucket, server-side rendering, mailbox verification, passport authentication service, map API reference, mongodb, redis and other technical points
- Mapreduce环境详细搭建和案例实现
- General code for pytorch model to libtorch and onnx format
- FP5207电池升压 5V9V12V24V36V42V大功率方案
- 利用plot_surface命令绘制复杂曲面入门详解
- KiCad常用快捷键
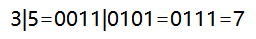
- 奇技淫巧-位运算
- pygame图像连续旋转
猜你喜欢


随机推荐
Use libcurl to upload the image of Opencv Mat to the file server, based on two methods of post request and ftp protocol
C语言函数参数传递模式入门详解
【系统设计与实现】基于flink的分心驾驶预测与数据分析系统
cmake配置libtorch报错Failed to compute shorthash for libnvrtc.so
7.Redis
Installation and configuration of Spark and related ecological components - quick recall
将SSE指令转换为ARM NEON指令
MATLAB绘图命令fimplicit绘制隐函数图形入门详解
Win7怎么干净启动?如何只加载基本服务启动Win7系统
STM32LL库使用——SPI通信
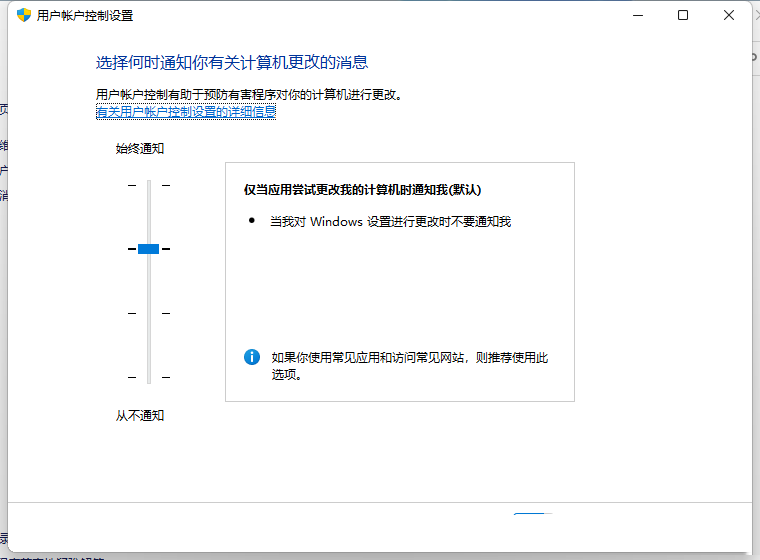
Win11 keeps popping up User Account Control how to fix it
项目:数据库表的梳理
win10系统更新错误代码0x80244022怎么办
mysql的索引结构为什么选用B+树?
模板系列-二分
Mapreduce环境详细搭建和案例实现
jest测试,组件测试
Redis常见面试题
Failed to install using npx -p @storybook/cli sb init, build a dedicated storybook by hand
使用 腾讯云搭建一个个人博客